> ## Documentation Index
> Fetch the complete documentation index at: https://axiom.co/docs/llms.txt
> Use this file to discover all available pages before exploring further.
# Connect Axiom with Convex
> Stream function executions and console logs from your Convex deployment to Axiom for powerful querying, visualization, and monitoring.
Connect Axiom with [Convex](https://convex.dev) to get comprehensive observability into your backend functions and app events. Stream function executions, console logs, and metadata from your Convex deployment to Axiom for powerful querying, data visualization, and monitoring.
 This page explains how to connecting with Convex can enhance your Axiom experience. For instructions on streaming data from Convex to Axiom, see [Send data from Convex](/send-data/convex).
## Convex and log streams
[Convex](https://convex.dev) is the backend platform that keeps your app in sync. It’s the open source, reactive database where queries are TypeScript code running right in the database. Just like React components react to state changes, Convex queries react to database changes.
Convex provides a database, a place to write your server functions, and client libraries. It makes it easy to build and scale dynamic live-updating apps.
Log streams enable streaming of events such as function executions and `console.log`s from your Convex deployment to supported destinations like Axiom, Datadog, or custom webhooks.
Log streams require a Convex Professional plan. Learn more about [Convex pricing plans](https://www.convex.dev/pricing) or upgrade your account.
## Benefits of connecting Axiom with Convex
Convex’s built-in features allow you to see the most recent logs produced by your deployment. Additionally, log streaming to Axiom provides comprehensive observability for your backend operations.
* **Historical log storage** beyond the recent logs view.
* **Powerful querying** with Axiom Processing Language (APL).
* **Advanced data visualization** and custom dashboards.
* **Integration with monitoring tools** like PagerDuty, Slack, and more.
* **Real-time alerting** based on function performance and errors.
## Analyze function performance
Convex log streams send structured data to Axiom that includes the following key fields:
* **`['data.topic']`**: Event type
* **`['data.status']`**: Execution status
* **`['data.function.path']`**: Full function path
* **`['data.function.type']`**: Function type
* **`['data.function.component_path']`**: Component path
* **`['data.execution_time_ms']`**: Function execution time in milliseconds
* **`['data.usage.database_read_documents']`**: Number of documents read
* **`['data.usage.database_read_bytes']`**: Bytes of data read
* **`['data.function.cached']`**: Cache hit indicator for queries
* **`['convex.project_slug']`**: Convex project identifier
* **`['convex.deployment_name']`**: Deployment name
* **`['convex.deployment_type']`**: Deployment type
After sending Convex log streams to Axiom, explore your Convex data and analyze your function performance using Axiom’s powerful [query capabilities](/query-data/query-editor).
Identify slow-performing functions by analyzing execution times:
```kusto theme={null}
['convex']
| where ['data.topic'] == "function_execution"
| summarize
avg_time_ms = avg(['data.execution_time_ms']),
max_time_ms = max(['data.execution_time_ms']),
total_calls = count()
by ['data.function.path']
| order by avg_time_ms desc
```
Track functions that are experiencing failures:
```kusto theme={null}
['convex']
| where ['data.topic'] == "function_execution" and ['data.status'] == "failure"
| summarize count() by ['data.function.path'], ['data.function.type']
| order by count_ desc
```
Compare performance across different function types (queries, mutations, actions):
```kusto theme={null}
['convex']
| where ['data.topic'] == "function_execution"
| summarize
total_calls = count(),
avg_duration_ms = avg(['data.execution_time_ms'])
by ['data.function.type']
```
Track database read patterns and identify resource-intensive functions:
```kusto theme={null}
['convex']
| where ['data.topic'] == "function_execution"
| summarize
avg_docs_read = avg(['data.usage.database_read_documents']),
avg_bytes_read = avg(['data.usage.database_read_bytes'])
by ['data.function.path']
| order by avg_bytes_read desc
```
Track query cache hit rates for optimization:
```kusto theme={null}
['convex']
| where ['data.topic'] == "function_execution"
and ['data.function.type'] == "query"
and isnotempty(['data.function.cached'])
| summarize
cache_hits = countif(['data.function.cached'] == true),
total_queries = count()
| extend cache_hit_rate = (cache_hits * 100) / total_queries
```
Track scheduled job lag and performance:
```kusto theme={null}
['convex']
| where ['data.topic'] == "scheduled_job_lag"
| summarize
max_lag_seconds = max(['data.lag_seconds']),
avg_lag_seconds = avg(['data.lag_seconds'])
by ['convex.project_slug'], ['convex.deployment_name']
```
## Set up monitoring and alerting
[Create monitors](/monitor-data/monitors) to get notified about issues in your Convex deployment.
Monitor functions with high error rates:
```kusto theme={null}
['convex']
| where ['data.topic'] == "function_execution"
| summarize
total_calls = count(),
failures = countif(['data.status'] == "failure")
by ['data.function.path']
| extend error_rate = (failures * 100) / total_calls
| where error_rate > 5 // Alert if error rate exceeds 5%
```
Set up alerts for functions exceeding execution time thresholds:
```kusto theme={null}
['convex']
| where ['data.topic'] == "function_execution" and ['data.execution_time_ms'] > 5000
| summarize count() by ['data.function.path']
```
## Prebuilt dashboard
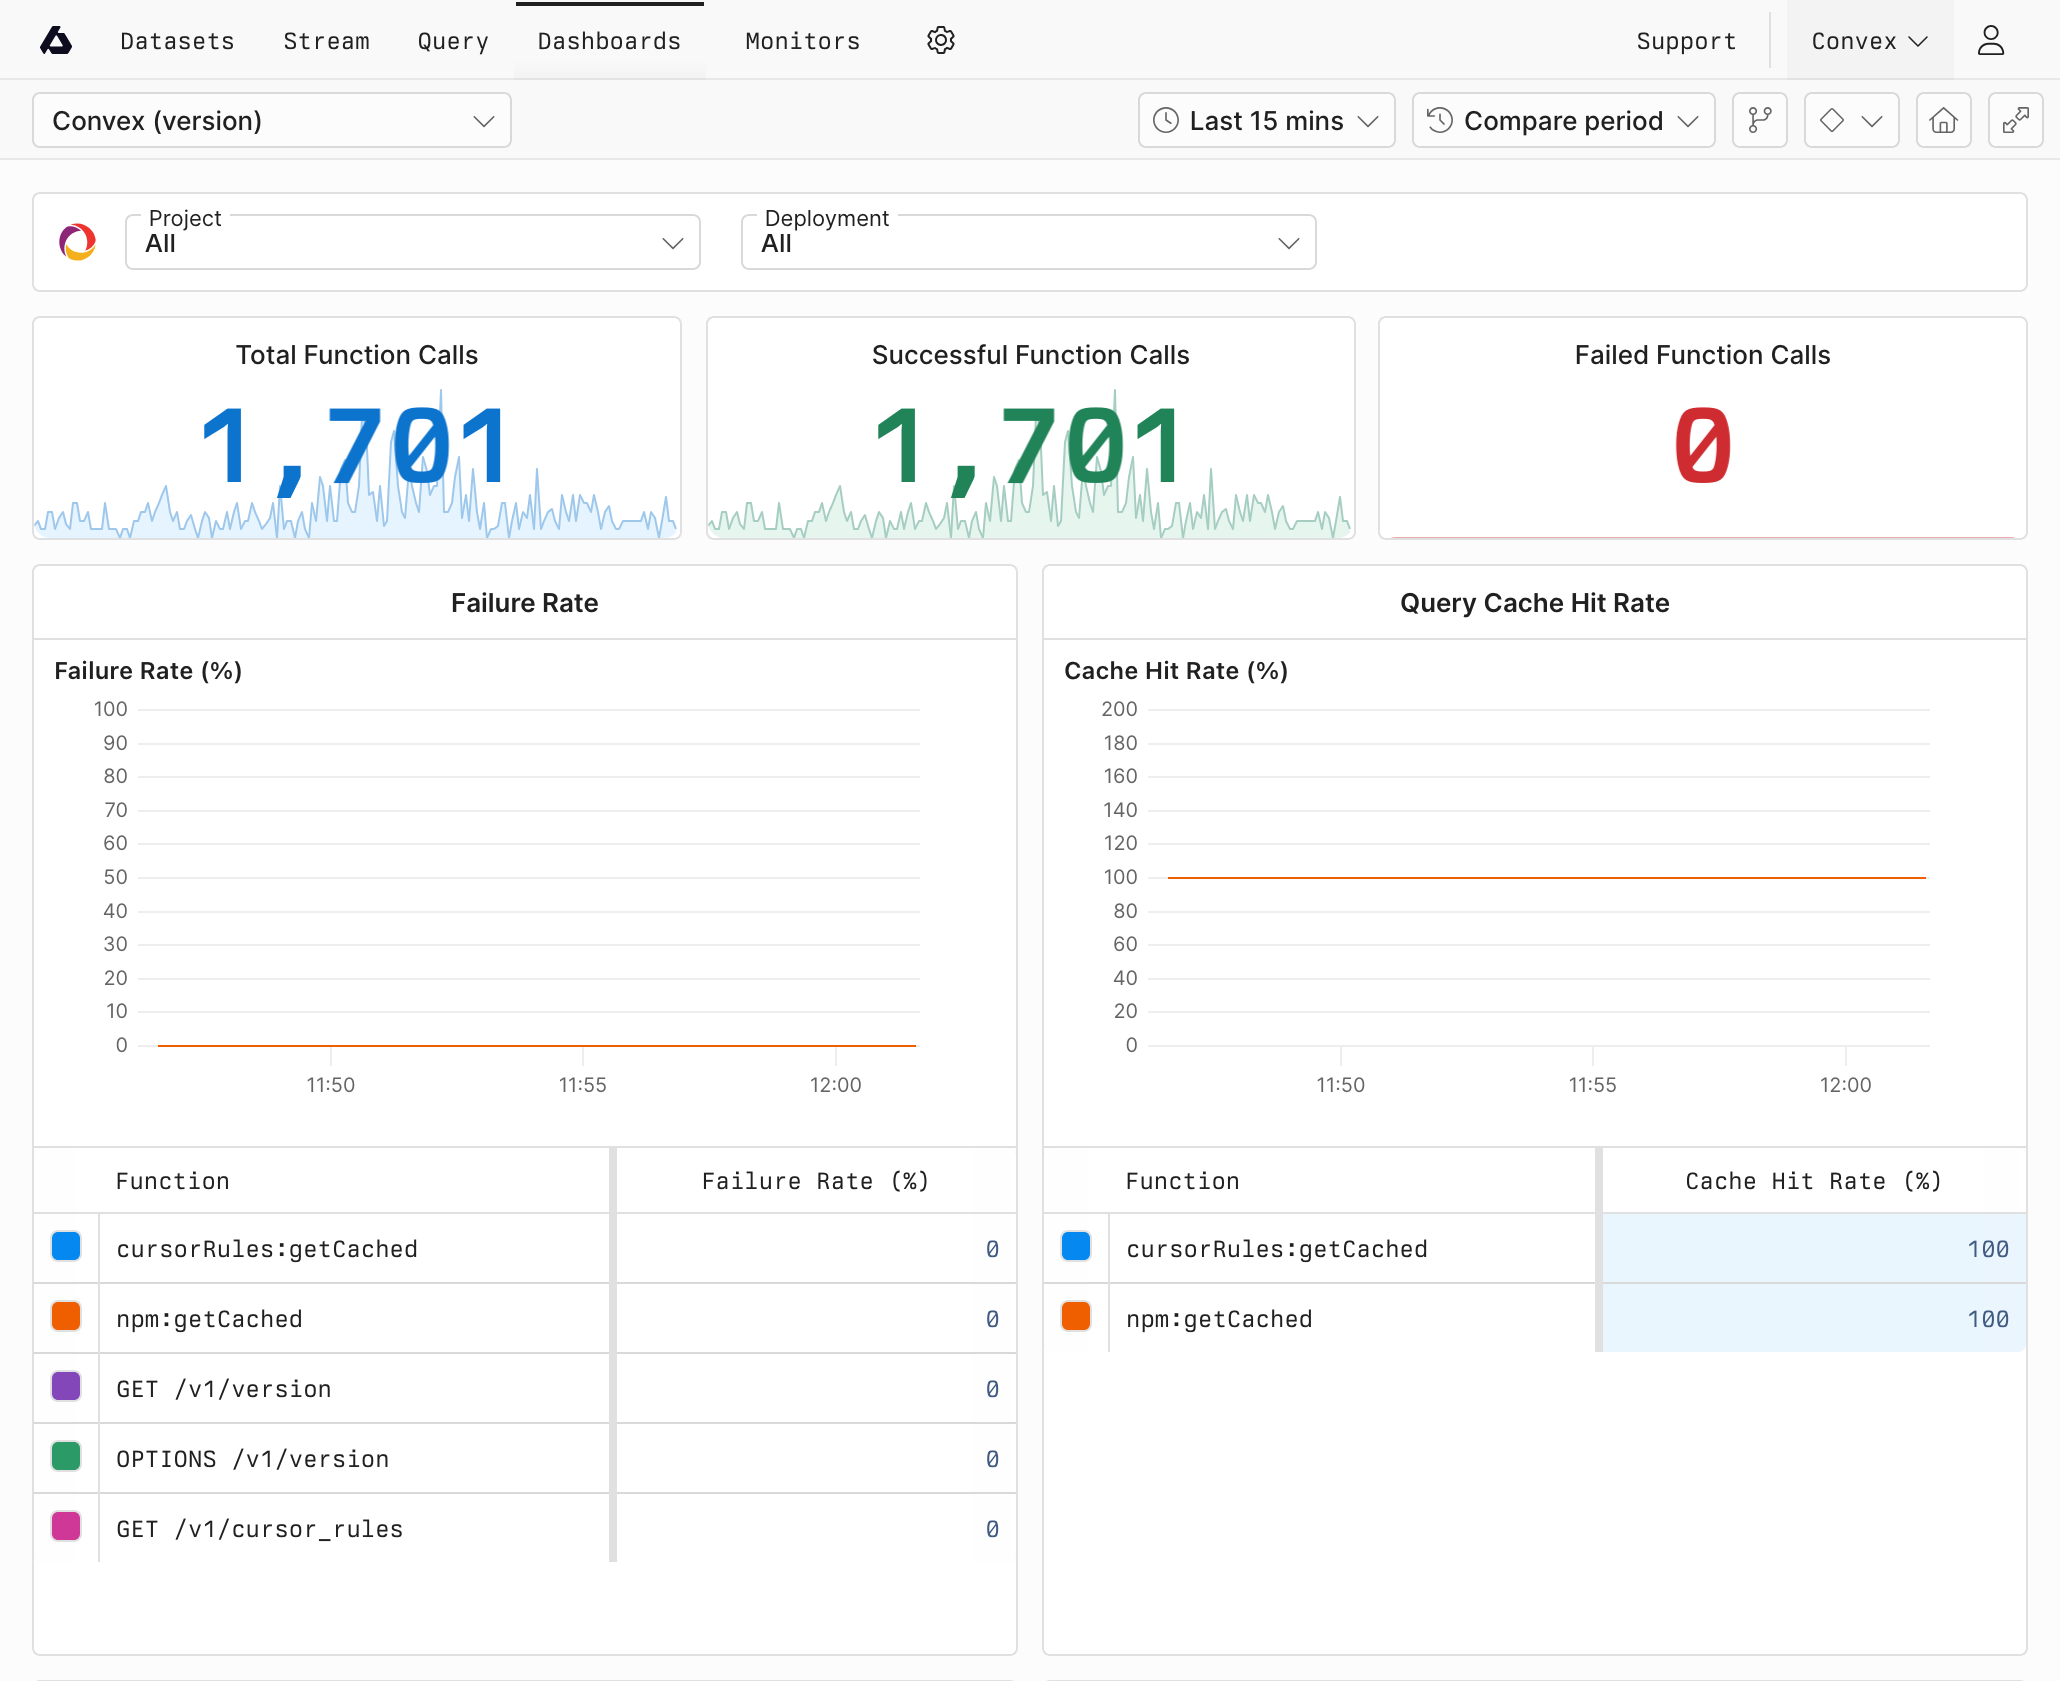
When you configure a Convex dataset in Axiom, a dashboard is automatically created in the **Integrations** section of the Dashboards tab. This prebuilt dashboard provides immediate insights into your Convex function performance and errors.
The dashboard includes:
* **Function execution metrics**: Success rates, error counts, and performance trends.
* **Database operation insights**: Query patterns, mutation frequencies, and subscription activity.
* **Error analysis**: Error types, frequency, and affected functions.
* **Performance monitoring**: Response times, throughput, and resource utilization.
You can customize this dashboard or create additional dashboards tailored to your specific monitoring needs and business requirements. For more information, see [Create dashboards](/dashboards/create) and [Configure dashboards](/dashboards/configure).
## Next steps
* [Explore your Convex data](/query-data/query-editor) in Axiom and [learn APL](/apl/introduction) to query your Convex logs.
* [Create custom dashboards](/dashboards/create) for your team.
* [Set up monitors](/monitor-data/monitors) to get alerted about issues.
This page explains how to connecting with Convex can enhance your Axiom experience. For instructions on streaming data from Convex to Axiom, see [Send data from Convex](/send-data/convex).
## Convex and log streams
[Convex](https://convex.dev) is the backend platform that keeps your app in sync. It’s the open source, reactive database where queries are TypeScript code running right in the database. Just like React components react to state changes, Convex queries react to database changes.
Convex provides a database, a place to write your server functions, and client libraries. It makes it easy to build and scale dynamic live-updating apps.
Log streams enable streaming of events such as function executions and `console.log`s from your Convex deployment to supported destinations like Axiom, Datadog, or custom webhooks.
Log streams require a Convex Professional plan. Learn more about [Convex pricing plans](https://www.convex.dev/pricing) or upgrade your account.
## Benefits of connecting Axiom with Convex
Convex’s built-in features allow you to see the most recent logs produced by your deployment. Additionally, log streaming to Axiom provides comprehensive observability for your backend operations.
* **Historical log storage** beyond the recent logs view.
* **Powerful querying** with Axiom Processing Language (APL).
* **Advanced data visualization** and custom dashboards.
* **Integration with monitoring tools** like PagerDuty, Slack, and more.
* **Real-time alerting** based on function performance and errors.
## Analyze function performance
Convex log streams send structured data to Axiom that includes the following key fields:
* **`['data.topic']`**: Event type
* **`['data.status']`**: Execution status
* **`['data.function.path']`**: Full function path
* **`['data.function.type']`**: Function type
* **`['data.function.component_path']`**: Component path
* **`['data.execution_time_ms']`**: Function execution time in milliseconds
* **`['data.usage.database_read_documents']`**: Number of documents read
* **`['data.usage.database_read_bytes']`**: Bytes of data read
* **`['data.function.cached']`**: Cache hit indicator for queries
* **`['convex.project_slug']`**: Convex project identifier
* **`['convex.deployment_name']`**: Deployment name
* **`['convex.deployment_type']`**: Deployment type
After sending Convex log streams to Axiom, explore your Convex data and analyze your function performance using Axiom’s powerful [query capabilities](/query-data/query-editor).
Identify slow-performing functions by analyzing execution times:
```kusto theme={null}
['convex']
| where ['data.topic'] == "function_execution"
| summarize
avg_time_ms = avg(['data.execution_time_ms']),
max_time_ms = max(['data.execution_time_ms']),
total_calls = count()
by ['data.function.path']
| order by avg_time_ms desc
```
Track functions that are experiencing failures:
```kusto theme={null}
['convex']
| where ['data.topic'] == "function_execution" and ['data.status'] == "failure"
| summarize count() by ['data.function.path'], ['data.function.type']
| order by count_ desc
```
Compare performance across different function types (queries, mutations, actions):
```kusto theme={null}
['convex']
| where ['data.topic'] == "function_execution"
| summarize
total_calls = count(),
avg_duration_ms = avg(['data.execution_time_ms'])
by ['data.function.type']
```
Track database read patterns and identify resource-intensive functions:
```kusto theme={null}
['convex']
| where ['data.topic'] == "function_execution"
| summarize
avg_docs_read = avg(['data.usage.database_read_documents']),
avg_bytes_read = avg(['data.usage.database_read_bytes'])
by ['data.function.path']
| order by avg_bytes_read desc
```
Track query cache hit rates for optimization:
```kusto theme={null}
['convex']
| where ['data.topic'] == "function_execution"
and ['data.function.type'] == "query"
and isnotempty(['data.function.cached'])
| summarize
cache_hits = countif(['data.function.cached'] == true),
total_queries = count()
| extend cache_hit_rate = (cache_hits * 100) / total_queries
```
Track scheduled job lag and performance:
```kusto theme={null}
['convex']
| where ['data.topic'] == "scheduled_job_lag"
| summarize
max_lag_seconds = max(['data.lag_seconds']),
avg_lag_seconds = avg(['data.lag_seconds'])
by ['convex.project_slug'], ['convex.deployment_name']
```
## Set up monitoring and alerting
[Create monitors](/monitor-data/monitors) to get notified about issues in your Convex deployment.
Monitor functions with high error rates:
```kusto theme={null}
['convex']
| where ['data.topic'] == "function_execution"
| summarize
total_calls = count(),
failures = countif(['data.status'] == "failure")
by ['data.function.path']
| extend error_rate = (failures * 100) / total_calls
| where error_rate > 5 // Alert if error rate exceeds 5%
```
Set up alerts for functions exceeding execution time thresholds:
```kusto theme={null}
['convex']
| where ['data.topic'] == "function_execution" and ['data.execution_time_ms'] > 5000
| summarize count() by ['data.function.path']
```
## Prebuilt dashboard
When you configure a Convex dataset in Axiom, a dashboard is automatically created in the **Integrations** section of the Dashboards tab. This prebuilt dashboard provides immediate insights into your Convex function performance and errors.
The dashboard includes:
* **Function execution metrics**: Success rates, error counts, and performance trends.
* **Database operation insights**: Query patterns, mutation frequencies, and subscription activity.
* **Error analysis**: Error types, frequency, and affected functions.
* **Performance monitoring**: Response times, throughput, and resource utilization.
You can customize this dashboard or create additional dashboards tailored to your specific monitoring needs and business requirements. For more information, see [Create dashboards](/dashboards/create) and [Configure dashboards](/dashboards/configure).
## Next steps
* [Explore your Convex data](/query-data/query-editor) in Axiom and [learn APL](/apl/introduction) to query your Convex logs.
* [Create custom dashboards](/dashboards/create) for your team.
* [Set up monitors](/monitor-data/monitors) to get alerted about issues.