> ## Documentation Index
> Fetch the complete documentation index at: https://axiom.co/docs/llms.txt
> Use this file to discover all available pages before exploring further.
# Connect Axiom with Grafana
> Learn how to extend the functionality of Grafana by installing the Axiom data source plugin.
 ## What’s a Grafana data source plugin?
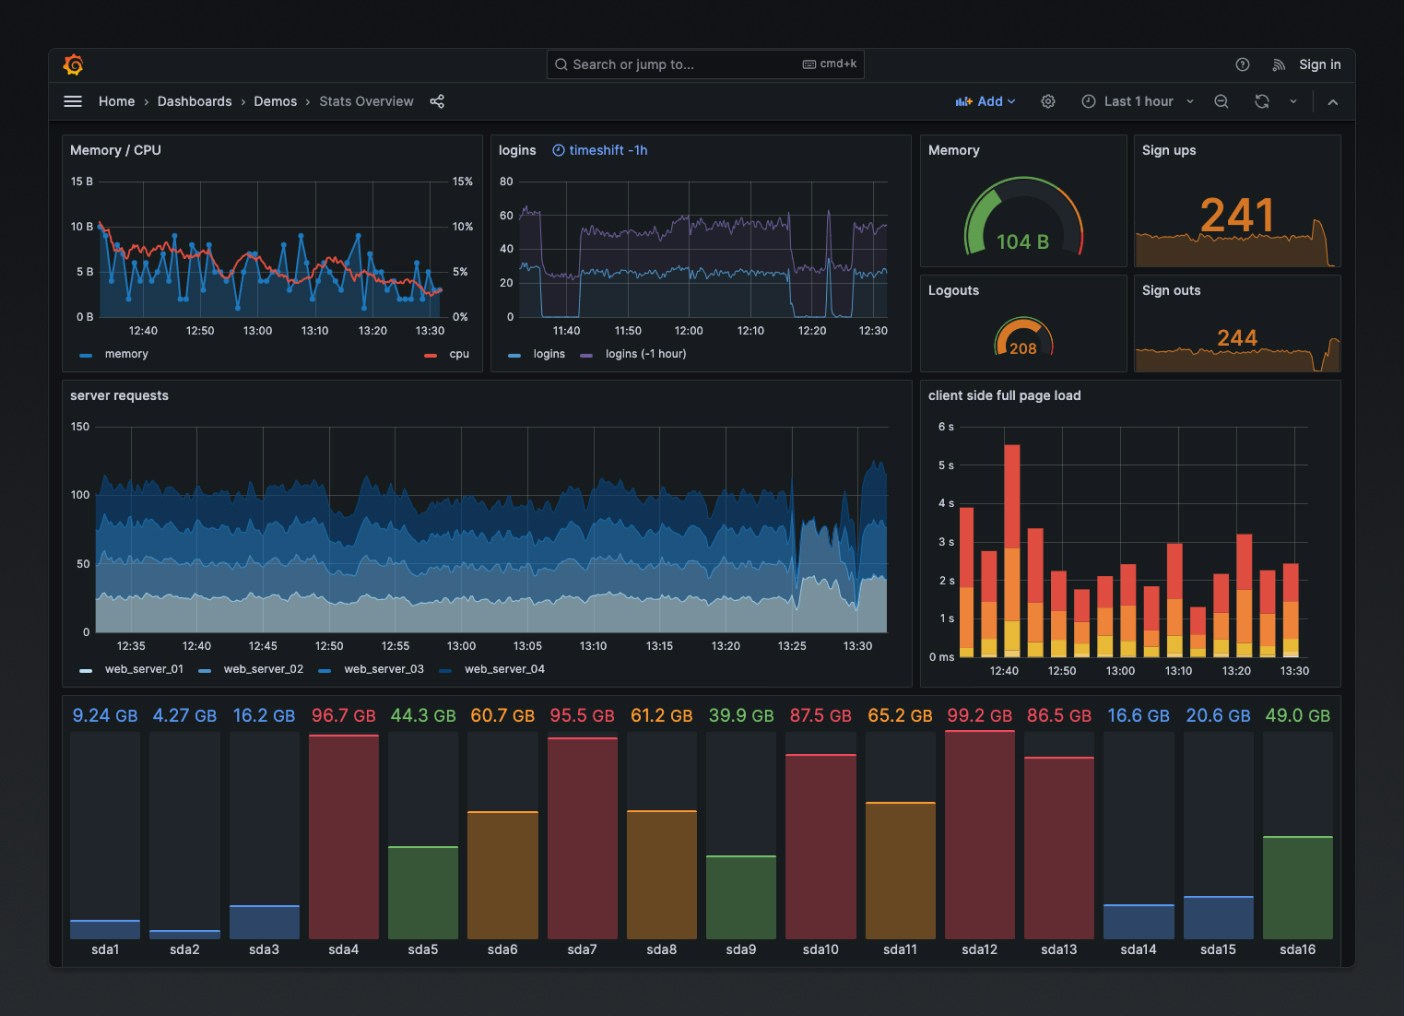
Grafana is an open-source tool for time-series analytics, visualization, and alerting. It’s frequently used in DevOps and IT Operations roles to provide real-time information on system health and performance.
Data sources in Grafana are the actual databases or services where the data is stored. Grafana has a variety of data source plugins that connect Grafana to different types of databases or services. This enables Grafana to query those sources from display that data on its dashboards. The data sources can be anything from traditional SQL databases to time-series databases or metrics, and logs from Axiom.
A Grafana data source plugin extends the functionality of Grafana by allowing it to interact with a specific type of data source. These plugins enable users to extract data from a variety of different sources, not just those that come supported by default in Grafana.
## Prerequisites
* [Create an Axiom account](https://app.axiom.co/register).
* [Create a dataset in Axiom](/reference/datasets#create-dataset) where you send your data.
* [Create an advanced API token in Axiom](/reference/tokens#create-advanced-api-token) with permissions to query data from the dataset you have created. Basic API tokens only allow data ingestion and won't work with Grafana.
## Install the Axiom Grafana data source plugin on Grafana Cloud
* In Grafana, click Administration > Plugins in the side navigation menu to view installed plugins.
* In the filter bar, search for the Axiom plugin
* Click on the plugin logo.
* Click Install.
## What’s a Grafana data source plugin?
Grafana is an open-source tool for time-series analytics, visualization, and alerting. It’s frequently used in DevOps and IT Operations roles to provide real-time information on system health and performance.
Data sources in Grafana are the actual databases or services where the data is stored. Grafana has a variety of data source plugins that connect Grafana to different types of databases or services. This enables Grafana to query those sources from display that data on its dashboards. The data sources can be anything from traditional SQL databases to time-series databases or metrics, and logs from Axiom.
A Grafana data source plugin extends the functionality of Grafana by allowing it to interact with a specific type of data source. These plugins enable users to extract data from a variety of different sources, not just those that come supported by default in Grafana.
## Prerequisites
* [Create an Axiom account](https://app.axiom.co/register).
* [Create a dataset in Axiom](/reference/datasets#create-dataset) where you send your data.
* [Create an advanced API token in Axiom](/reference/tokens#create-advanced-api-token) with permissions to query data from the dataset you have created. Basic API tokens only allow data ingestion and won't work with Grafana.
## Install the Axiom Grafana data source plugin on Grafana Cloud
* In Grafana, click Administration > Plugins in the side navigation menu to view installed plugins.
* In the filter bar, search for the Axiom plugin
* Click on the plugin logo.
* Click Install.
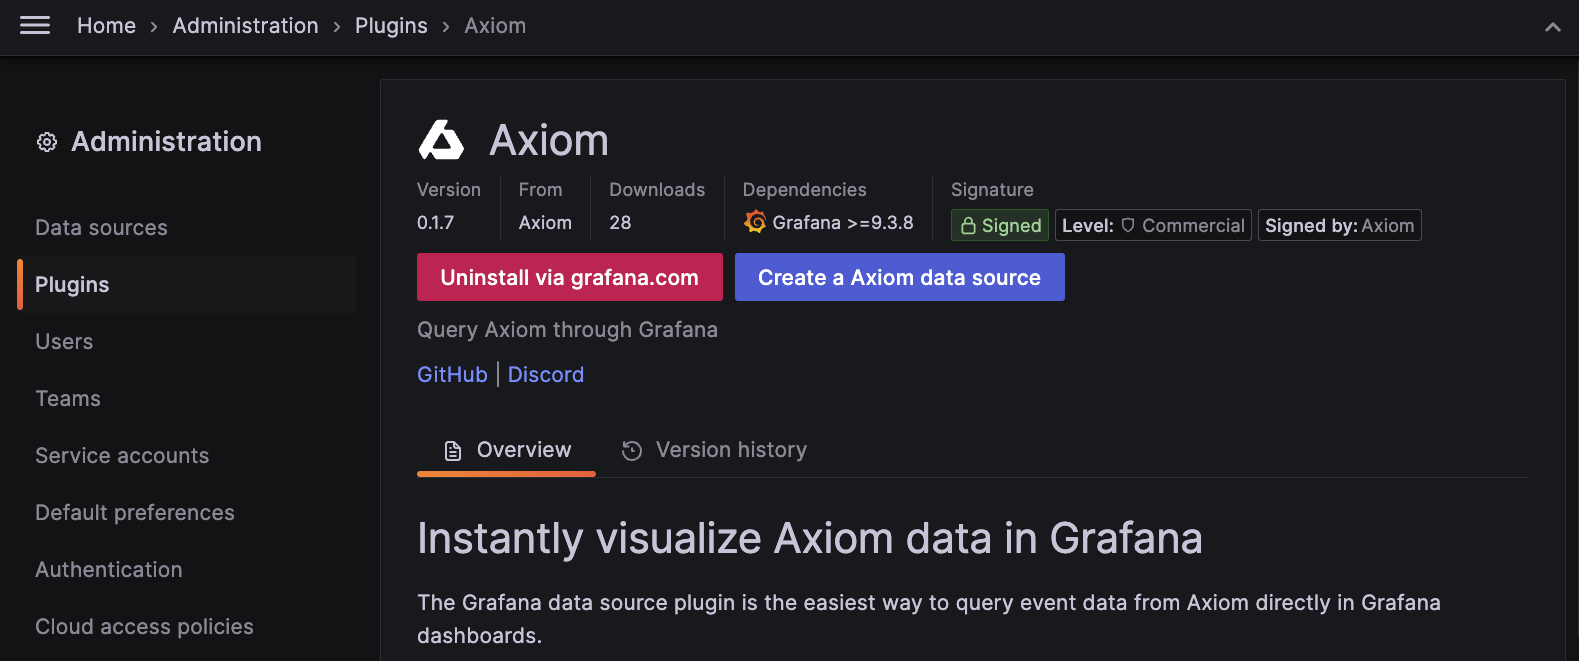 When the update is complete, a confirmation message is displayed, indicating that the installation was successful.
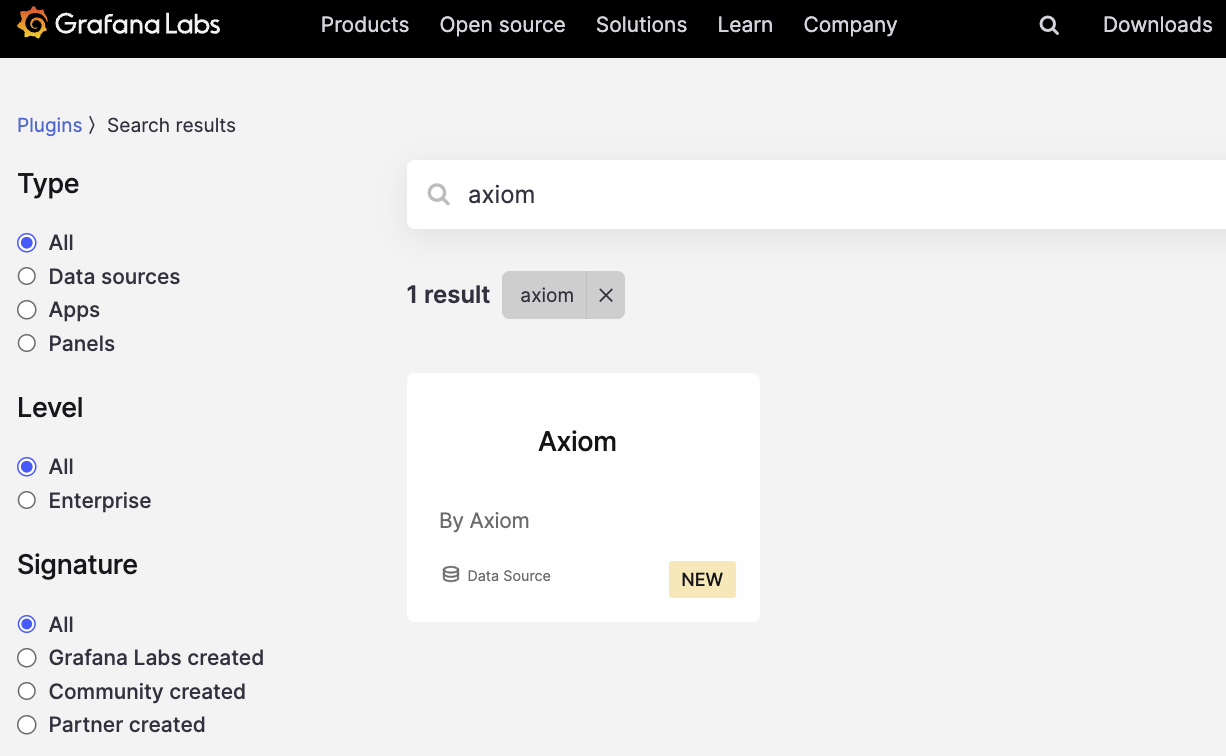
* The Axiom Grafana Plugin is also installable from the [Grafana Plugins page](https://grafana.com/grafana/plugins/axiomhq-axiom-datasource/)
When the update is complete, a confirmation message is displayed, indicating that the installation was successful.
* The Axiom Grafana Plugin is also installable from the [Grafana Plugins page](https://grafana.com/grafana/plugins/axiomhq-axiom-datasource/)
 ## Install the Axiom Grafana data source plugin on local Grafana
The Axiom data source plugin for Grafana is [open source on GitHub](https://github.com/axiomhq/axiom-grafana). It can be installed via the Grafana CLI, or via Docker.
### Install the Axiom Grafana Plugin using Grafana CLI
```bash theme={null}
grafana-cli plugins install axiomhq-axiom-datasource
```
### Install Via Docker
* Add the plugin to your `docker-compose.yml` or `Dockerfile`
* Set the environment variable `GF_INSTALL_PLUGINS` to include the plugin
Example:
`GF_INSTALL_PLUGINS="axiomhq-axiom-datasource"`
## Configuration
* Add a new data source in Grafana
* Select the Axiom data source type.
## Install the Axiom Grafana data source plugin on local Grafana
The Axiom data source plugin for Grafana is [open source on GitHub](https://github.com/axiomhq/axiom-grafana). It can be installed via the Grafana CLI, or via Docker.
### Install the Axiom Grafana Plugin using Grafana CLI
```bash theme={null}
grafana-cli plugins install axiomhq-axiom-datasource
```
### Install Via Docker
* Add the plugin to your `docker-compose.yml` or `Dockerfile`
* Set the environment variable `GF_INSTALL_PLUGINS` to include the plugin
Example:
`GF_INSTALL_PLUGINS="axiomhq-axiom-datasource"`
## Configuration
* Add a new data source in Grafana
* Select the Axiom data source type.
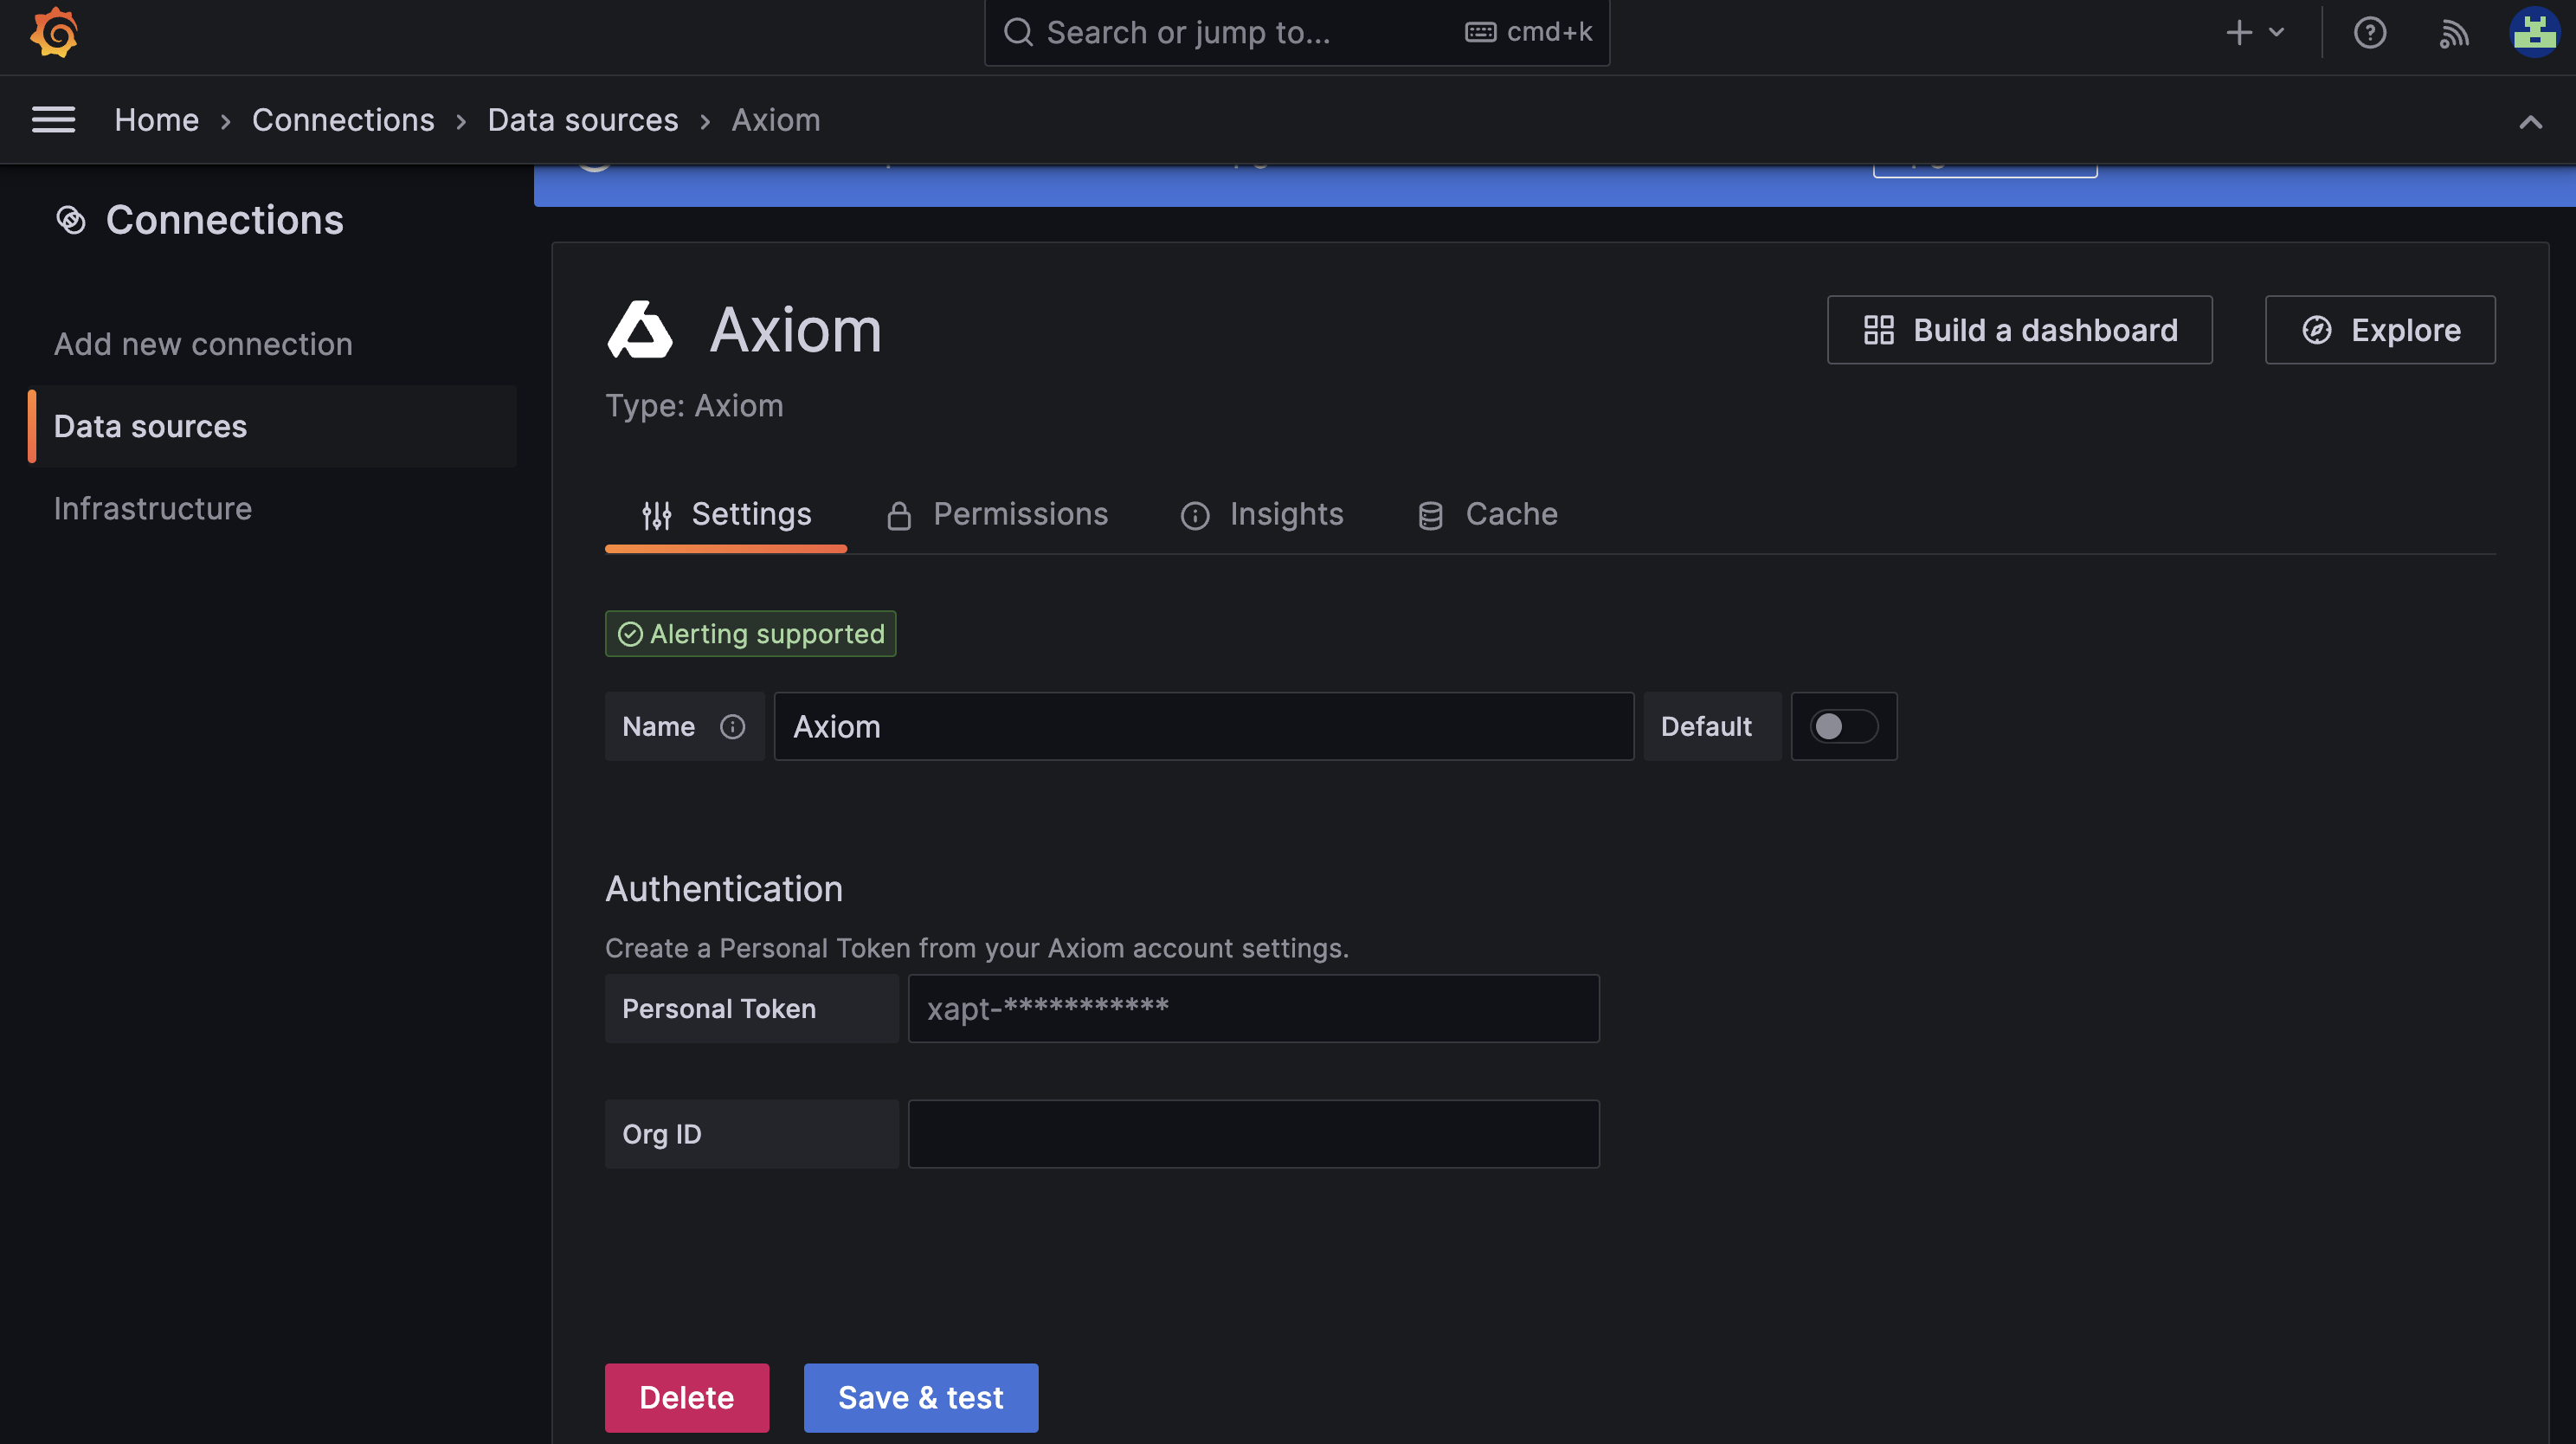 * Enter the previously generated API token.
* Save and test the data source.
## Build Queries with Query Editor
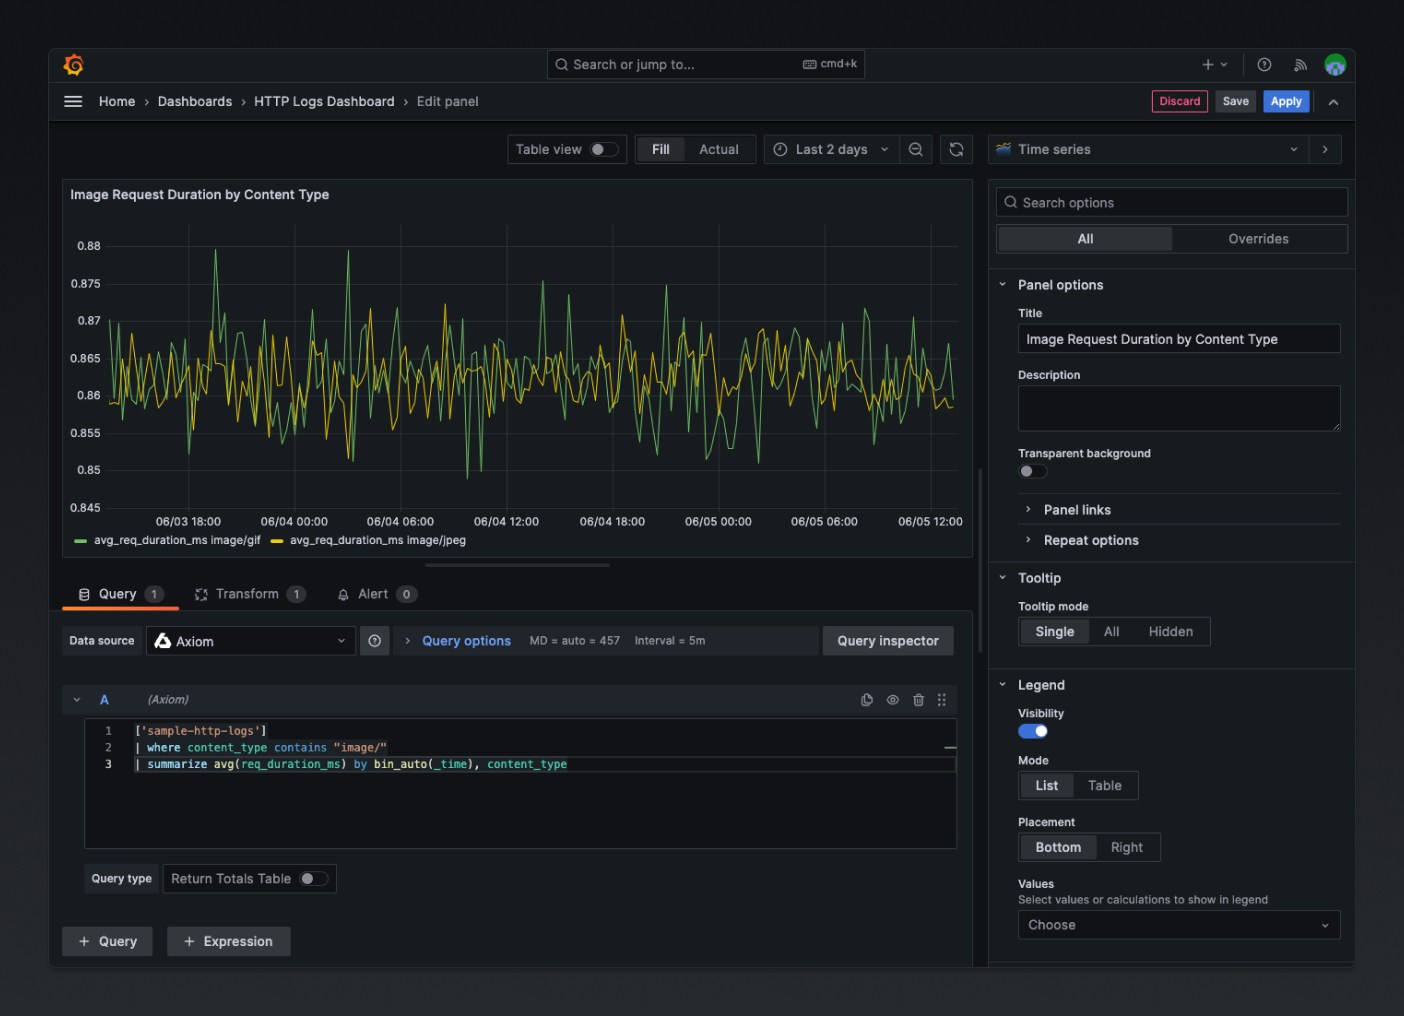
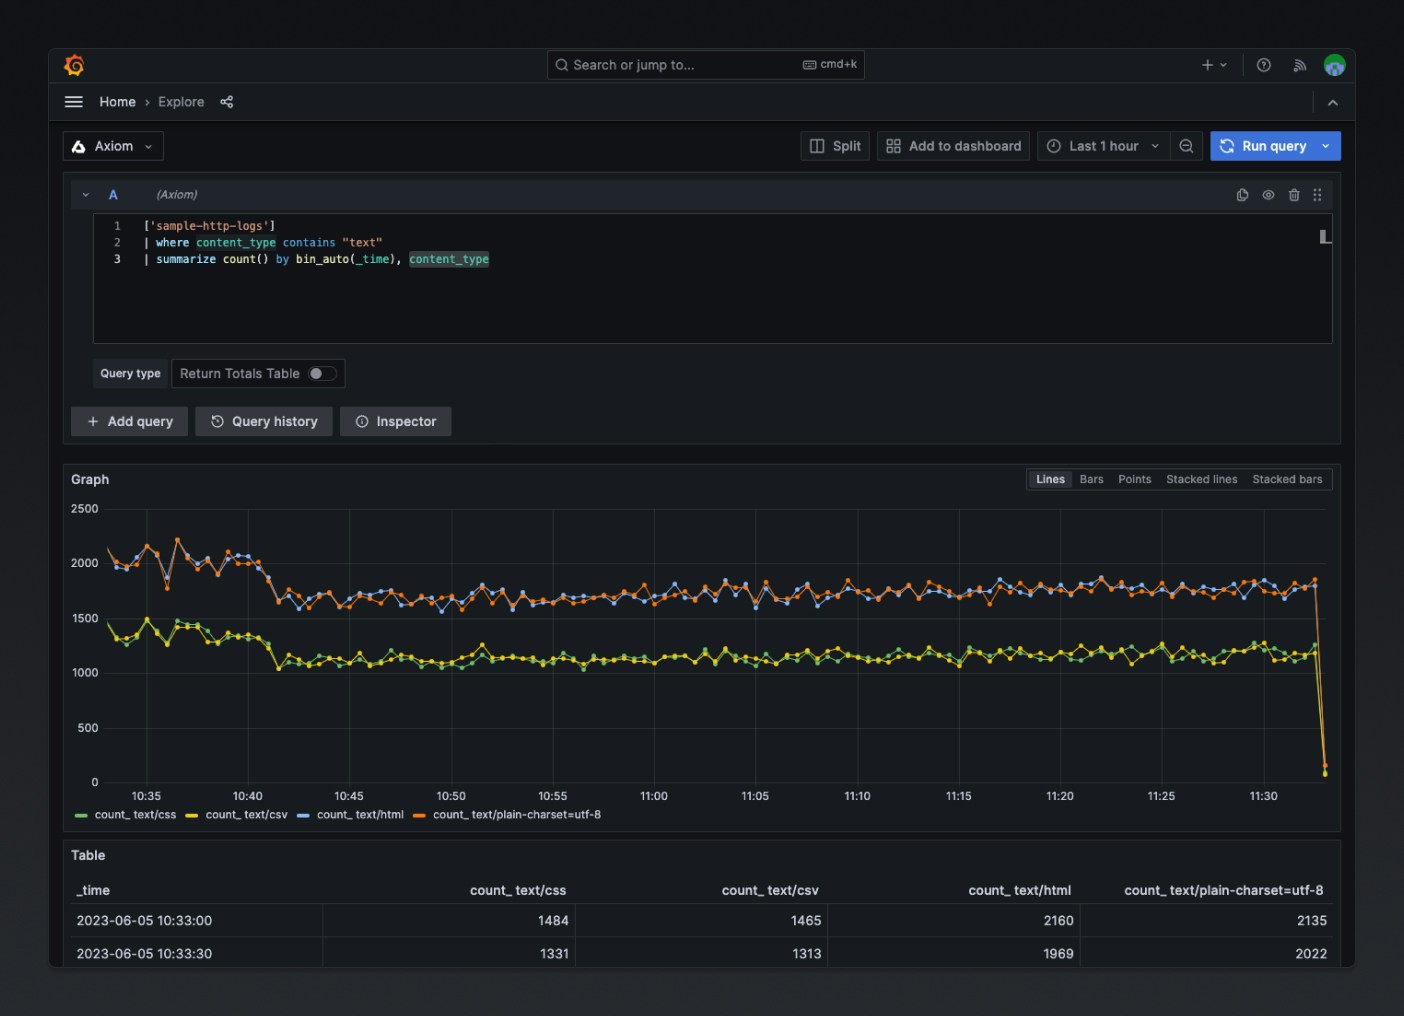
The Axiom data source Plugin provides a custom query editor to build and visualize your Axiom event data. After configuring the Axiom data source, start building visualizations from metrics and logs stored in Axiom.
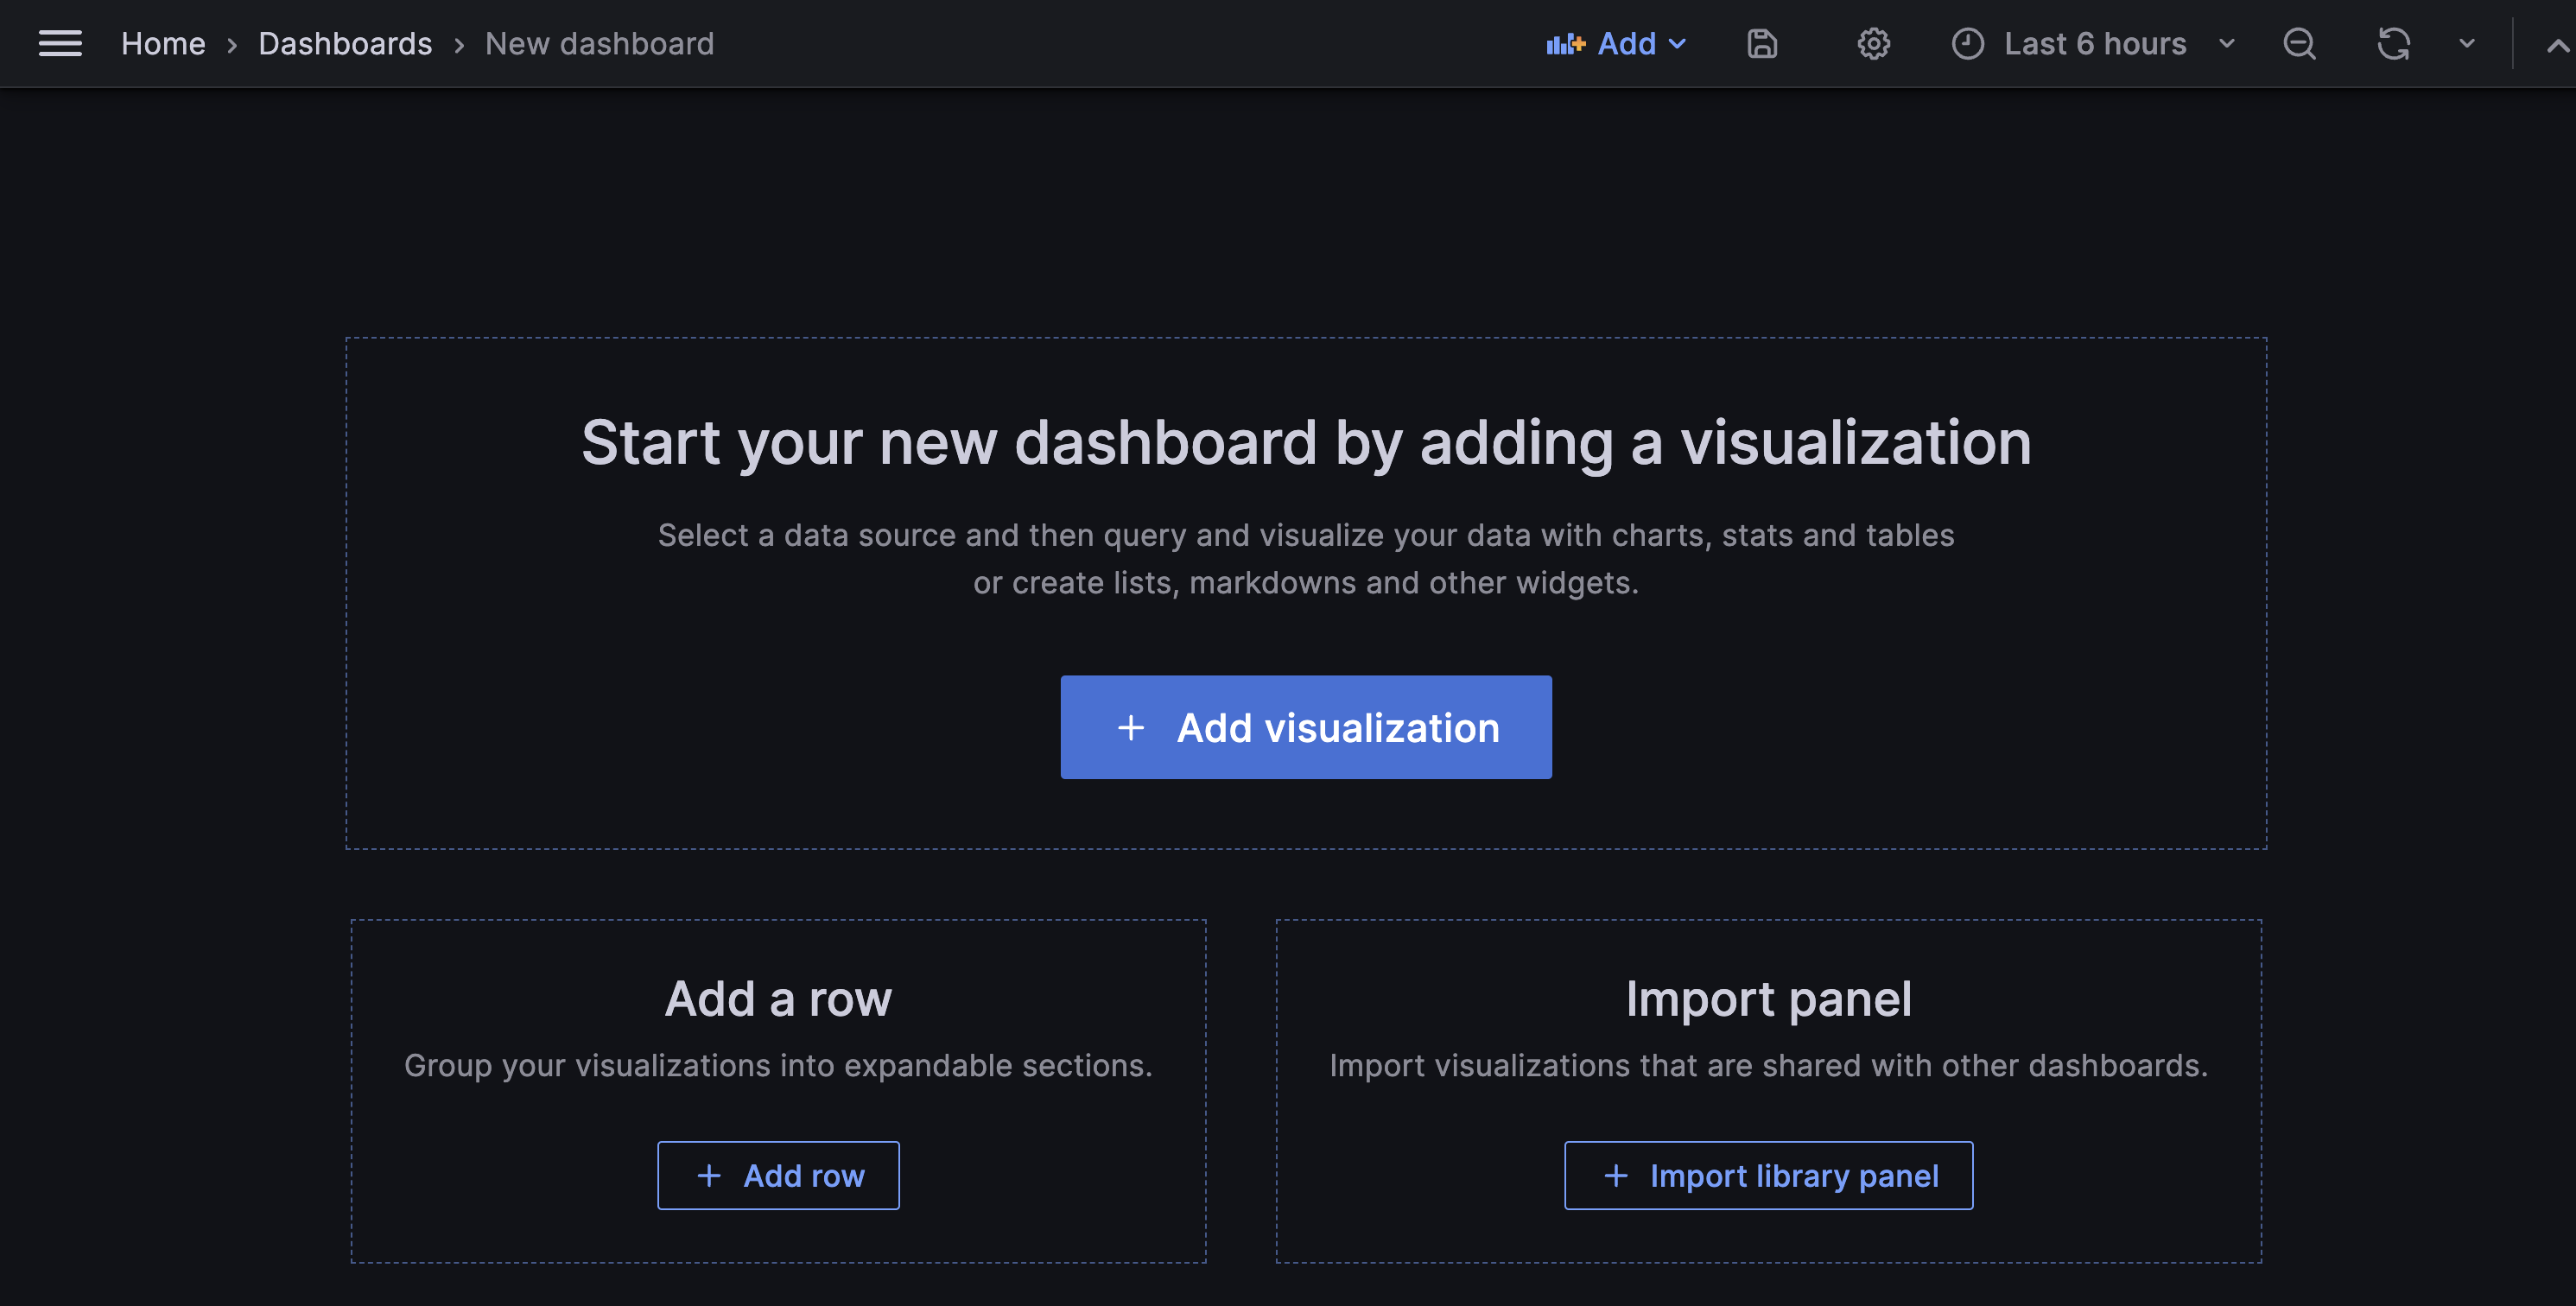
* Create a new panel in Grafana by clicking on Add visualization
* Enter the previously generated API token.
* Save and test the data source.
## Build Queries with Query Editor
The Axiom data source Plugin provides a custom query editor to build and visualize your Axiom event data. After configuring the Axiom data source, start building visualizations from metrics and logs stored in Axiom.
* Create a new panel in Grafana by clicking on Add visualization
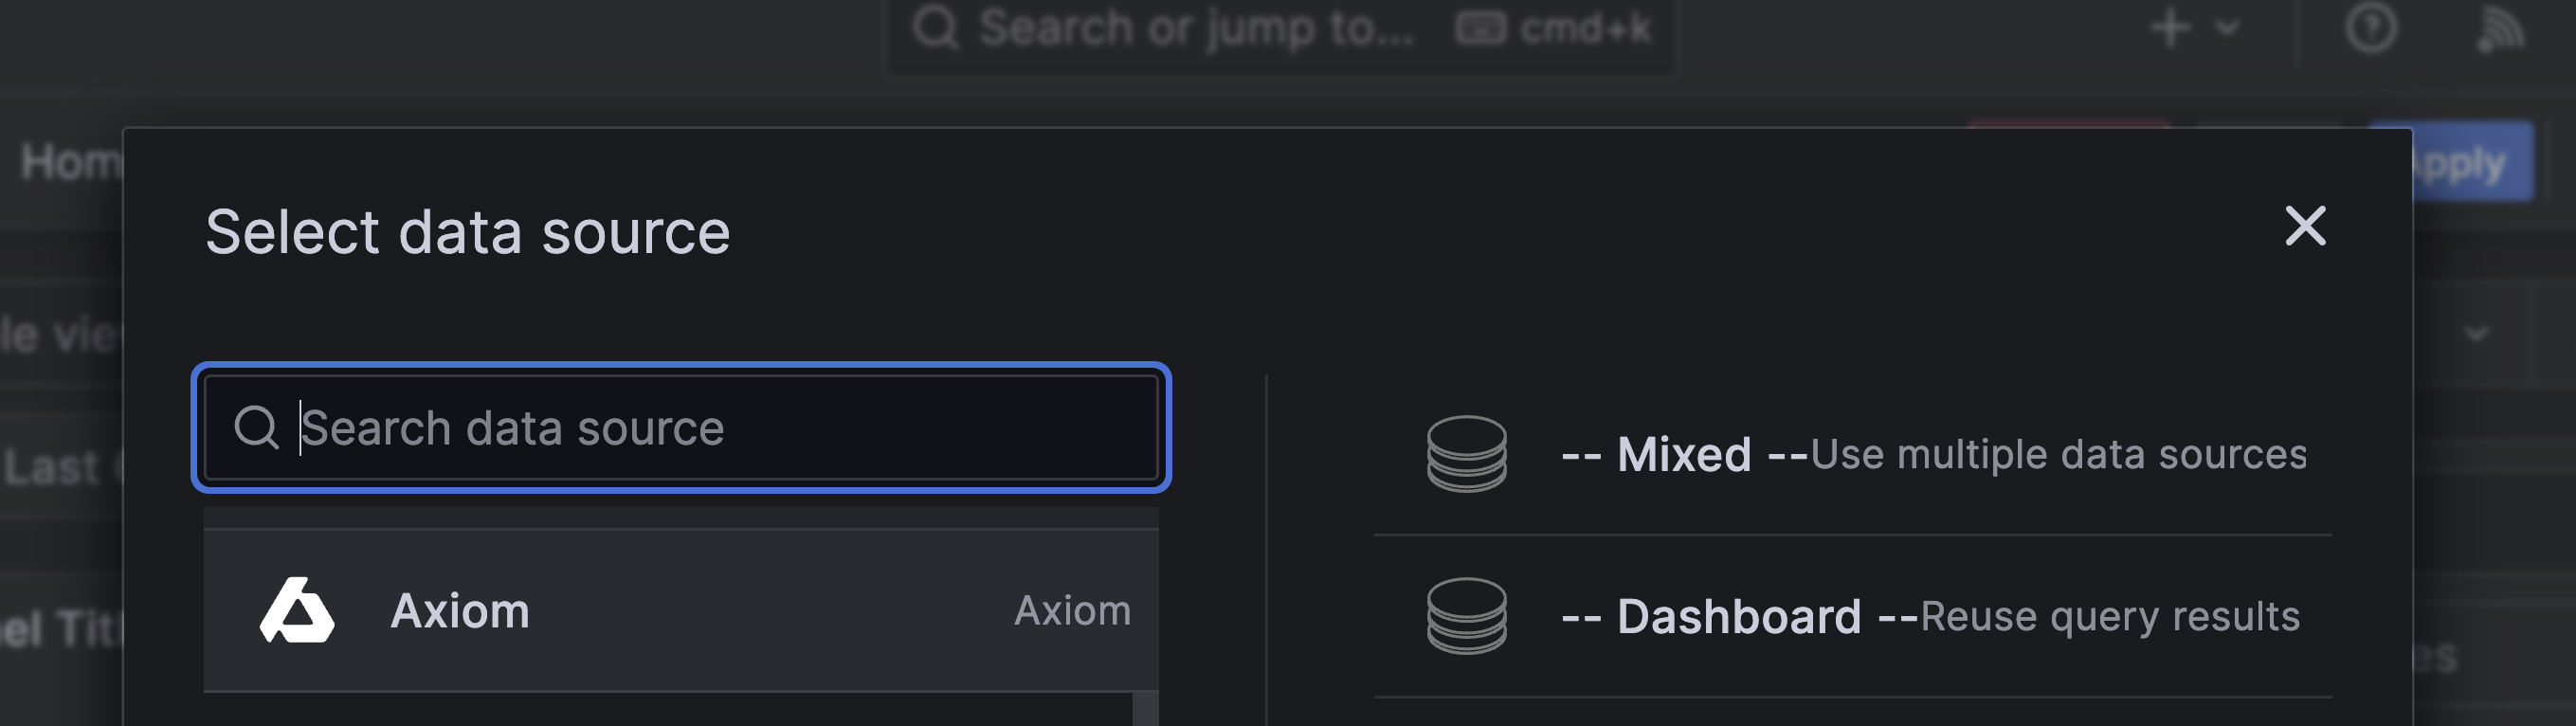
 * Select the Axiom data source.
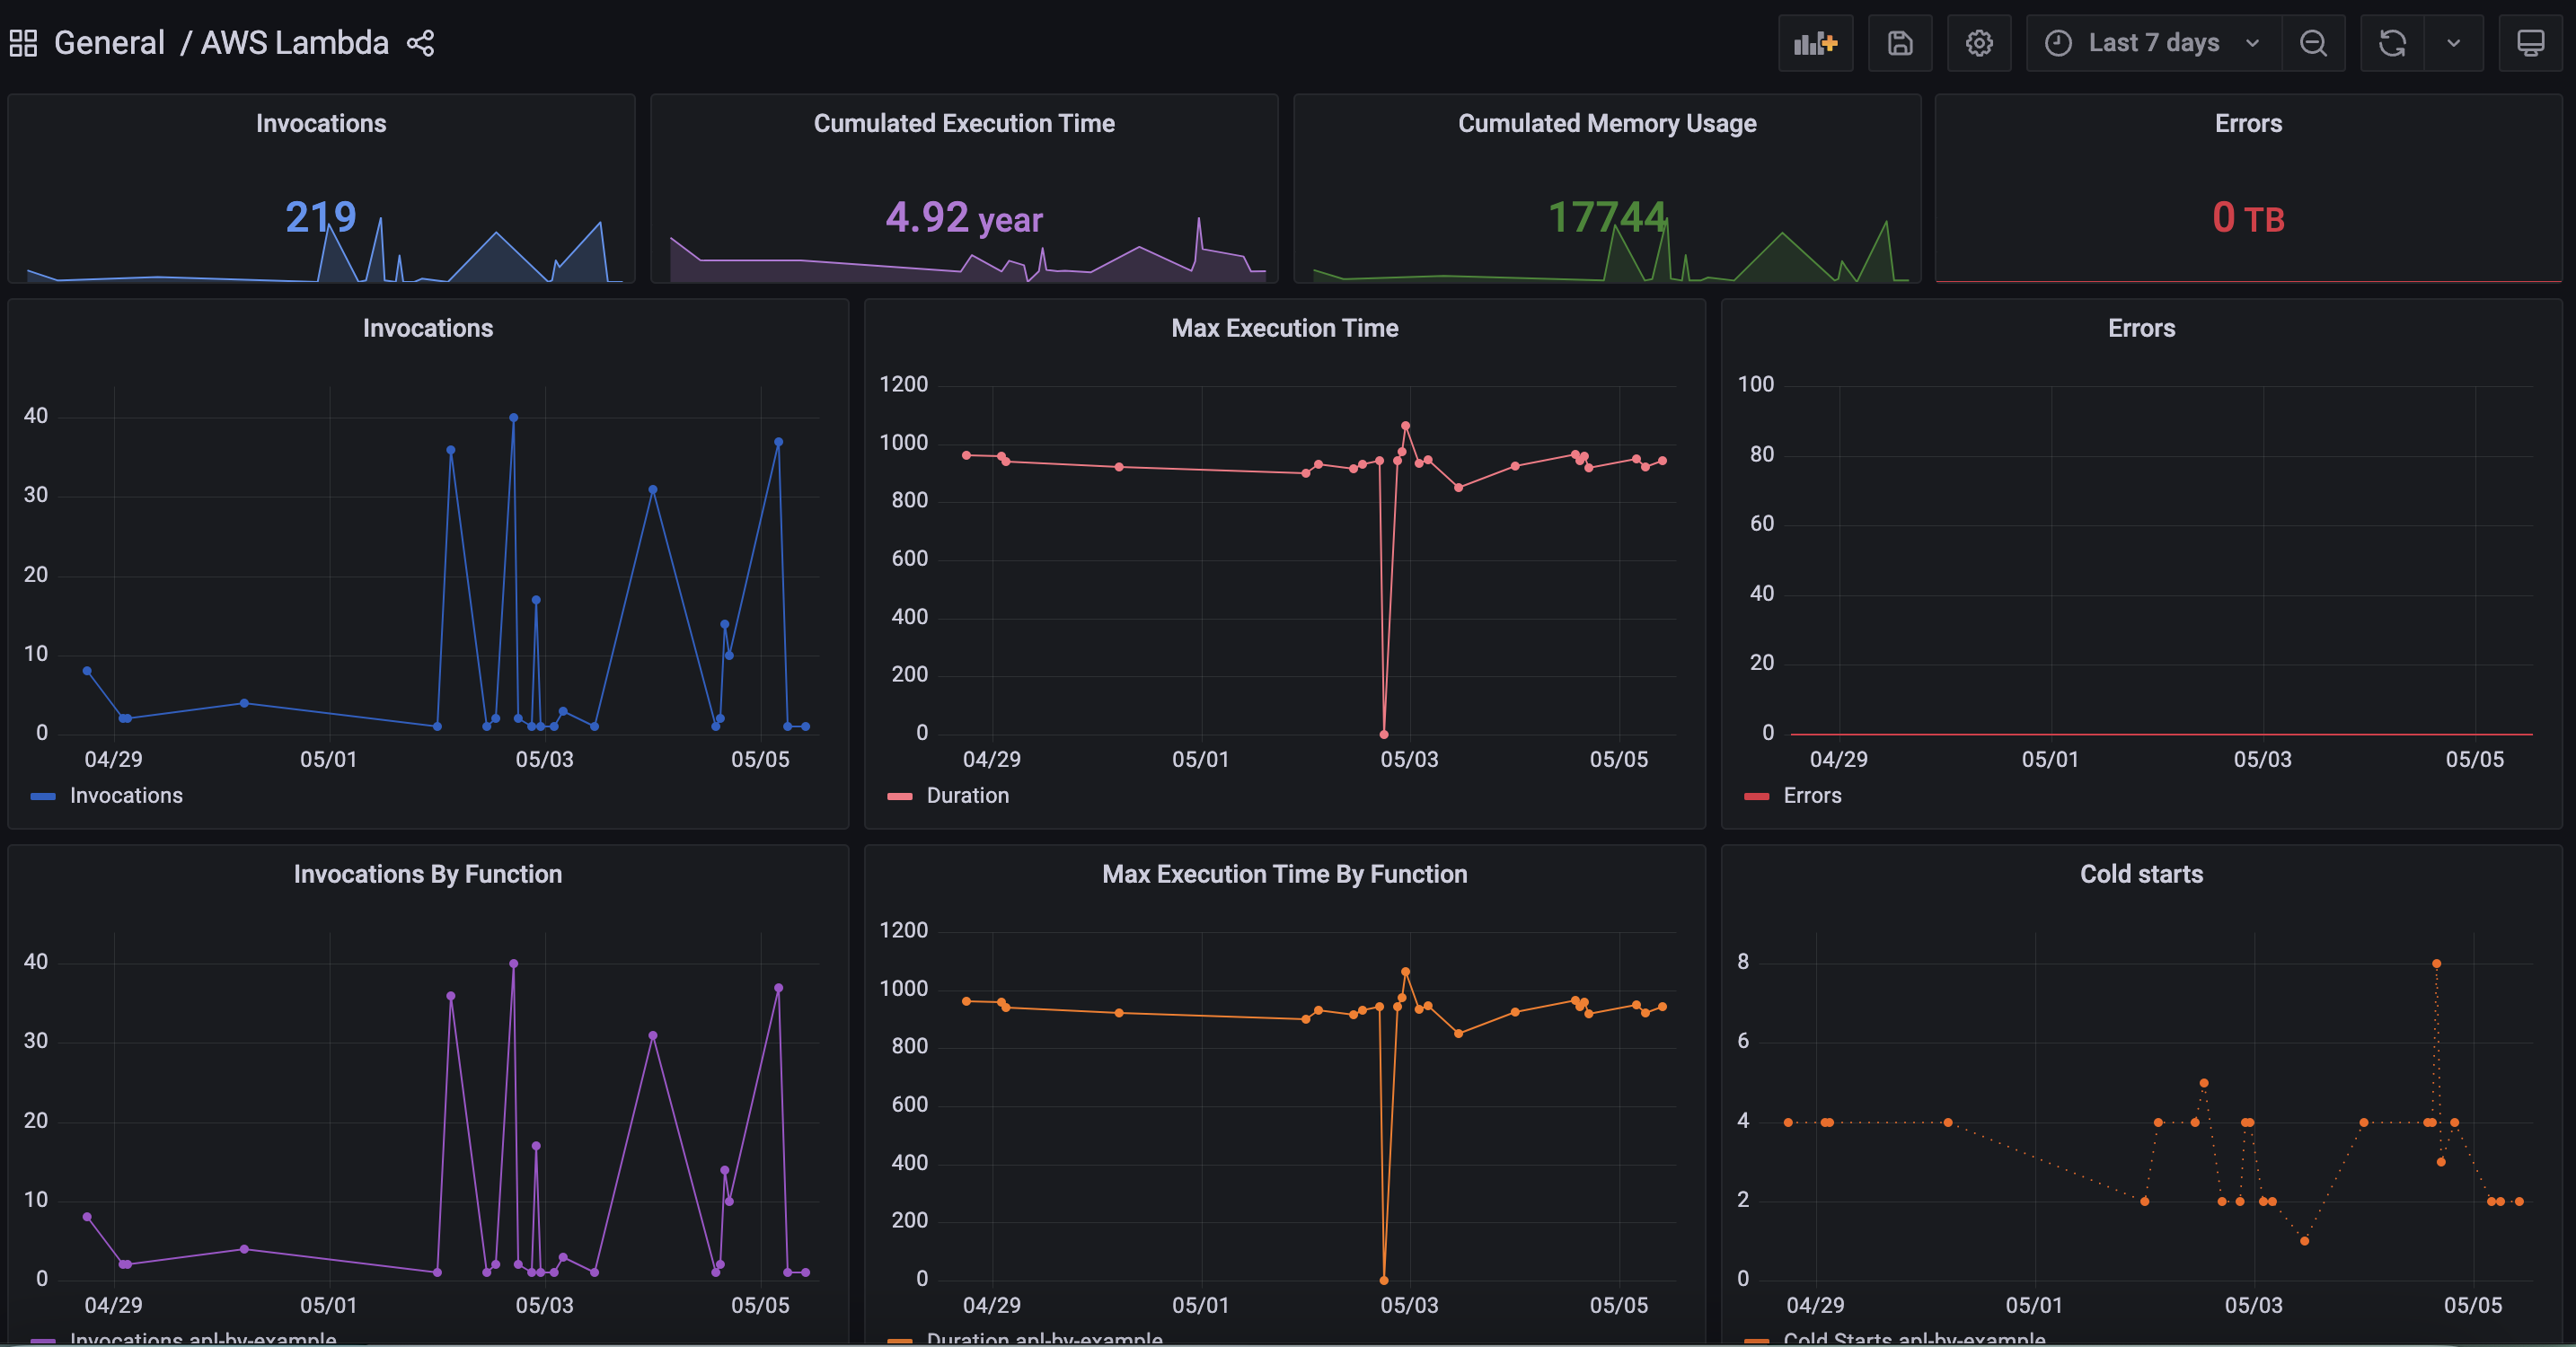
 * Use the query editor to choose the desired metrics, dimensions, and filters.
 ## Benefits of the Axiom Grafana data source plugin
The Axiom Grafana data source plugin allows users to display and interact with their Axiom data directly from within Grafana. By doing so, it provides several advantages:
1. **Unified visualization:** The Axiom Grafana data source plugin allows users to utilize Grafana’s powerful visualization tools with Axiom’s data. This enables users to create, explore, and share dashboards which visually represent their Axiom logs and metrics.
2. **Rich Querying Capability:** Grafana has a powerful and flexible interface for building data queries. With the Axiom plugin, and leverage this capability to build complex queries against your Axiom data.
## Benefits of the Axiom Grafana data source plugin
The Axiom Grafana data source plugin allows users to display and interact with their Axiom data directly from within Grafana. By doing so, it provides several advantages:
1. **Unified visualization:** The Axiom Grafana data source plugin allows users to utilize Grafana’s powerful visualization tools with Axiom’s data. This enables users to create, explore, and share dashboards which visually represent their Axiom logs and metrics.
2. **Rich Querying Capability:** Grafana has a powerful and flexible interface for building data queries. With the Axiom plugin, and leverage this capability to build complex queries against your Axiom data.
 3. **Customizable Alerting:** Grafana’s alerting feature allows you to set alerts based on your queries' results, and set up custom alerts based on specific conditions in your Axiom log data.
4. **Sharing and Collaboration:** Grafana’s features for sharing and collaboration can help teams work together more effectively. Share Axiom data visualizations with others, collaborate on dashboards, and discuss insights directly in Grafana.
3. **Customizable Alerting:** Grafana’s alerting feature allows you to set alerts based on your queries' results, and set up custom alerts based on specific conditions in your Axiom log data.
4. **Sharing and Collaboration:** Grafana’s features for sharing and collaboration can help teams work together more effectively. Share Axiom data visualizations with others, collaborate on dashboards, and discuss insights directly in Grafana.