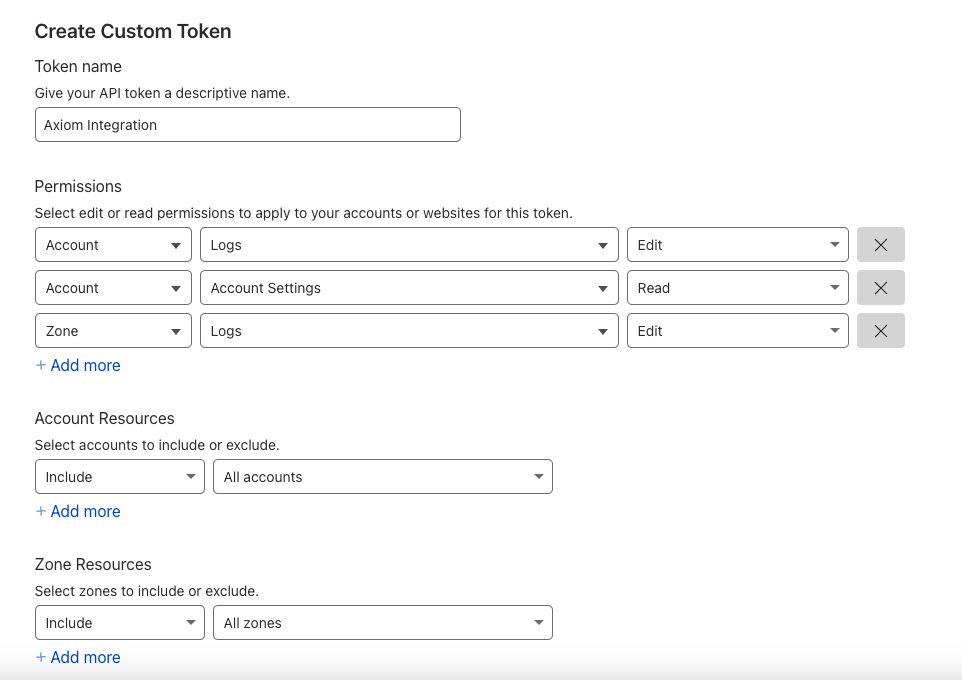
 You can create a token that has access to a single zone, single account or a mix of all these, depending on your needs. For account access, the token must
have these permissions:
* Logs: Edit
* Account settings: Read
For the zones, only edit permission is required for logs.
You can create a token that has access to a single zone, single account or a mix of all these, depending on your needs. For account access, the token must
have these permissions:
* Logs: Edit
* Account settings: Read
For the zones, only edit permission is required for logs.
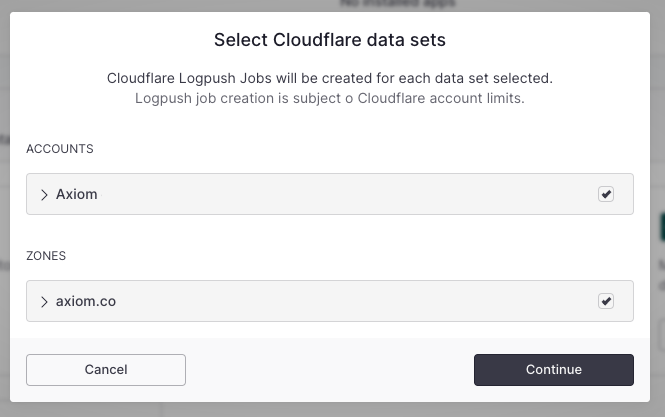
 * You see your available accounts and zones. Select the Cloudflare datasets you want to subscribe to.
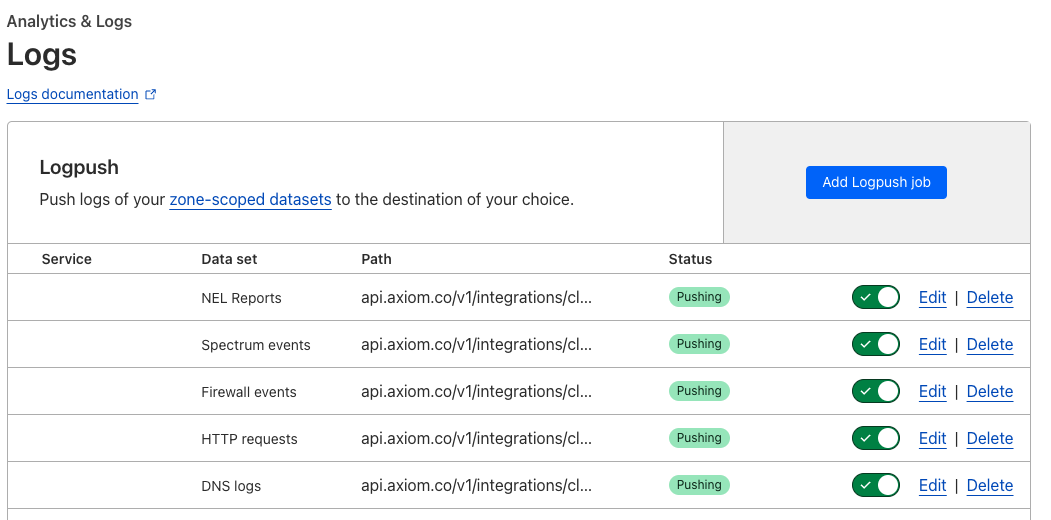
 * The installation uses the Cloudflare API to create Logpush jobs for each selected dataset.
* After the installation completes, you can find the installed Logpush jobs at Cloudflare.
For zone-scoped Logpush jobs:
* The installation uses the Cloudflare API to create Logpush jobs for each selected dataset.
* After the installation completes, you can find the installed Logpush jobs at Cloudflare.
For zone-scoped Logpush jobs:
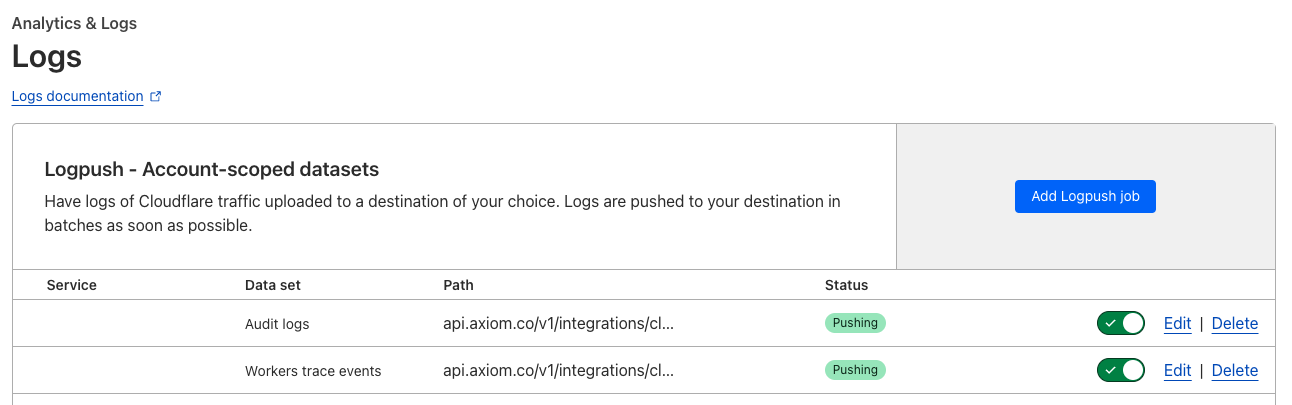
 For account-scoped Logpush jobs:
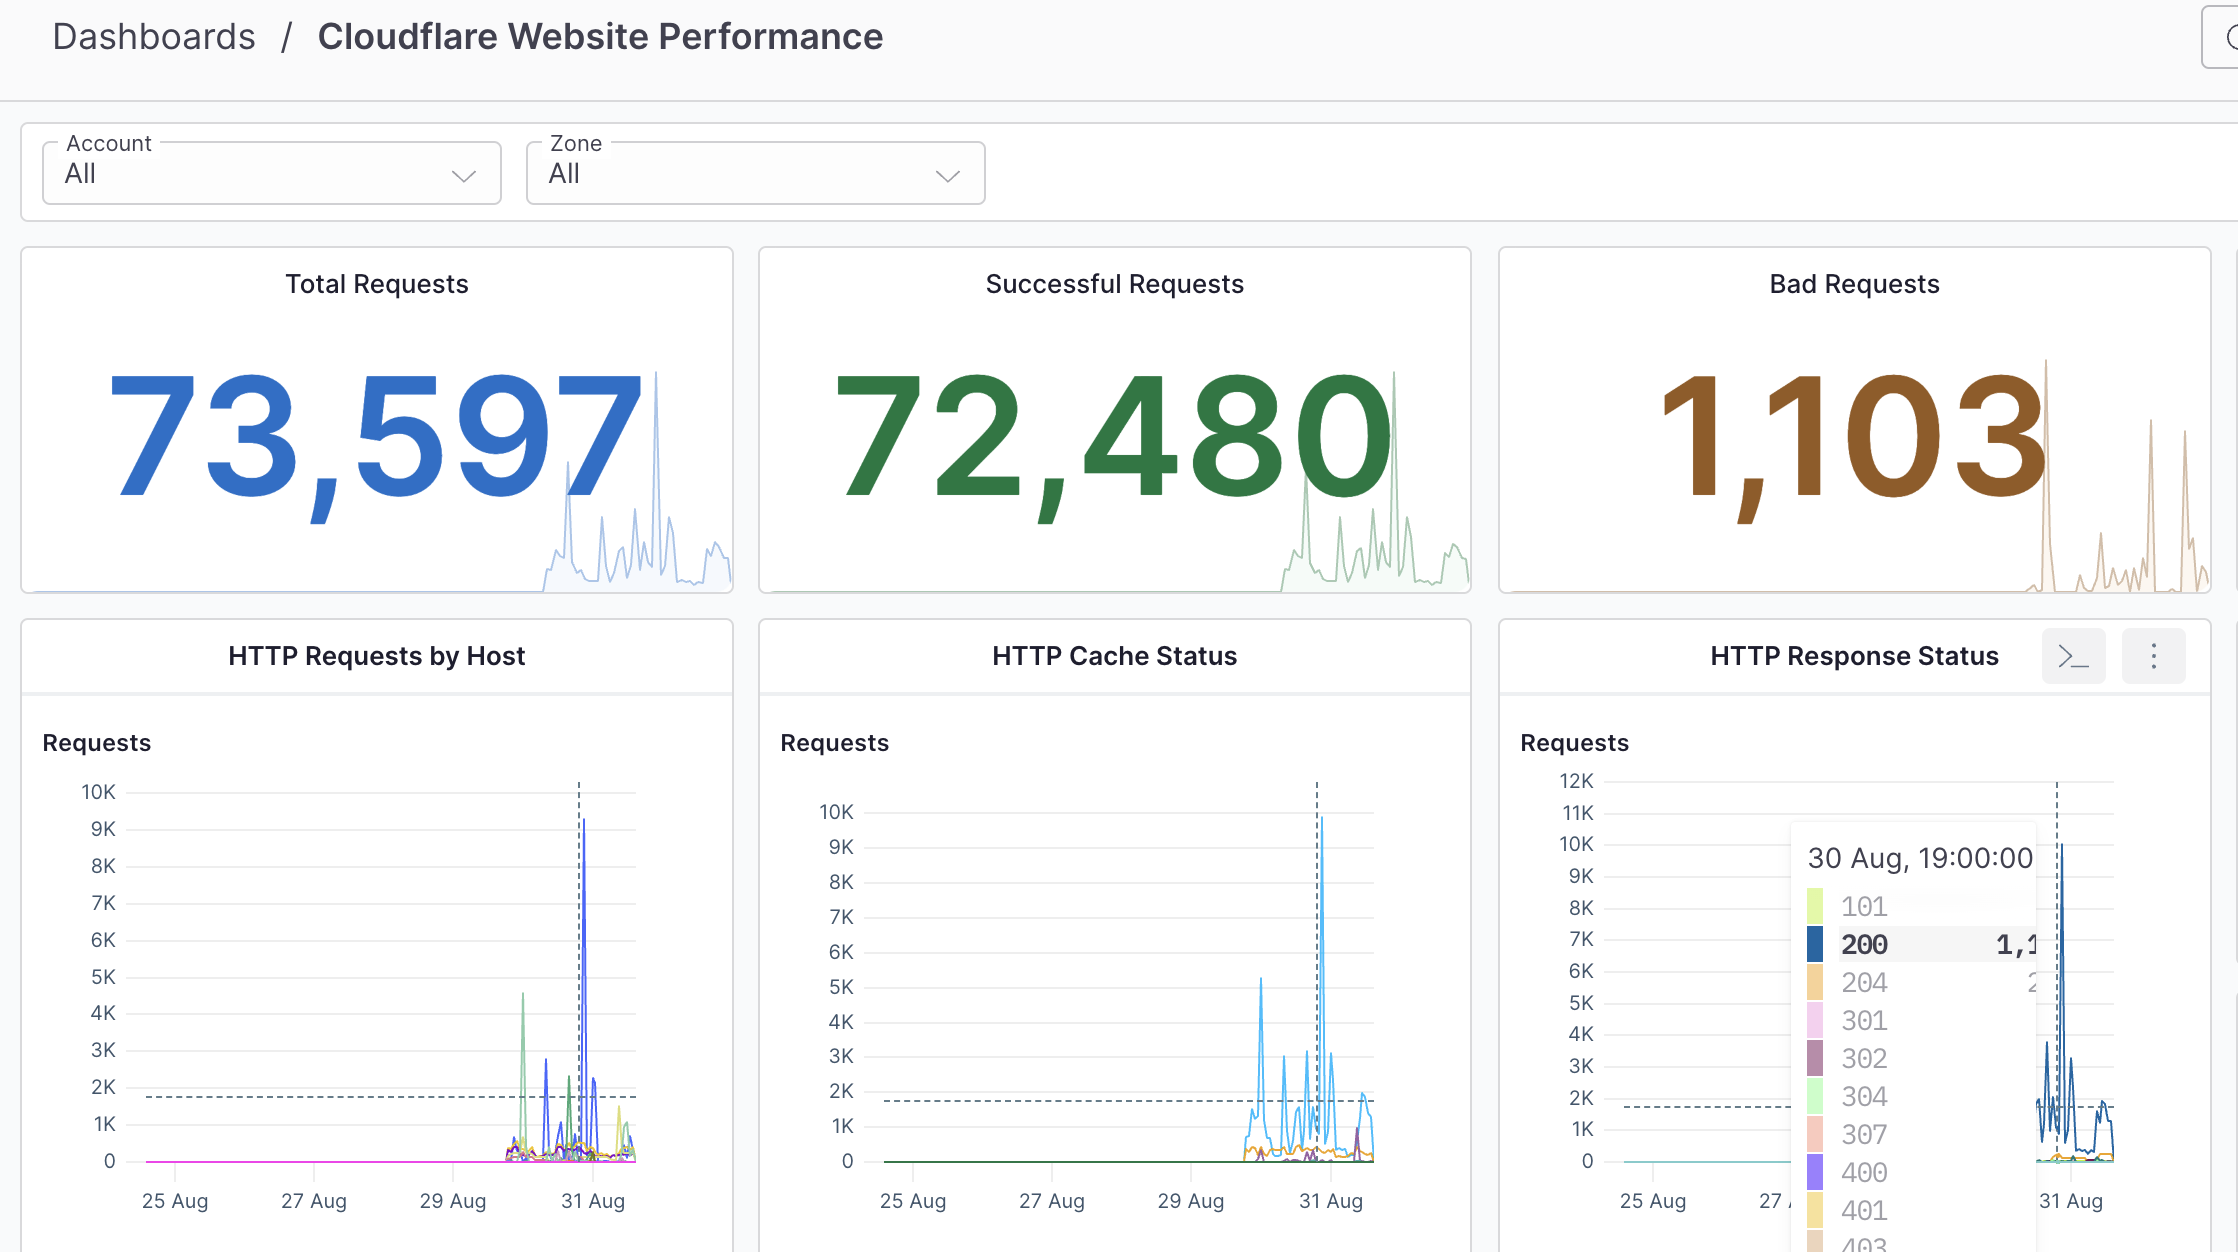
 * In the Axiom, you can see your Cloudflare Logpush dashboard.
Using Axiom with Cloudflare Logpush offers a powerful solution for real-time monitoring, observability, and analytics. Axiom can help you gain deep insights into your app’s performance, errors, and app bottlenecks.
### Benefits of using the Axiom Cloudflare Logpush Dashboard [#benefits-of-using-the-axiom-cloudflare-logpush-dashboard]
* Real-time visibility into web performance: One of the most crucial features is the ability to see how your website or app is performing in real-time. The dashboard can show everything from page load times to error rates, giving you immediate insights that can help in timely decision-making.
* In the Axiom, you can see your Cloudflare Logpush dashboard.
Using Axiom with Cloudflare Logpush offers a powerful solution for real-time monitoring, observability, and analytics. Axiom can help you gain deep insights into your app’s performance, errors, and app bottlenecks.
### Benefits of using the Axiom Cloudflare Logpush Dashboard [#benefits-of-using-the-axiom-cloudflare-logpush-dashboard]
* Real-time visibility into web performance: One of the most crucial features is the ability to see how your website or app is performing in real-time. The dashboard can show everything from page load times to error rates, giving you immediate insights that can help in timely decision-making.
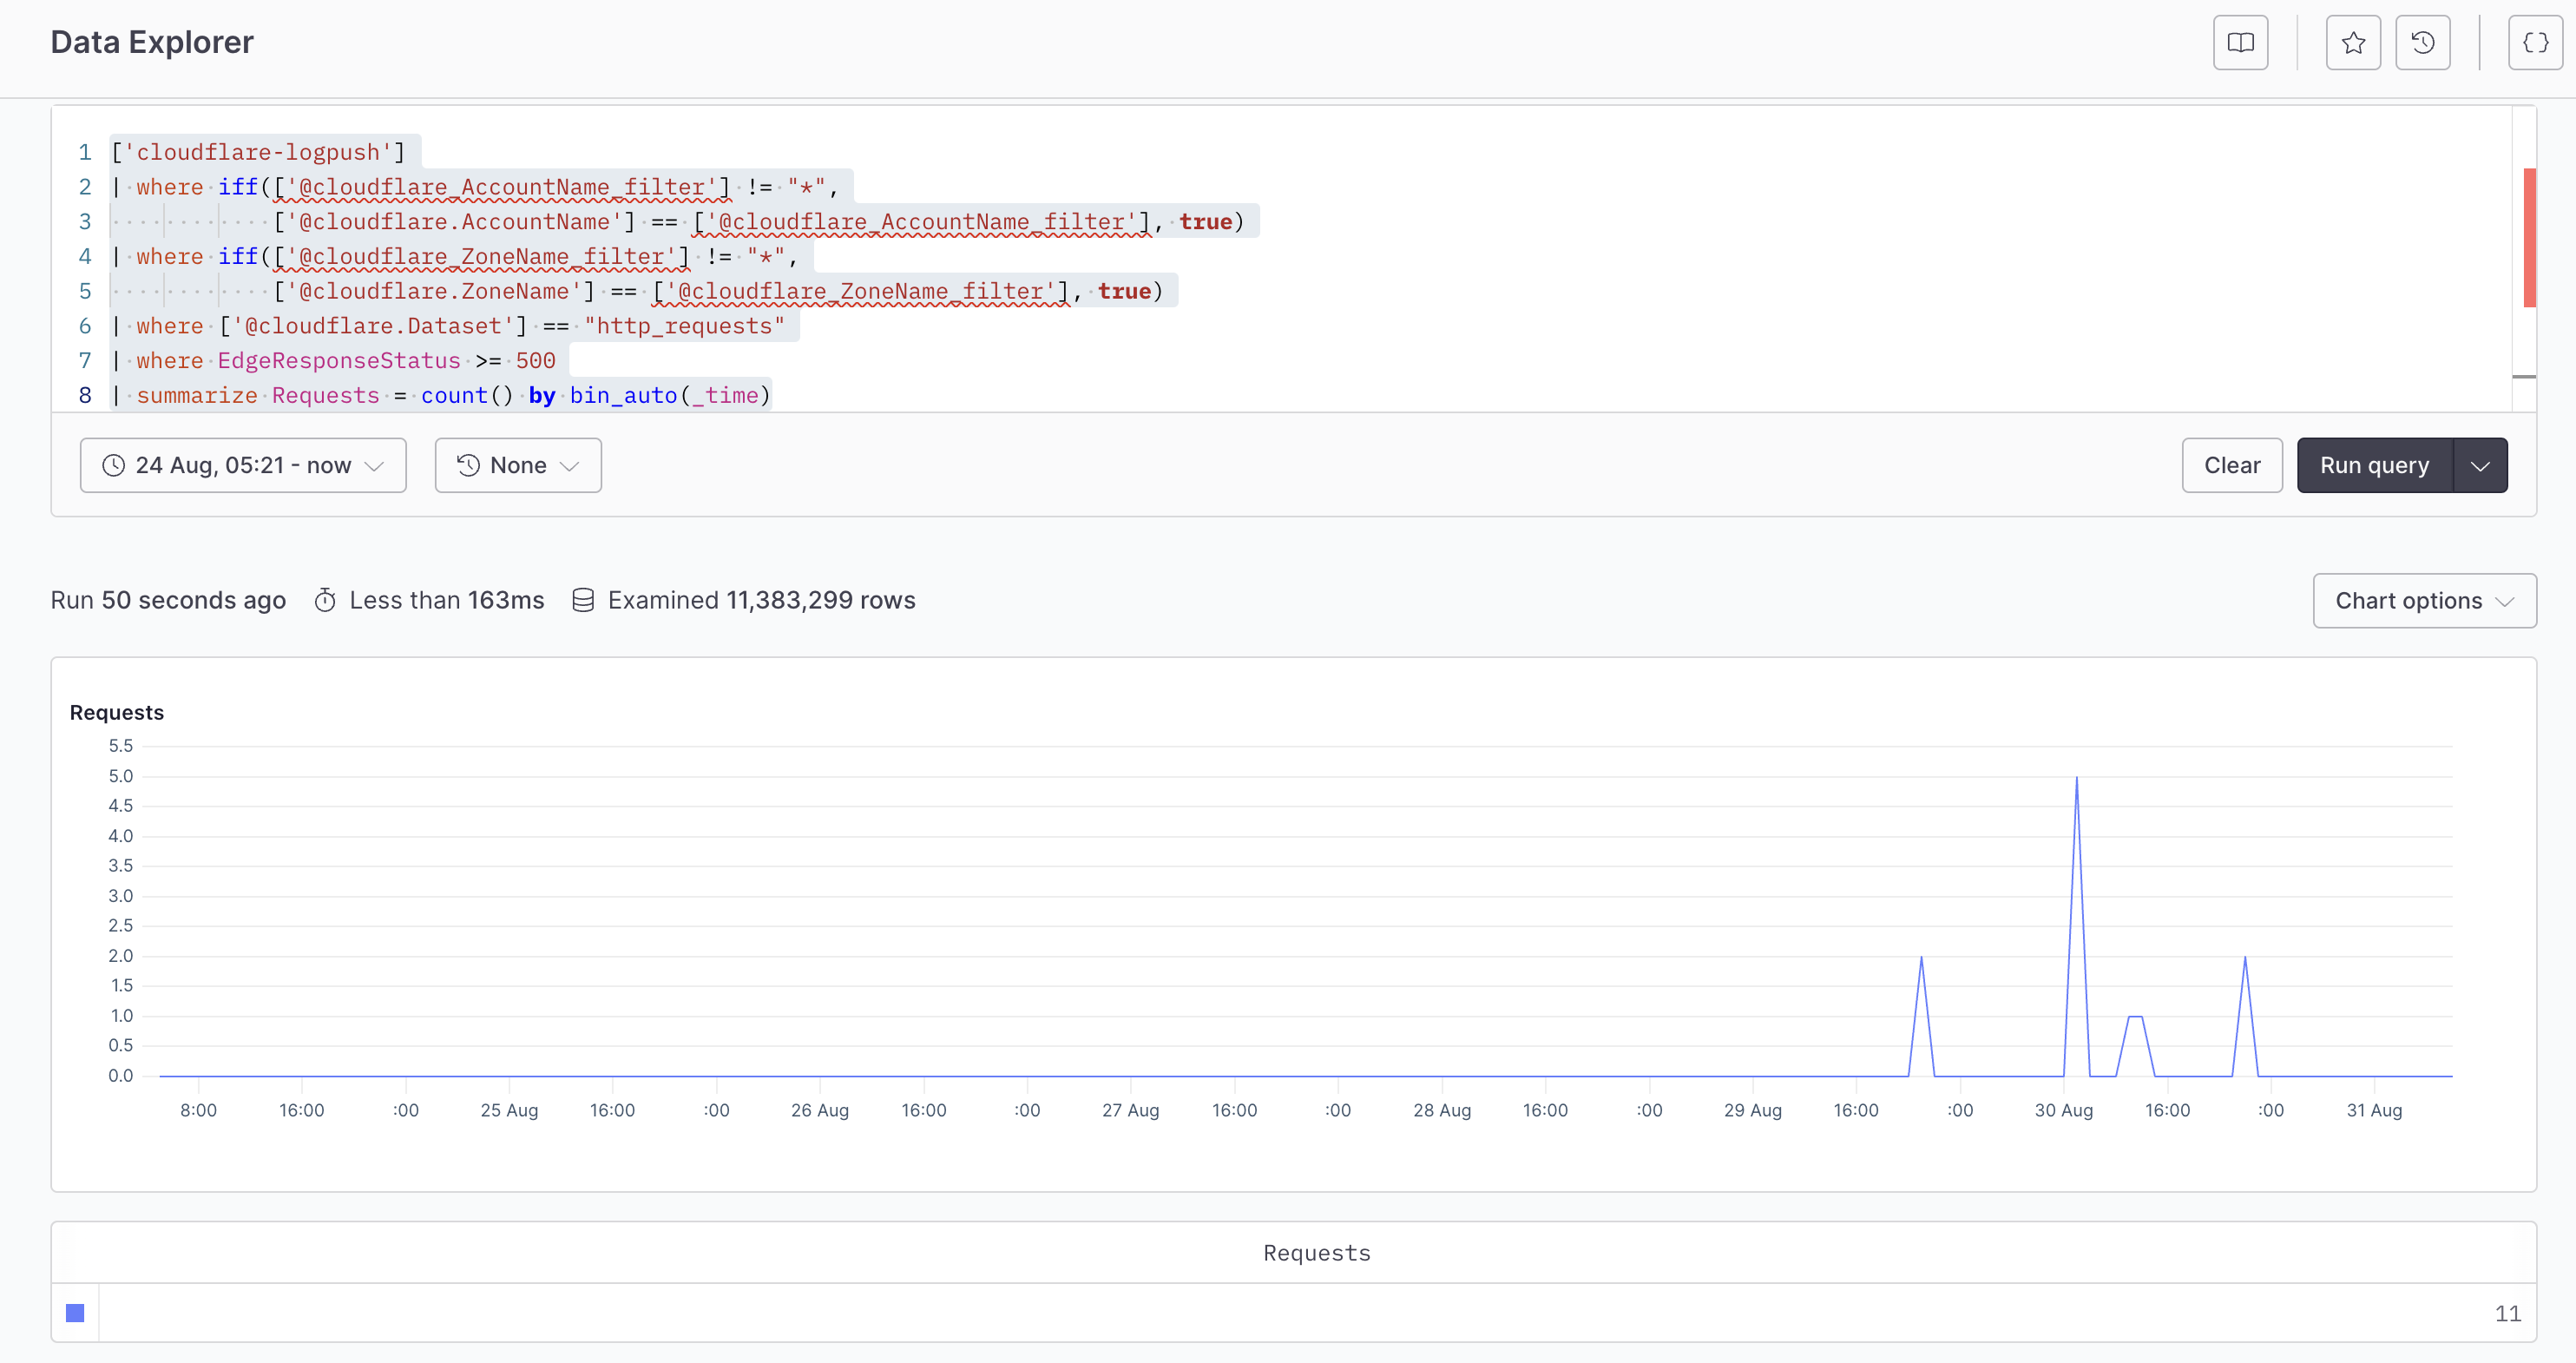
 * Actionable insights for troubleshooting: The dashboard doesn’t just provide raw data; it provides insights. Whether it’s an error that needs immediate fixing or performance metrics that show an error from your app, having this information readily available makes it easier to identify problems and resolve them swiftly.
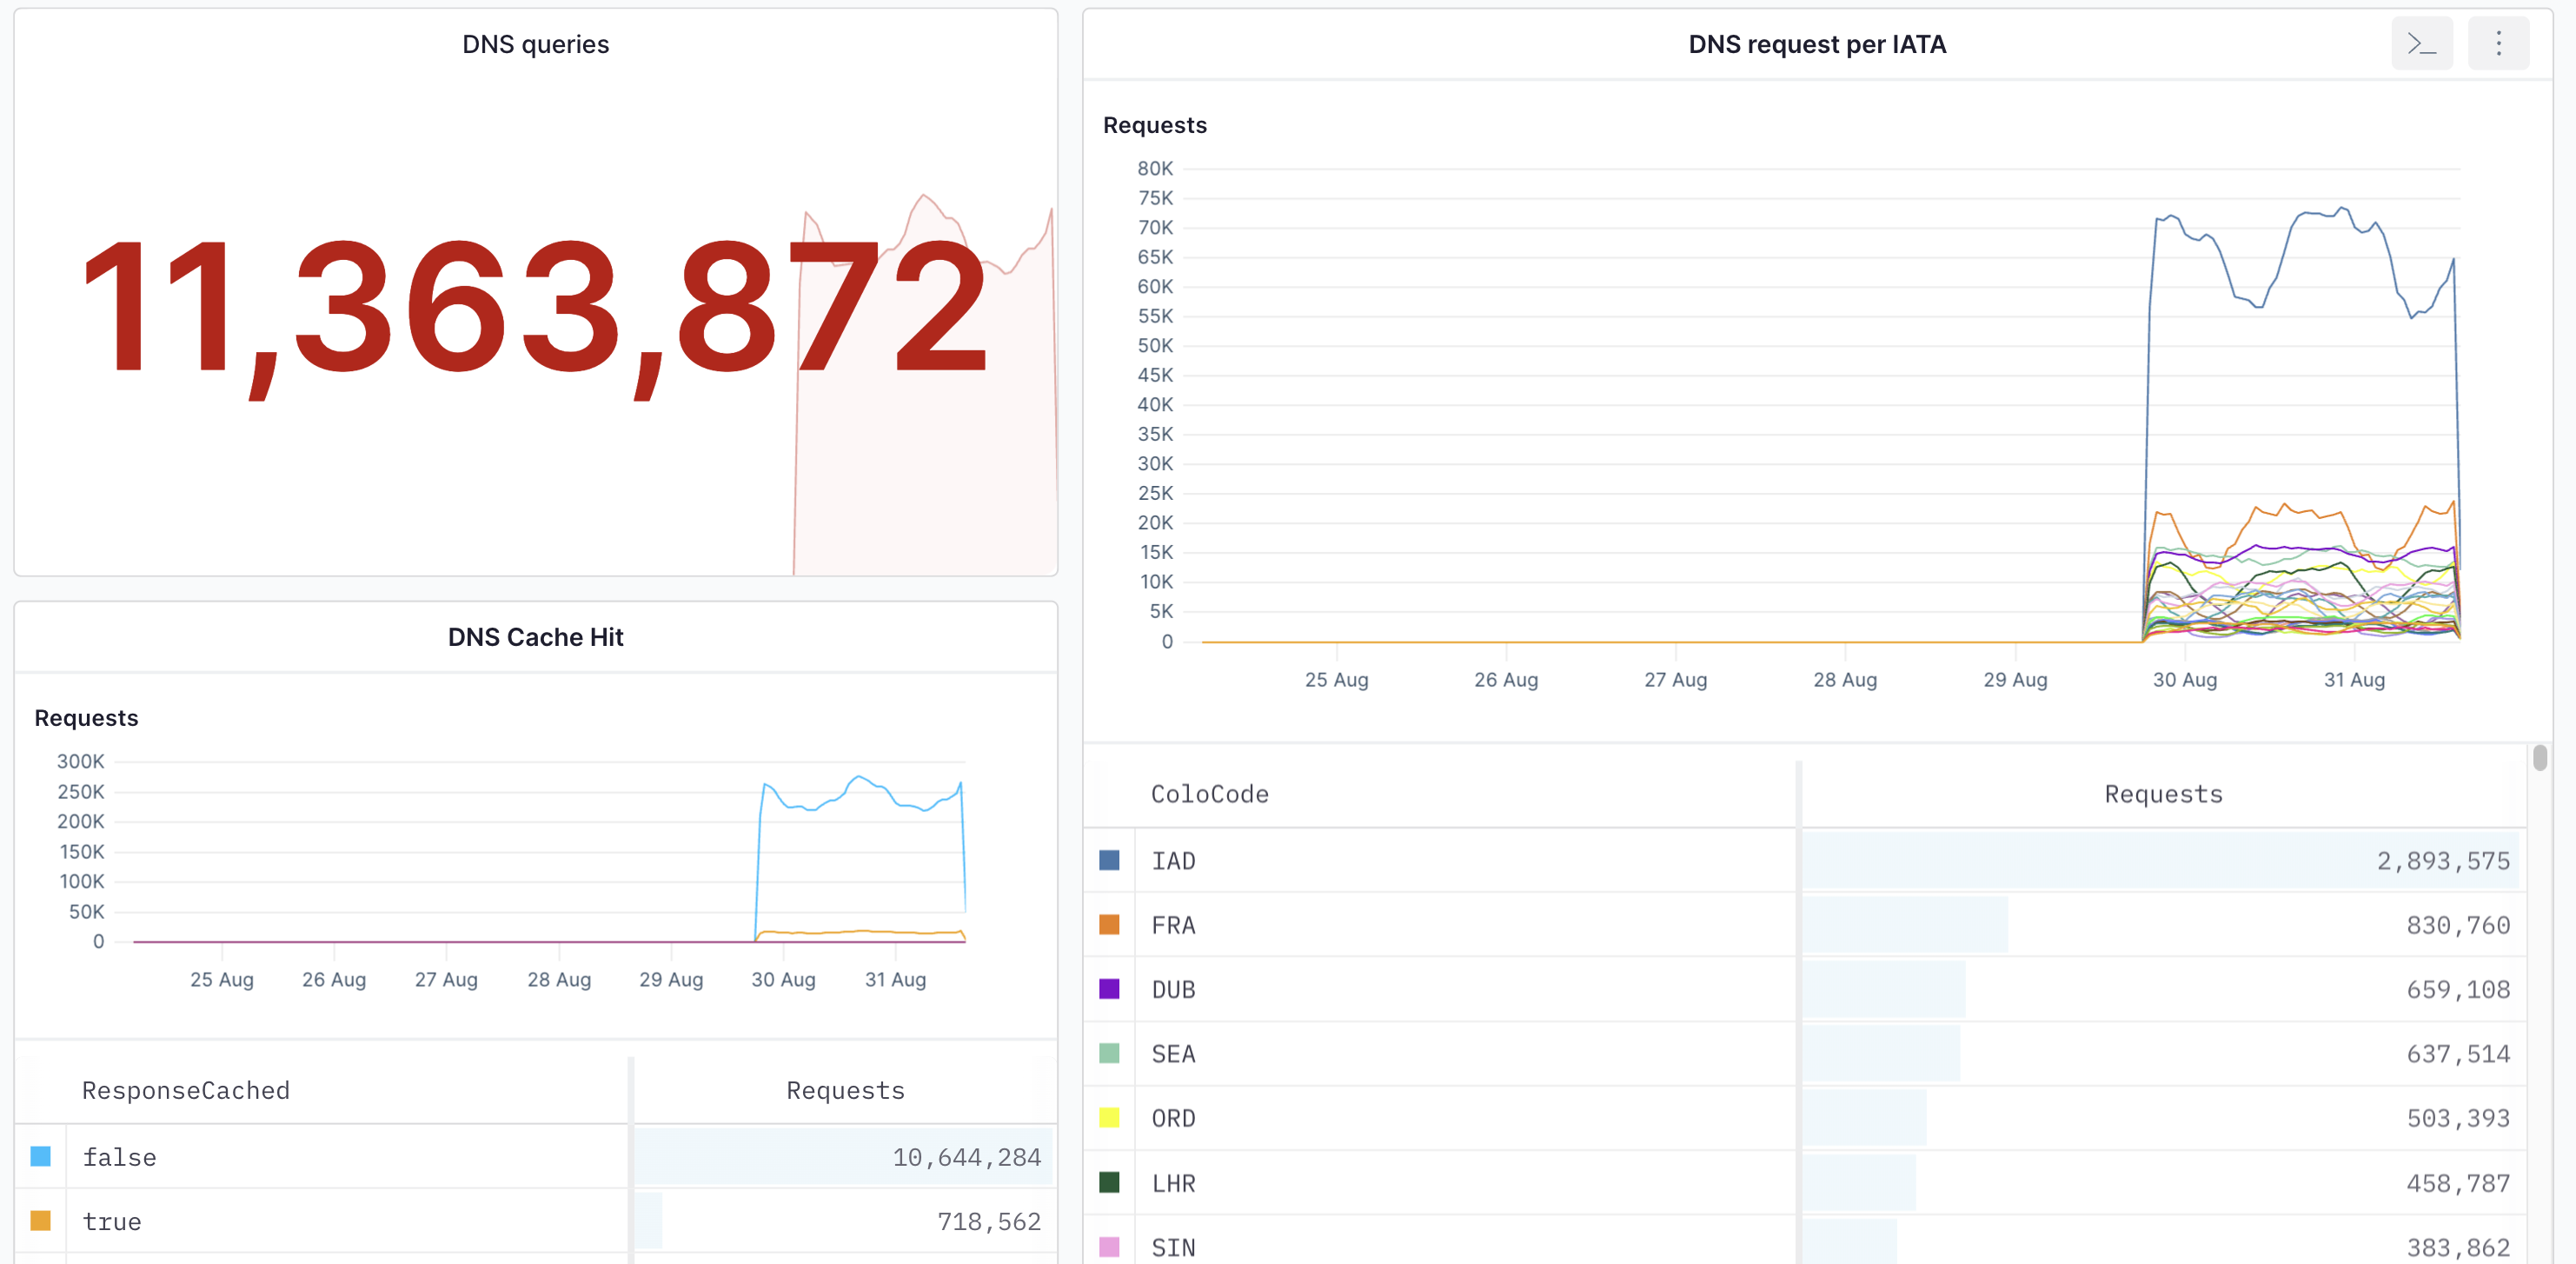
 * DNS metrics: Understanding the DNS requests, DNS queries, and DNS cache hit from your app is vital to track if there’s a request spike or get the total number of queries in your system.
 * Centralized logging and error tracing: With logs coming in from various parts of your app stack, centralizing them within Axiom makes it easier to correlate events across different layers of your infrastructure. This is crucial for troubleshooting complex issues that may span multiple services or components.
 ## Supported Cloudflare Logpush Datasets [#supported-cloudflare-logpush-datasets]
Axiom supports all the Cloudflare account-scoped datasets.
Zone-scoped
* DNS logs
* Firewall events
* HTTP requests
* NEL reports
* Spectrum events
Account-scoped
* Access requests
* Audit logs
* CASB Findings
* Device posture results
* DNS Firewall Logs
* Gateway DNS
* Gateway HTTP
* Gateway Network
* Magic IDS Detections
* Network Analytics Logs
* Workers Trace Events
* Zero Trust Network Session Logs
## Supported Cloudflare Logpush Datasets [#supported-cloudflare-logpush-datasets]
Axiom supports all the Cloudflare account-scoped datasets.
Zone-scoped
* DNS logs
* Firewall events
* HTTP requests
* NEL reports
* Spectrum events
Account-scoped
* Access requests
* Audit logs
* CASB Findings
* Device posture results
* DNS Firewall Logs
* Gateway DNS
* Gateway HTTP
* Gateway Network
* Magic IDS Detections
* Network Analytics Logs
* Workers Trace Events
* Zero Trust Network Session Logs
 ## What’s a Grafana data source plugin? [#whats-a-grafana-data-source-plugin]
Grafana is an open-source tool for time-series analytics, visualization, and alerting. It’s frequently used in DevOps and IT Operations roles to provide real-time information on system health and performance.
Data sources in Grafana are the actual databases or services where the data is stored. Grafana has a variety of data source plugins that connect Grafana to different types of databases or services. This enables Grafana to query those sources from display that data on its dashboards. The data sources can be anything from traditional SQL databases to time-series databases or metrics, and logs from Axiom.
A Grafana data source plugin extends the functionality of Grafana by allowing it to interact with a specific type of data source. These plugins enable users to extract data from a variety of different sources, not just those that come supported by default in Grafana.
## Prerequisites [#prerequisites]
* [Create an Axiom account](https://app.axiom.co/register).
* [Create a dataset in Axiom](/reference/datasets#create-dataset) where you send your data.
* [Create an advanced API token in Axiom](/reference/tokens#create-advanced-api-token) with permissions to query data from the dataset you have created. Basic API tokens only allow data ingestion and won't work with Grafana.
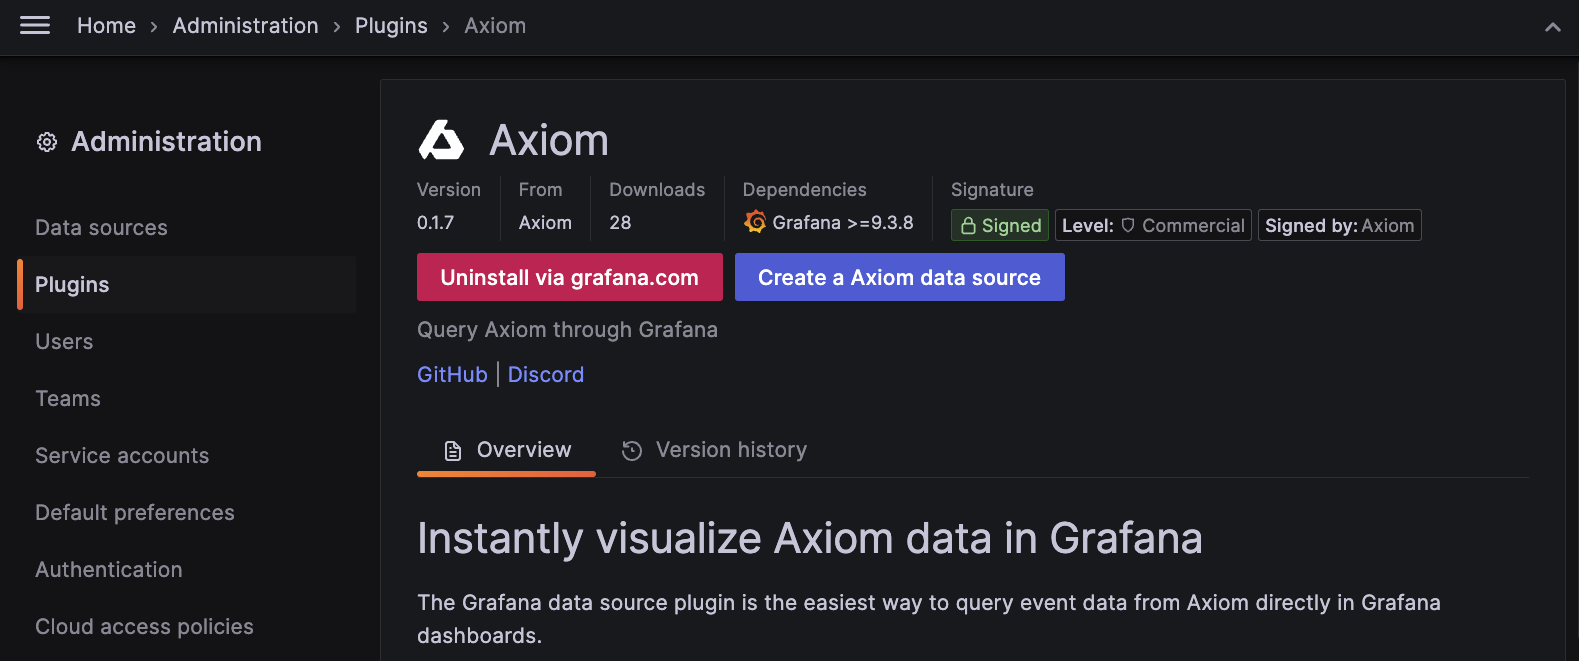
## Install the Axiom Grafana data source plugin on Grafana Cloud [#install-the-axiom-grafana-data-source-plugin-on-grafana-cloud]
* In Grafana, click Administration > Plugins in the side navigation menu to view installed plugins.
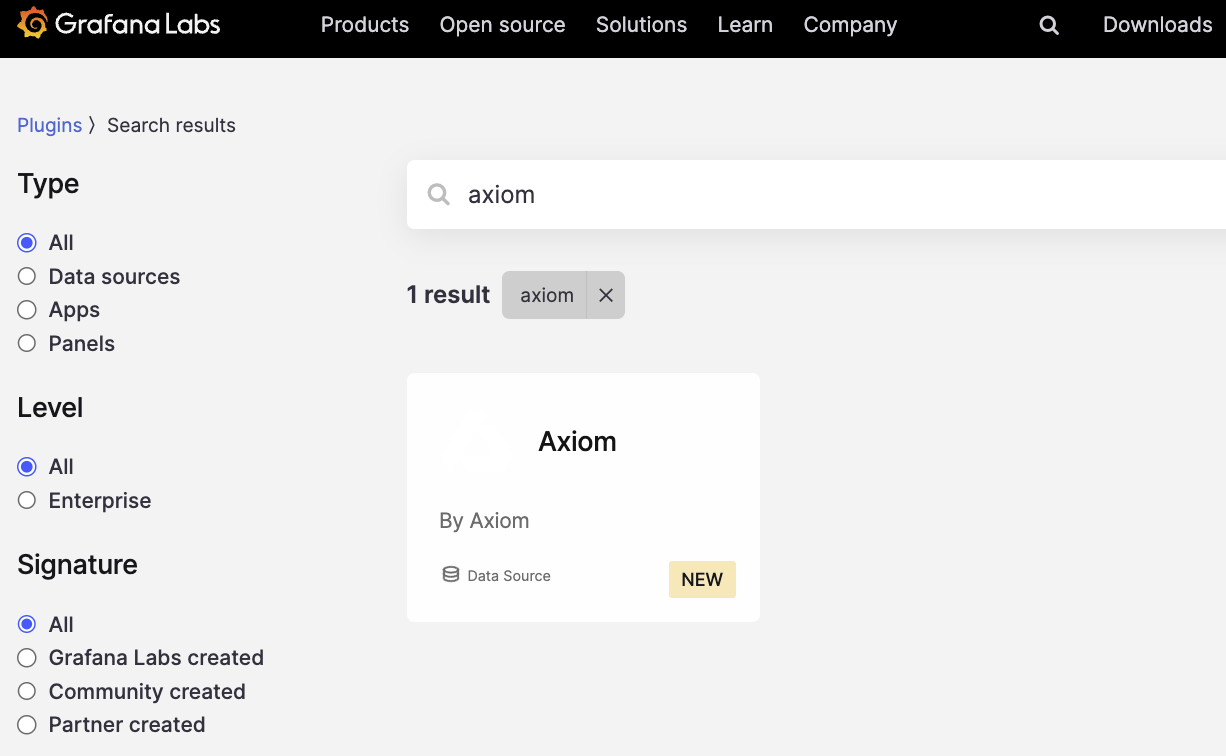
* In the filter bar, search for the Axiom plugin
* Click on the plugin logo.
* Click Install.
## What’s a Grafana data source plugin? [#whats-a-grafana-data-source-plugin]
Grafana is an open-source tool for time-series analytics, visualization, and alerting. It’s frequently used in DevOps and IT Operations roles to provide real-time information on system health and performance.
Data sources in Grafana are the actual databases or services where the data is stored. Grafana has a variety of data source plugins that connect Grafana to different types of databases or services. This enables Grafana to query those sources from display that data on its dashboards. The data sources can be anything from traditional SQL databases to time-series databases or metrics, and logs from Axiom.
A Grafana data source plugin extends the functionality of Grafana by allowing it to interact with a specific type of data source. These plugins enable users to extract data from a variety of different sources, not just those that come supported by default in Grafana.
## Prerequisites [#prerequisites]
* [Create an Axiom account](https://app.axiom.co/register).
* [Create a dataset in Axiom](/reference/datasets#create-dataset) where you send your data.
* [Create an advanced API token in Axiom](/reference/tokens#create-advanced-api-token) with permissions to query data from the dataset you have created. Basic API tokens only allow data ingestion and won't work with Grafana.
## Install the Axiom Grafana data source plugin on Grafana Cloud [#install-the-axiom-grafana-data-source-plugin-on-grafana-cloud]
* In Grafana, click Administration > Plugins in the side navigation menu to view installed plugins.
* In the filter bar, search for the Axiom plugin
* Click on the plugin logo.
* Click Install.
 When the update is complete, a confirmation message is displayed, indicating that the installation was successful.
* The Axiom Grafana Plugin is also installable from the [Grafana Plugins page](https://grafana.com/grafana/plugins/axiomhq-axiom-datasource/)
When the update is complete, a confirmation message is displayed, indicating that the installation was successful.
* The Axiom Grafana Plugin is also installable from the [Grafana Plugins page](https://grafana.com/grafana/plugins/axiomhq-axiom-datasource/)
 ## Install the Axiom Grafana data source plugin on local Grafana [#install-the-axiom-grafana-data-source-plugin-on-local-grafana]
The Axiom data source plugin for Grafana is [open source on GitHub](https://github.com/axiomhq/axiom-grafana). It can be installed via the Grafana CLI, or via Docker.
### Install the Axiom Grafana Plugin using Grafana CLI [#install-the-axiom-grafana-plugin-using-grafana-cli]
```bash
grafana-cli plugins install axiomhq-axiom-datasource
```
### Install Via Docker [#install-via-docker]
* Add the plugin to your `docker-compose.yml` or `Dockerfile`
* Set the environment variable `GF_INSTALL_PLUGINS` to include the plugin
Example:
`GF_INSTALL_PLUGINS="axiomhq-axiom-datasource"`
## Configuration [#configuration]
* Add a new data source in Grafana
* Select the Axiom data source type.
## Install the Axiom Grafana data source plugin on local Grafana [#install-the-axiom-grafana-data-source-plugin-on-local-grafana]
The Axiom data source plugin for Grafana is [open source on GitHub](https://github.com/axiomhq/axiom-grafana). It can be installed via the Grafana CLI, or via Docker.
### Install the Axiom Grafana Plugin using Grafana CLI [#install-the-axiom-grafana-plugin-using-grafana-cli]
```bash
grafana-cli plugins install axiomhq-axiom-datasource
```
### Install Via Docker [#install-via-docker]
* Add the plugin to your `docker-compose.yml` or `Dockerfile`
* Set the environment variable `GF_INSTALL_PLUGINS` to include the plugin
Example:
`GF_INSTALL_PLUGINS="axiomhq-axiom-datasource"`
## Configuration [#configuration]
* Add a new data source in Grafana
* Select the Axiom data source type.
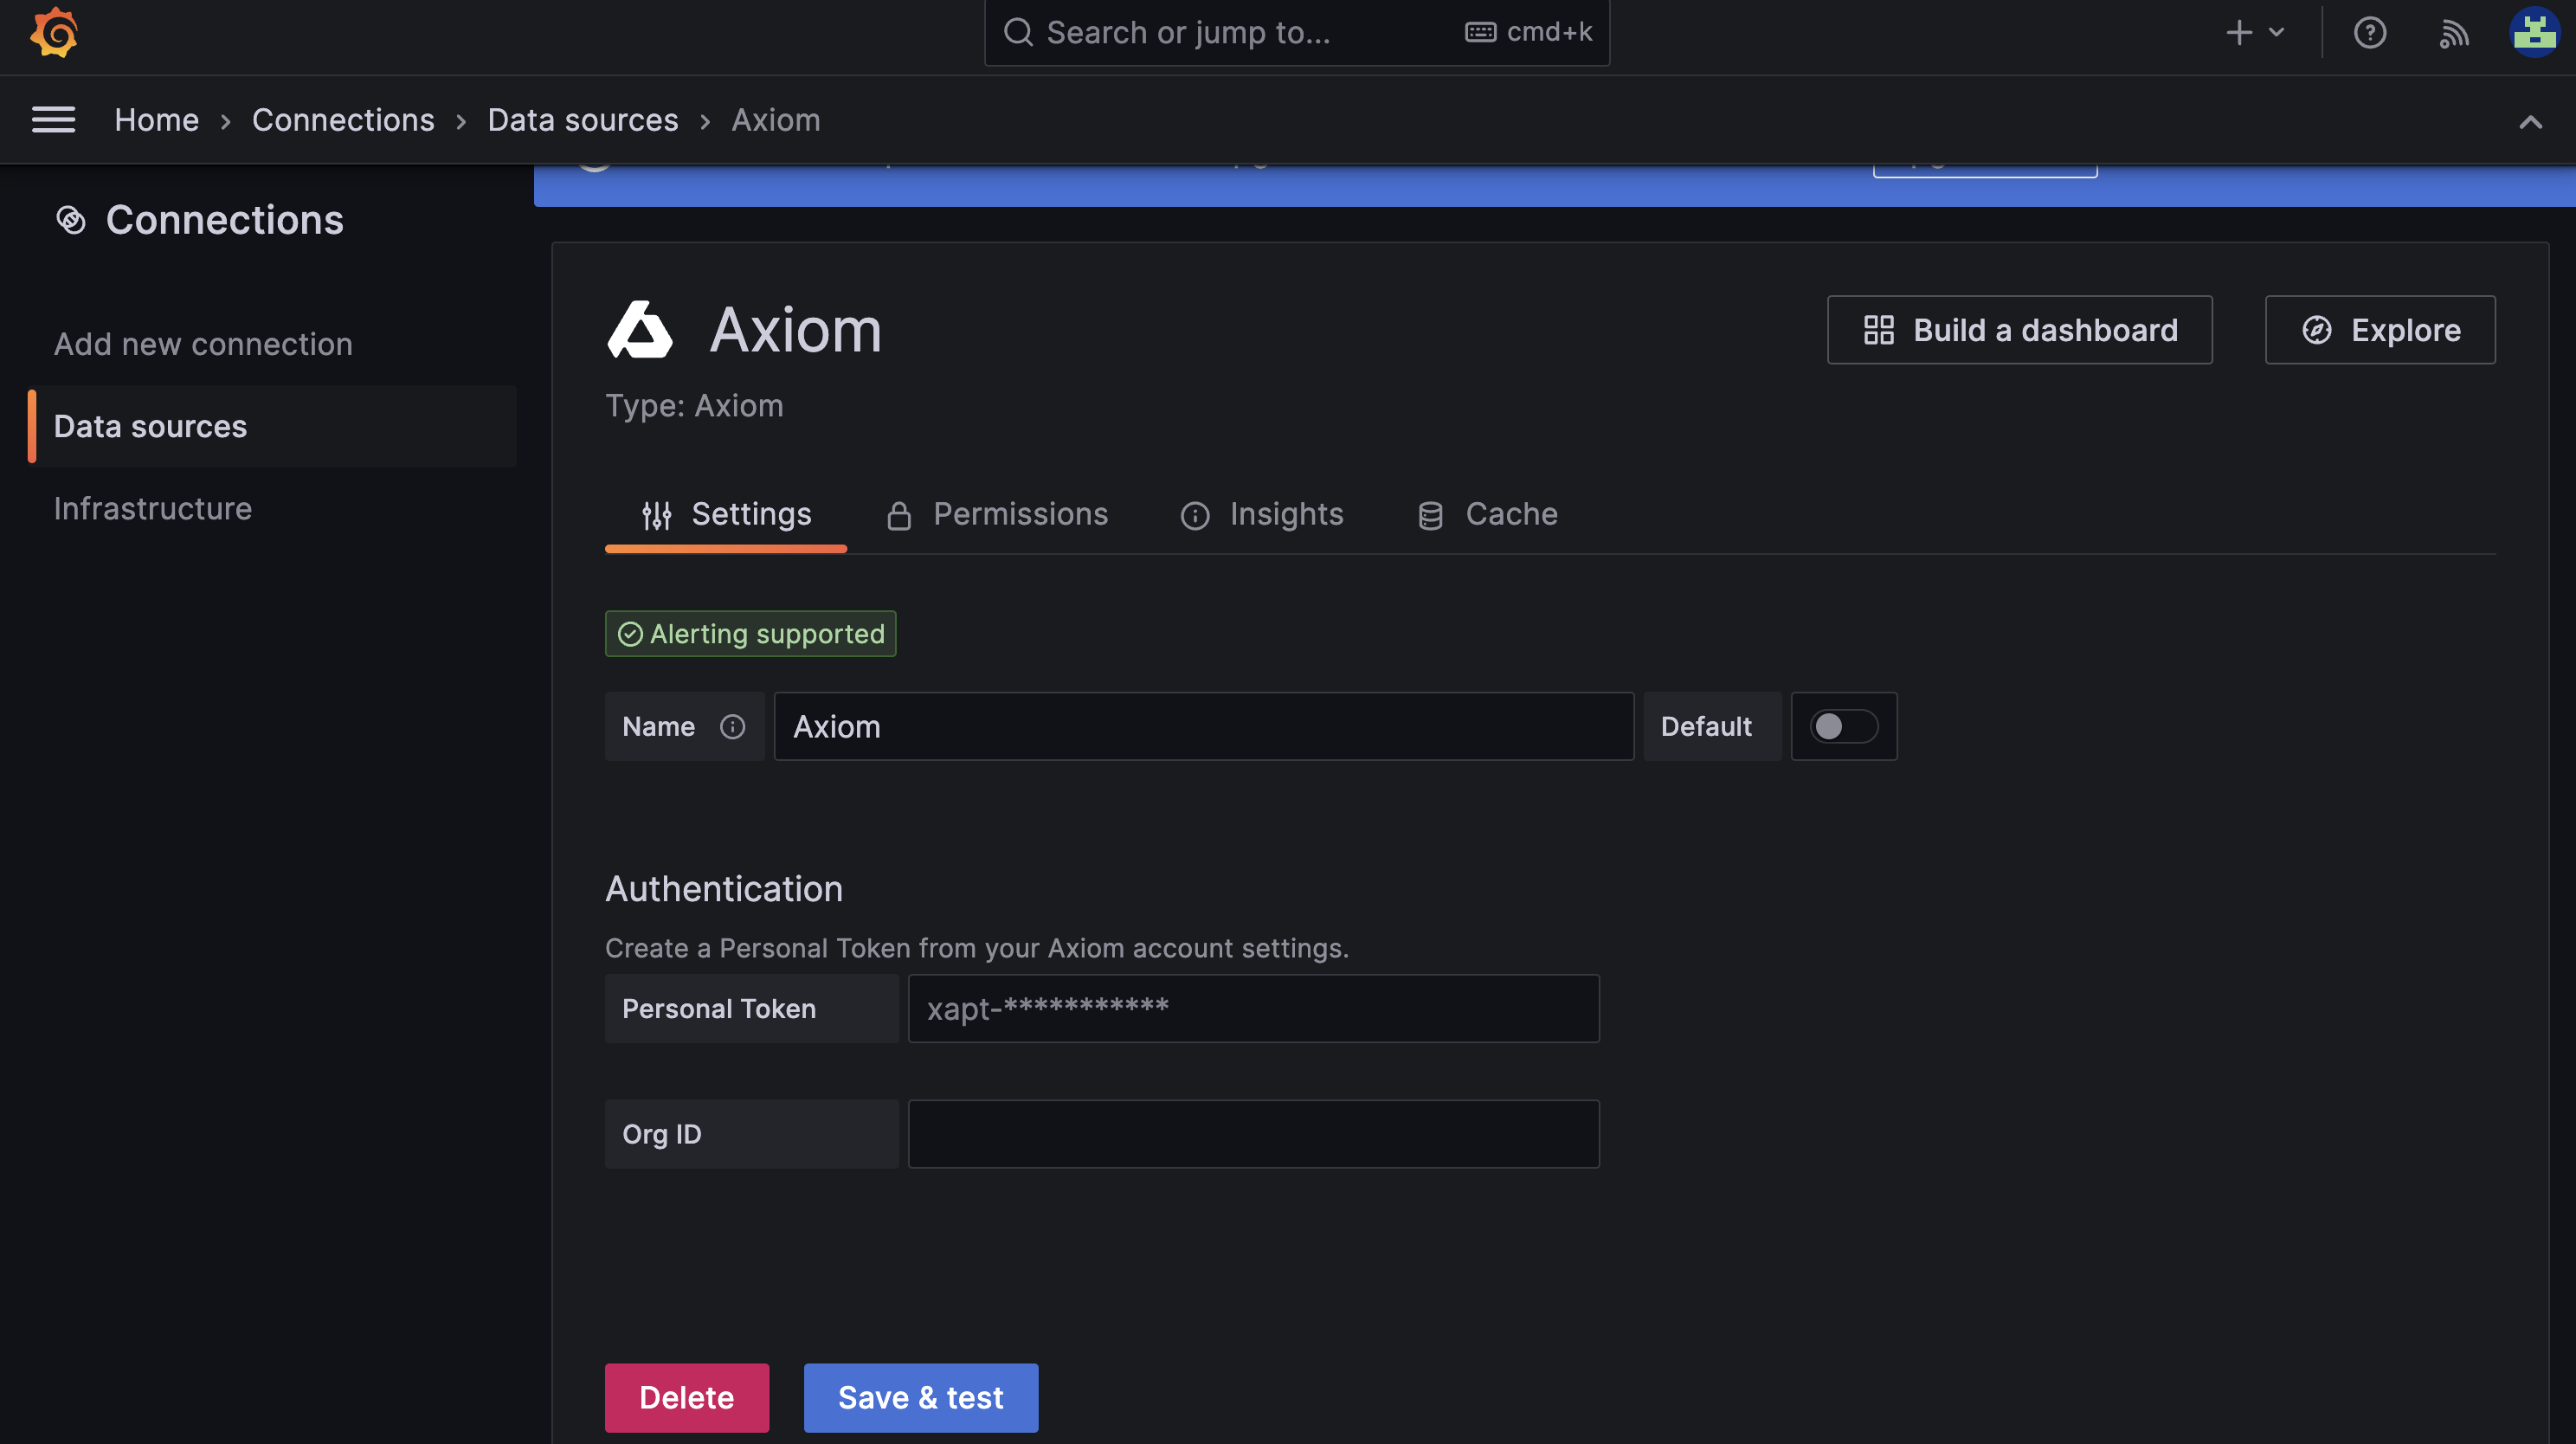 * Enter the previously generated API token.
* Save and test the data source.
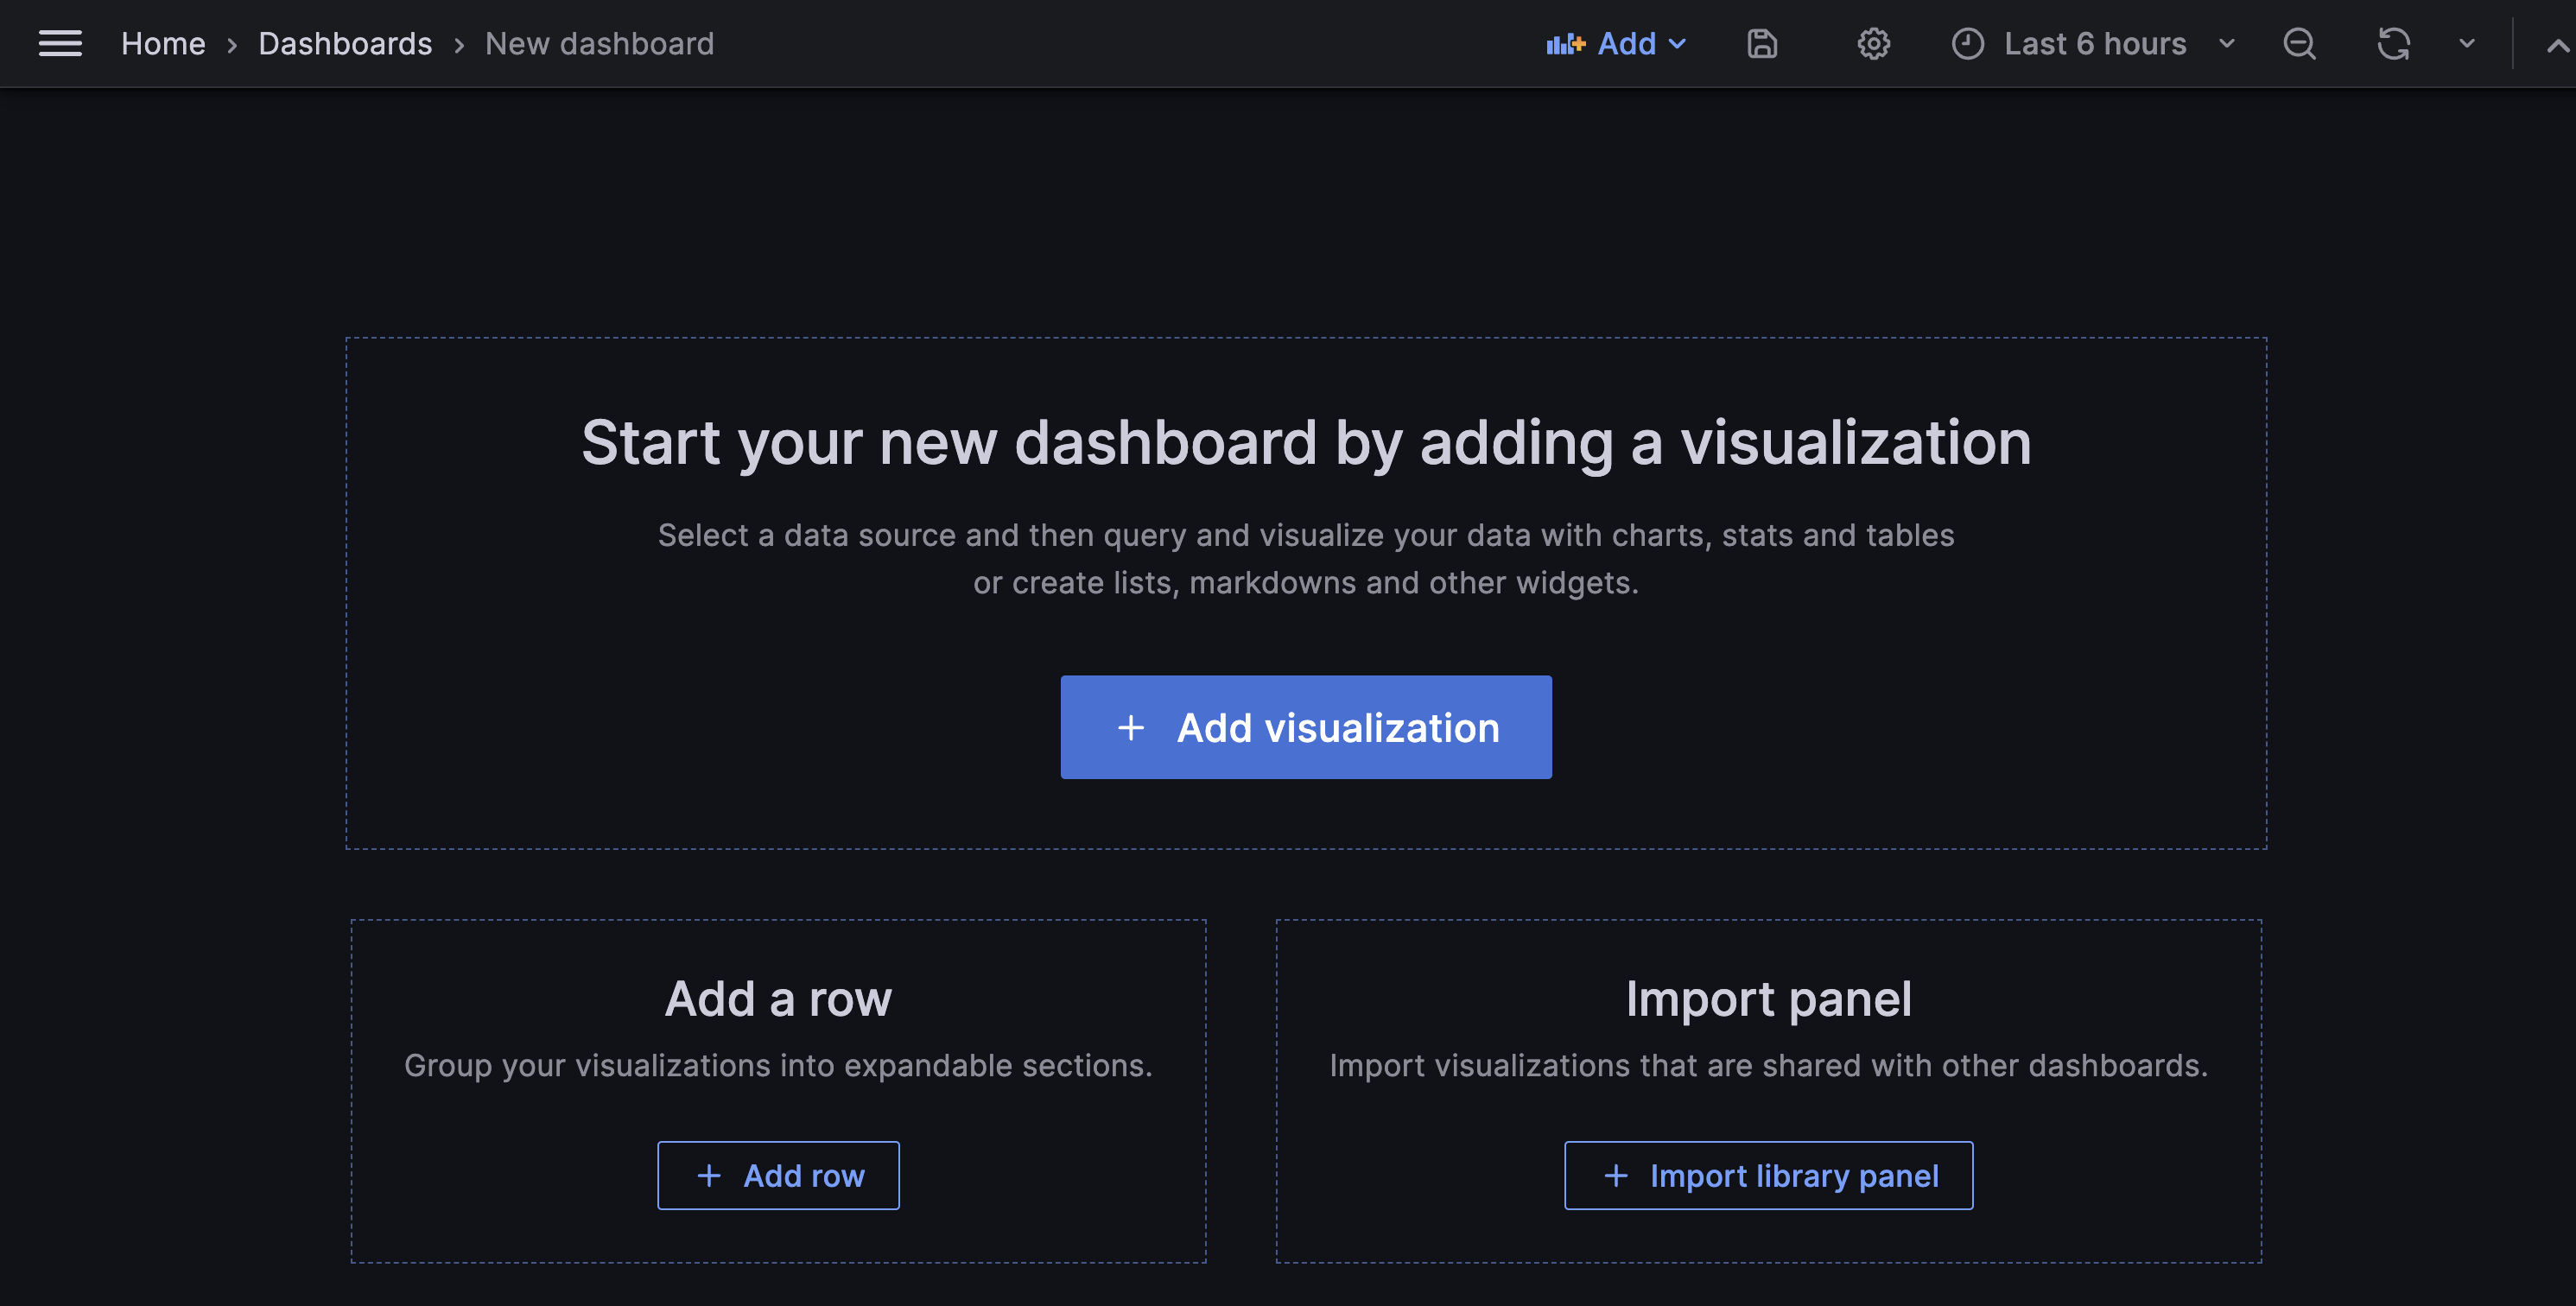
## Build Queries with Query Editor [#build-queries-with-query-editor]
The Axiom data source Plugin provides a custom query editor to build and visualize your Axiom event data. After configuring the Axiom data source, start building visualizations from metrics and logs stored in Axiom.
* Create a new panel in Grafana by clicking on Add visualization
* Enter the previously generated API token.
* Save and test the data source.
## Build Queries with Query Editor [#build-queries-with-query-editor]
The Axiom data source Plugin provides a custom query editor to build and visualize your Axiom event data. After configuring the Axiom data source, start building visualizations from metrics and logs stored in Axiom.
* Create a new panel in Grafana by clicking on Add visualization
 * Select the Axiom data source.
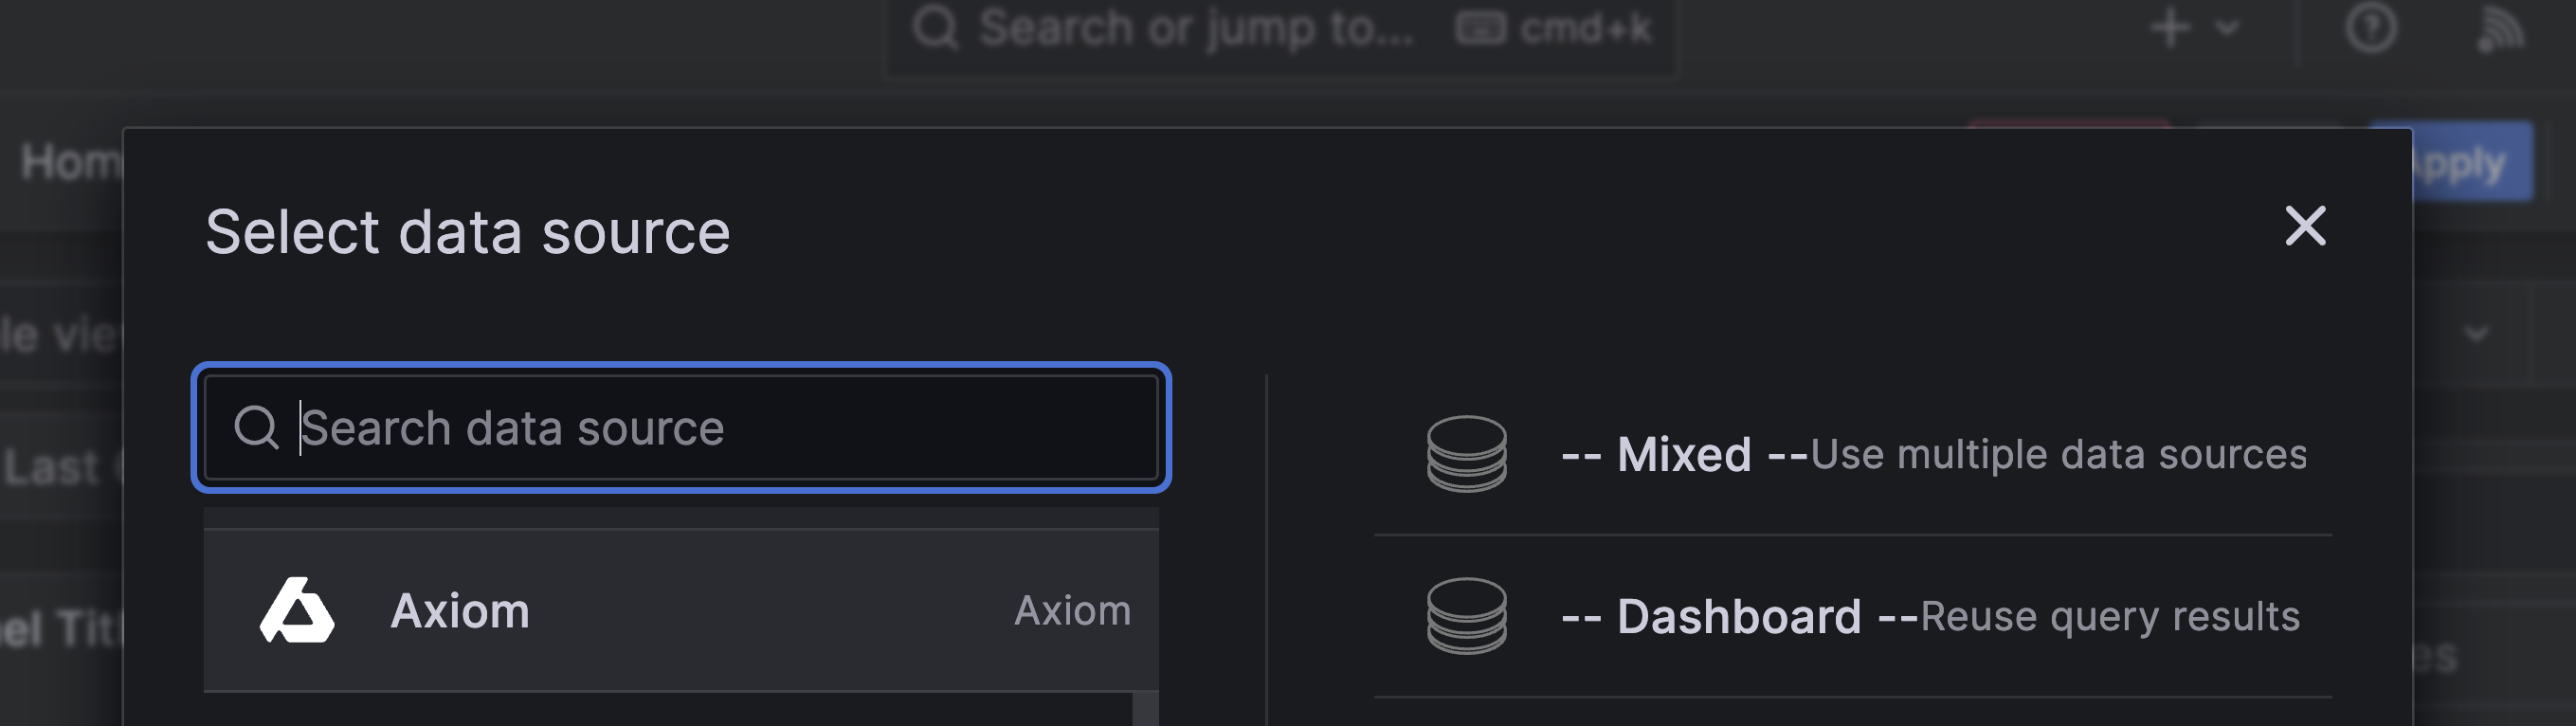 * Use the query editor to choose the desired metrics, dimensions, and filters.
 ## Benefits of the Axiom Grafana data source plugin [#benefits-of-the-axiom-grafana-data-source-plugin]
The Axiom Grafana data source plugin allows users to display and interact with their Axiom data directly from within Grafana. By doing so, it provides several advantages:
1. **Unified visualization:** The Axiom Grafana data source plugin allows users to utilize Grafana’s powerful visualization tools with Axiom’s data. This enables users to create, explore, and share dashboards which visually represent their Axiom logs and metrics.
## Benefits of the Axiom Grafana data source plugin [#benefits-of-the-axiom-grafana-data-source-plugin]
The Axiom Grafana data source plugin allows users to display and interact with their Axiom data directly from within Grafana. By doing so, it provides several advantages:
1. **Unified visualization:** The Axiom Grafana data source plugin allows users to utilize Grafana’s powerful visualization tools with Axiom’s data. This enables users to create, explore, and share dashboards which visually represent their Axiom logs and metrics.
 3. **Customizable Alerting:** Grafana’s alerting feature allows you to set alerts based on your queries' results, and set up custom alerts based on specific conditions in your Axiom log data.
4. **Sharing and Collaboration:** Grafana’s features for sharing and collaboration can help teams work together more effectively. Share Axiom data visualizations with others, collaborate on dashboards, and discuss insights directly in Grafana.
3. **Customizable Alerting:** Grafana’s alerting feature allows you to set alerts based on your queries' results, and set up custom alerts based on specific conditions in your Axiom log data.
4. **Sharing and Collaboration:** Grafana’s features for sharing and collaboration can help teams work together more effectively. Share Axiom data visualizations with others, collaborate on dashboards, and discuss insights directly in Grafana.
 ---
# Map location data with Axiom and Hex
Source: https://axiom.co/docs/apps/hex
Hex is a powerful collaborative data platform that allows you to create notebooks with Python/SQL code and interactive visualizations.
This page explains how to integrate Hex with Axiom to visualize geospatial data from your logs. You ingest location data into Axiom, query it using APL, and create interactive map visualizations in Hex.
---
# Map location data with Axiom and Hex
Source: https://axiom.co/docs/apps/hex
Hex is a powerful collaborative data platform that allows you to create notebooks with Python/SQL code and interactive visualizations.
This page explains how to integrate Hex with Axiom to visualize geospatial data from your logs. You ingest location data into Axiom, query it using APL, and create interactive map visualizations in Hex.
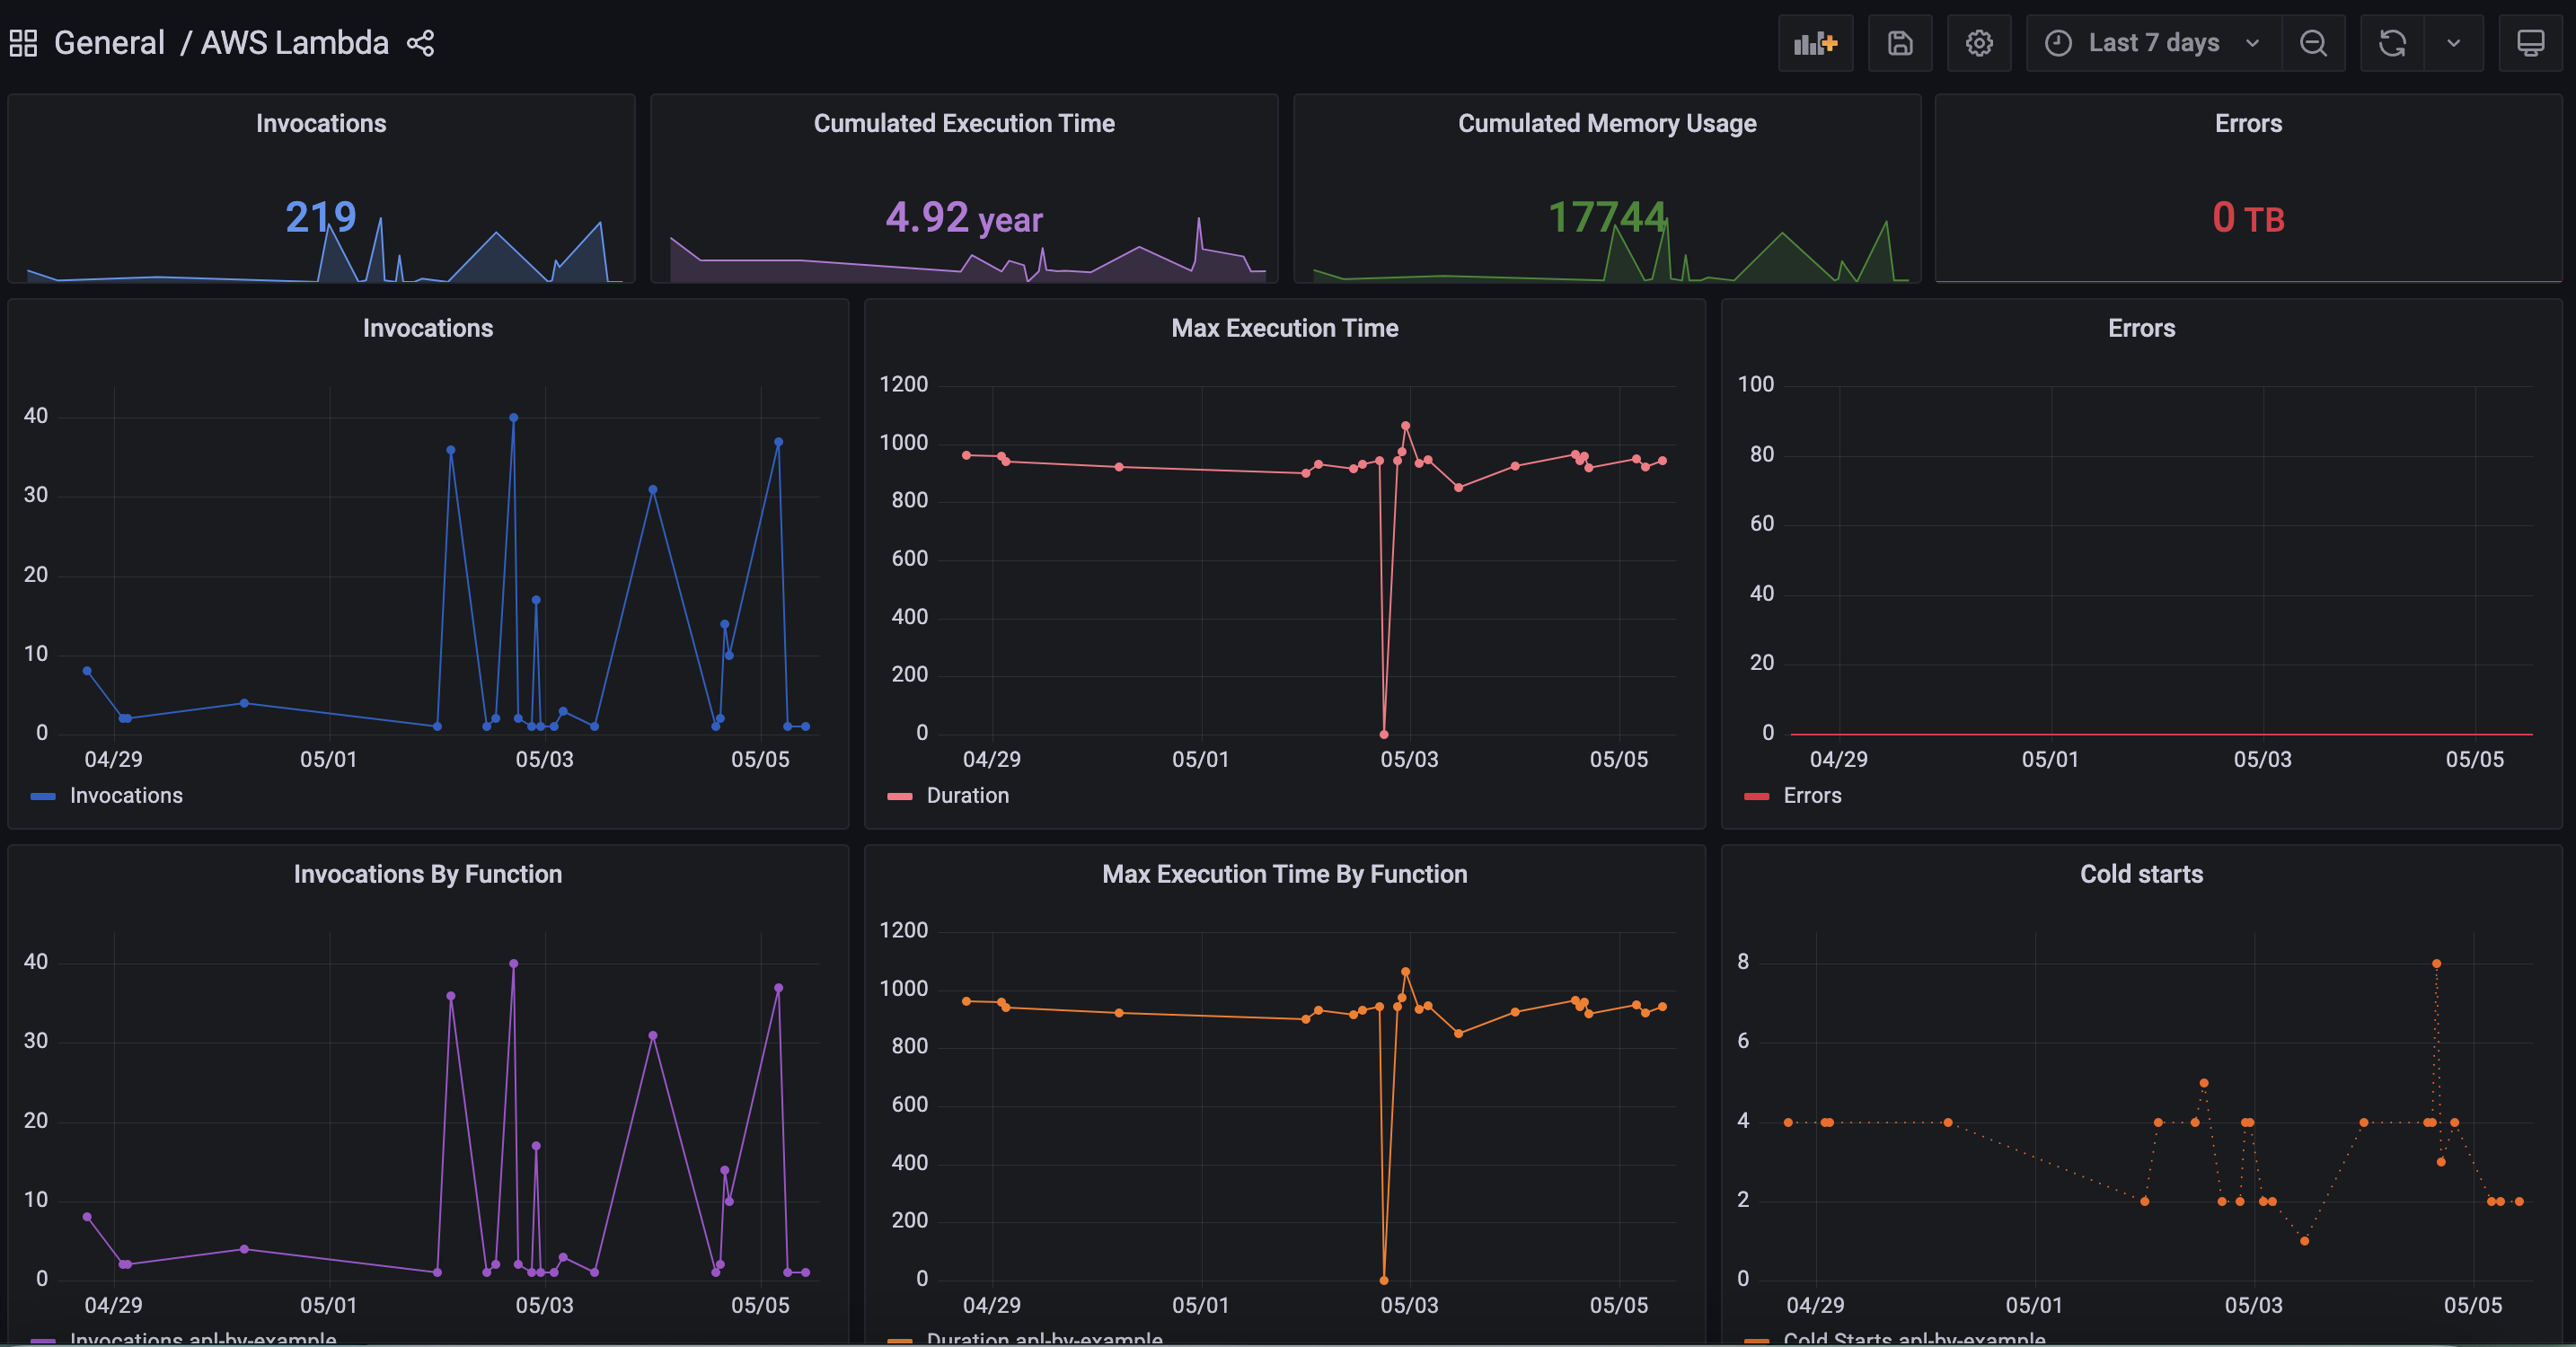
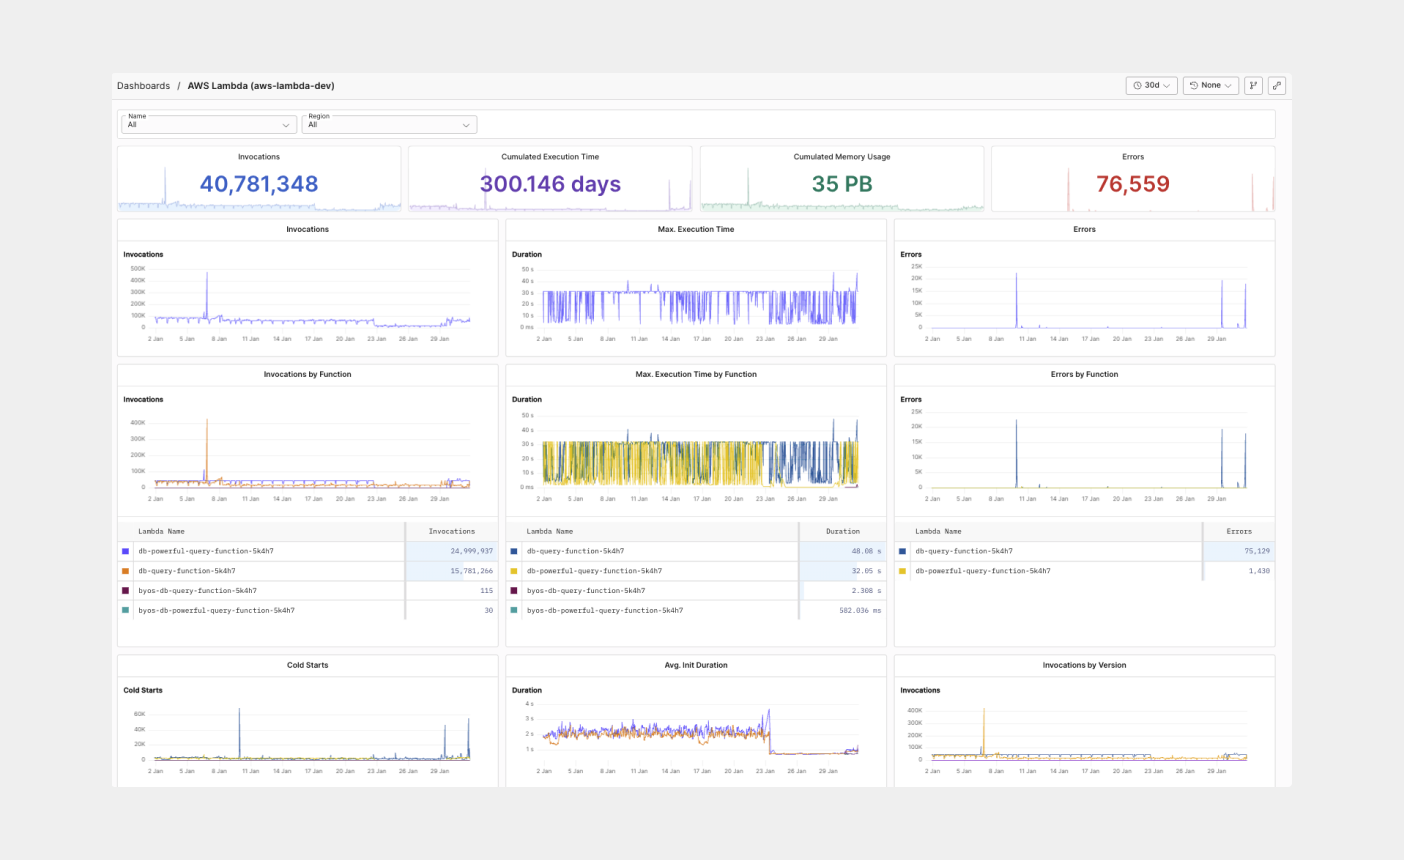 ## Monitor Lambda functions and usage in Axiom [#monitor-lambda-functions-and-usage-in-axiom]
Having real-time visibility into your function logs is important because any duration between sending your lambda request and the execution time can cause a delay and adds to customer-facing latency. You need to be able to measure and track your Lambda invocations, maximum execution time, minimum execution time, and all invocations by function.
## Monitor Lambda functions and usage in Axiom [#monitor-lambda-functions-and-usage-in-axiom]
Having real-time visibility into your function logs is important because any duration between sending your lambda request and the execution time can cause a delay and adds to customer-facing latency. You need to be able to measure and track your Lambda invocations, maximum execution time, minimum execution time, and all invocations by function.
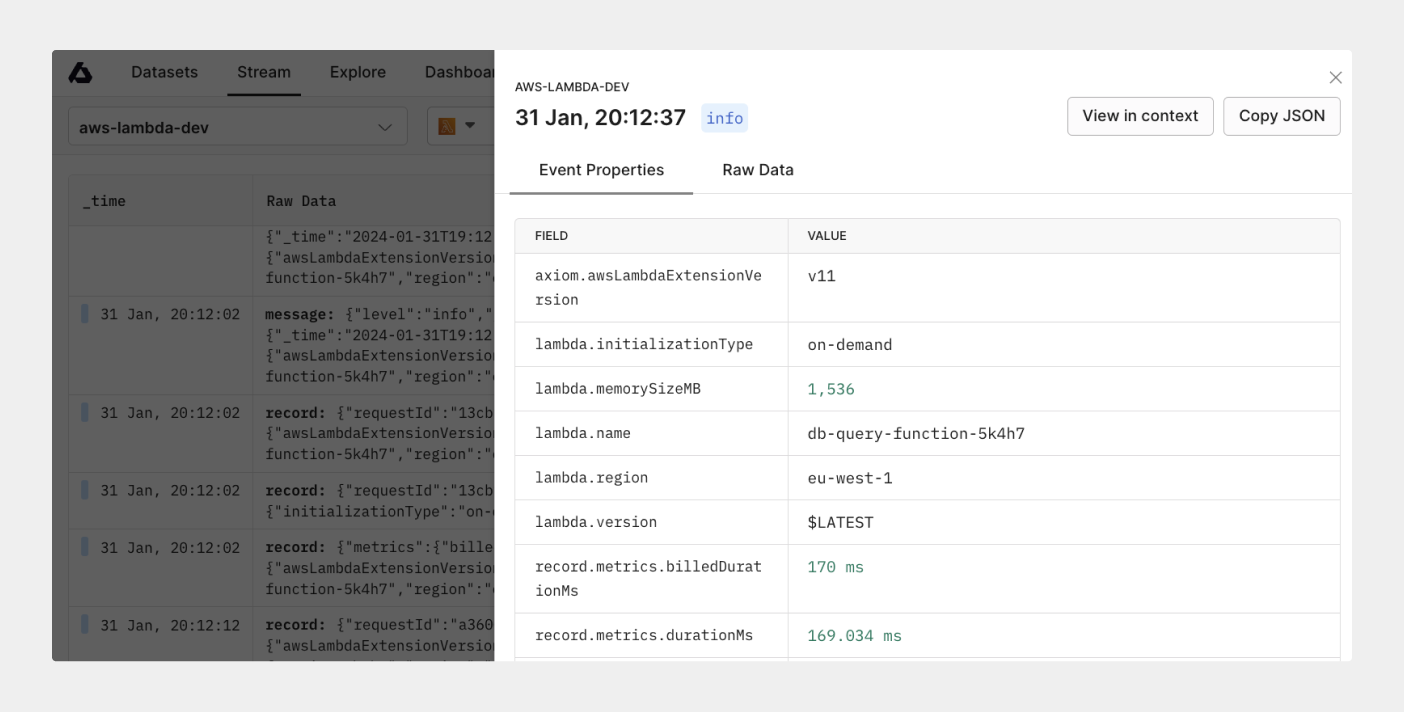
 The Axiom Lambda Extension gives you full visibility into the most important metrics and logs coming from your Lambda function out of the box without any further configuration required.
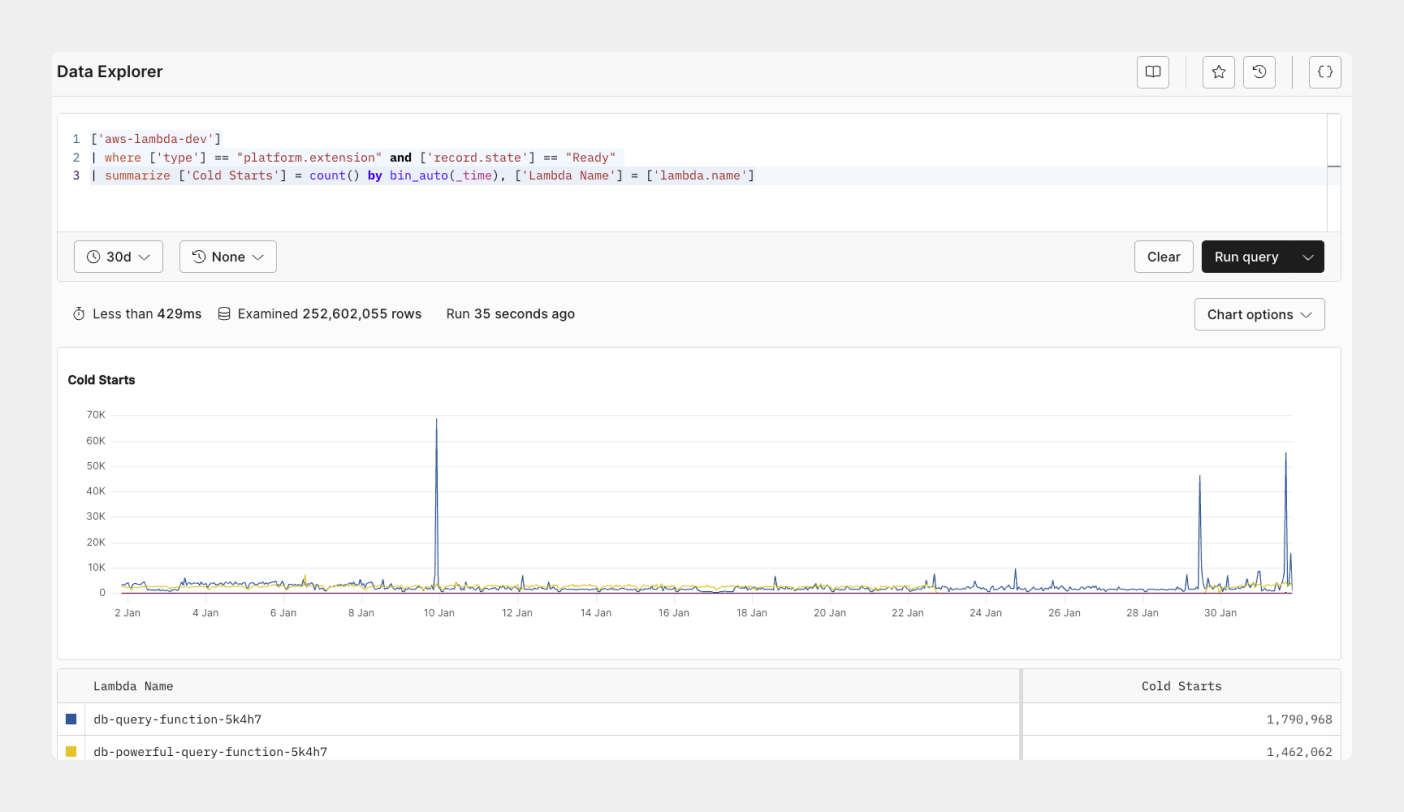
 ## Track cold start on your Lambda function [#track-cold-start-on-your-lambda-function]
A cold start occurs when there’s a delay between your invocation and runtime created during the initialization process. During this period, there’s no available function instance to respond to an invocation. With the Axiom built-in Serverless AWS Lambda dashboard, you can track and see the effect of cold start on your Lambda functions and its impact on every Lambda function. This data lets you know when to take actionable steps, such as using provisioned concurrency or reducing function dependencies.
## Track cold start on your Lambda function [#track-cold-start-on-your-lambda-function]
A cold start occurs when there’s a delay between your invocation and runtime created during the initialization process. During this period, there’s no available function instance to respond to an invocation. With the Axiom built-in Serverless AWS Lambda dashboard, you can track and see the effect of cold start on your Lambda functions and its impact on every Lambda function. This data lets you know when to take actionable steps, such as using provisioned concurrency or reducing function dependencies.
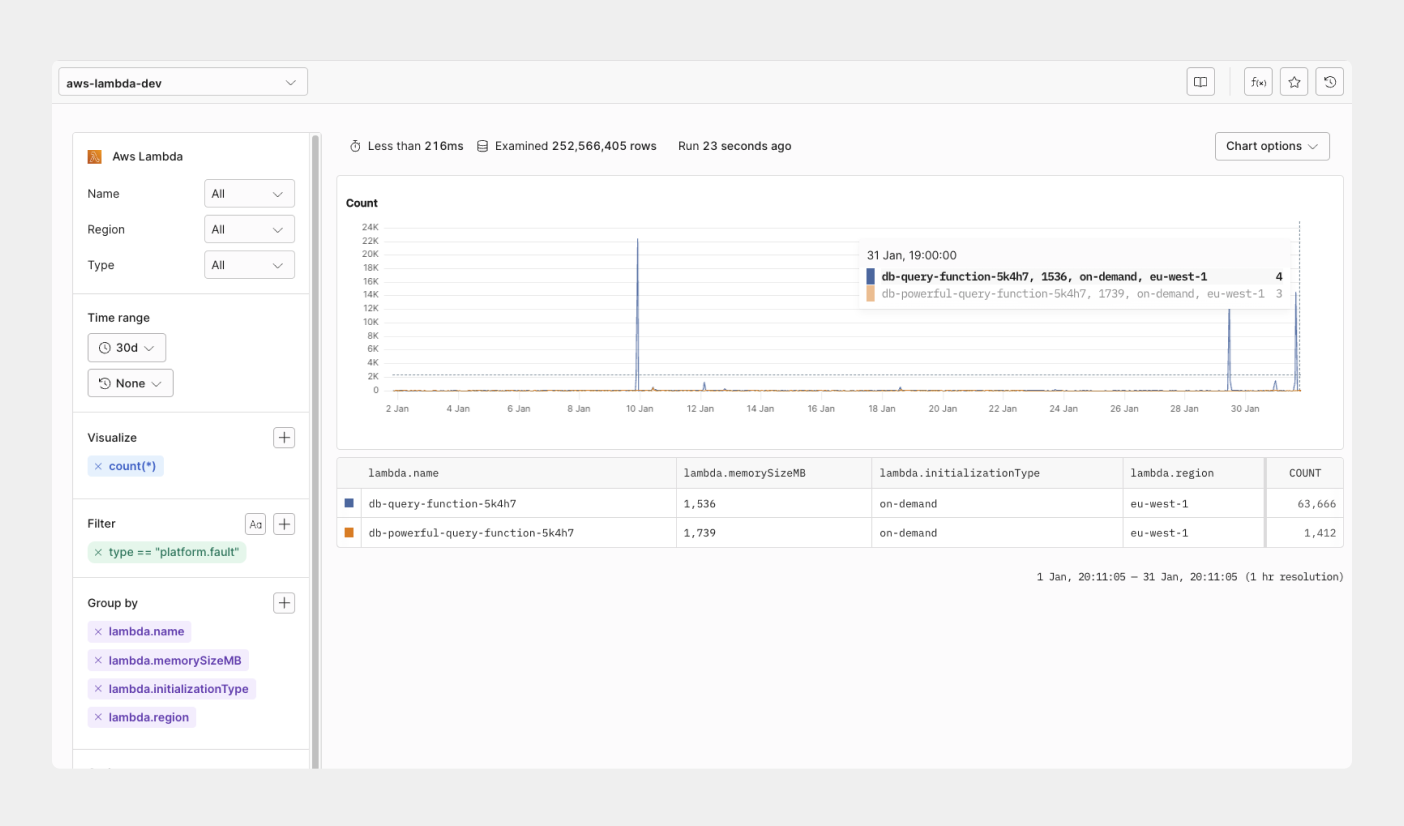
 ## Optimize slow-performing Lambda queries [#optimize-slow-performing-lambda-queries]
Grouping logs with Lambda invocations and execution time by function provides insights into your events request and response pattern. You can extend your query to view when an invocation request is rejected and configure alerts to be notified on Serverless log patterns and Lambda function payloads. With the invocation request dashboard, you can monitor request function logs and see how your Lambda serverless functions process your events and Lambda queues over time.
## Optimize slow-performing Lambda queries [#optimize-slow-performing-lambda-queries]
Grouping logs with Lambda invocations and execution time by function provides insights into your events request and response pattern. You can extend your query to view when an invocation request is rejected and configure alerts to be notified on Serverless log patterns and Lambda function payloads. With the invocation request dashboard, you can monitor request function logs and see how your Lambda serverless functions process your events and Lambda queues over time.
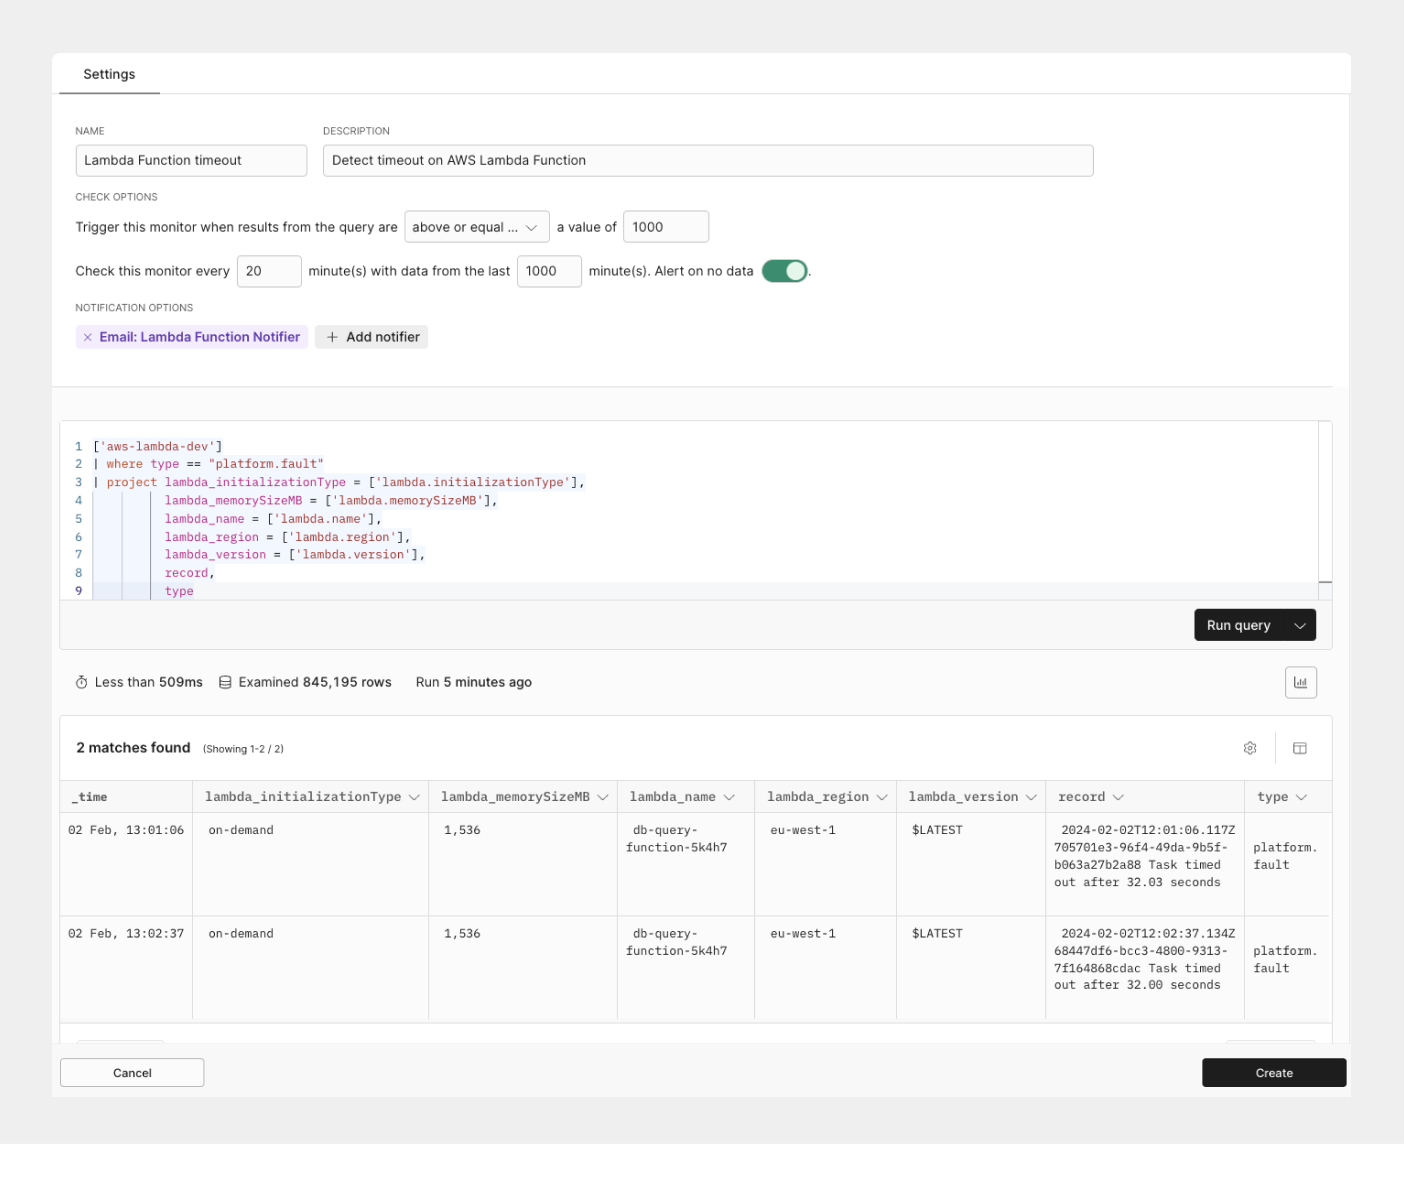
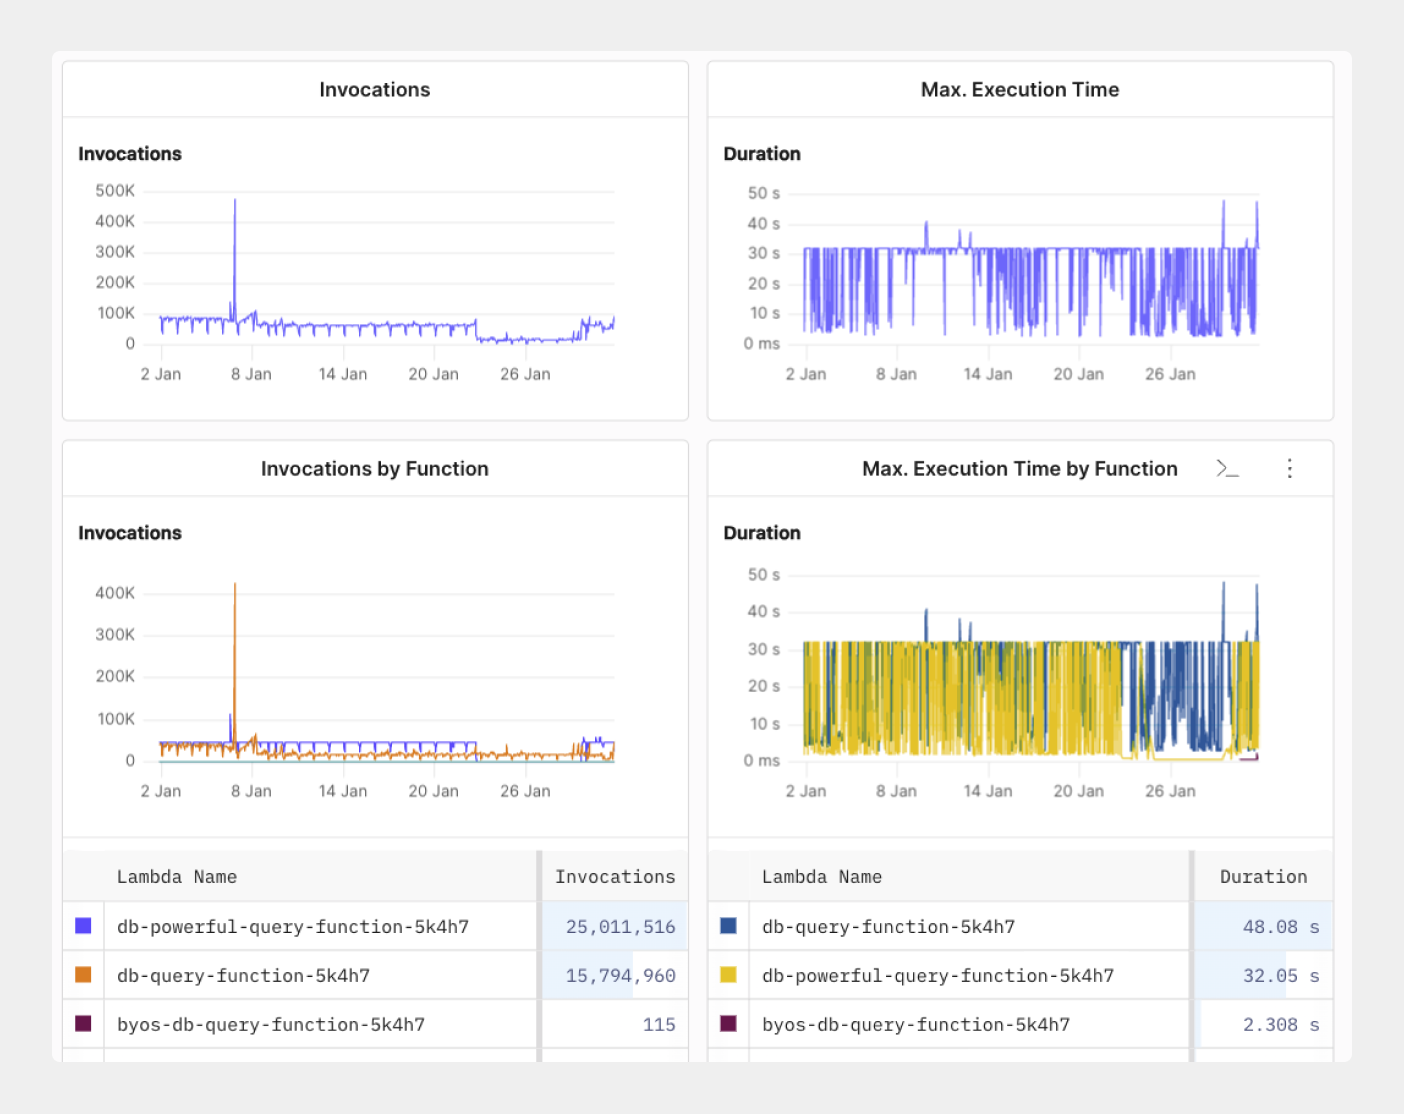 ## Detect timeout on your Lambda function [#detect-timeout-on-your-lambda-function]
Axiom Lambda function monitors let you identify the different points of invocation failures, cold-start delays, and AWS Lambda errors on your Lambda functions. With standard function logs like invocations by function, and Lambda cold start, monitoring the rate of your execution time can alert you to be aware of a significant spike whenever an error occurs in your Lambda function.
## Detect timeout on your Lambda function [#detect-timeout-on-your-lambda-function]
Axiom Lambda function monitors let you identify the different points of invocation failures, cold-start delays, and AWS Lambda errors on your Lambda functions. With standard function logs like invocations by function, and Lambda cold start, monitoring the rate of your execution time can alert you to be aware of a significant spike whenever an error occurs in your Lambda function.
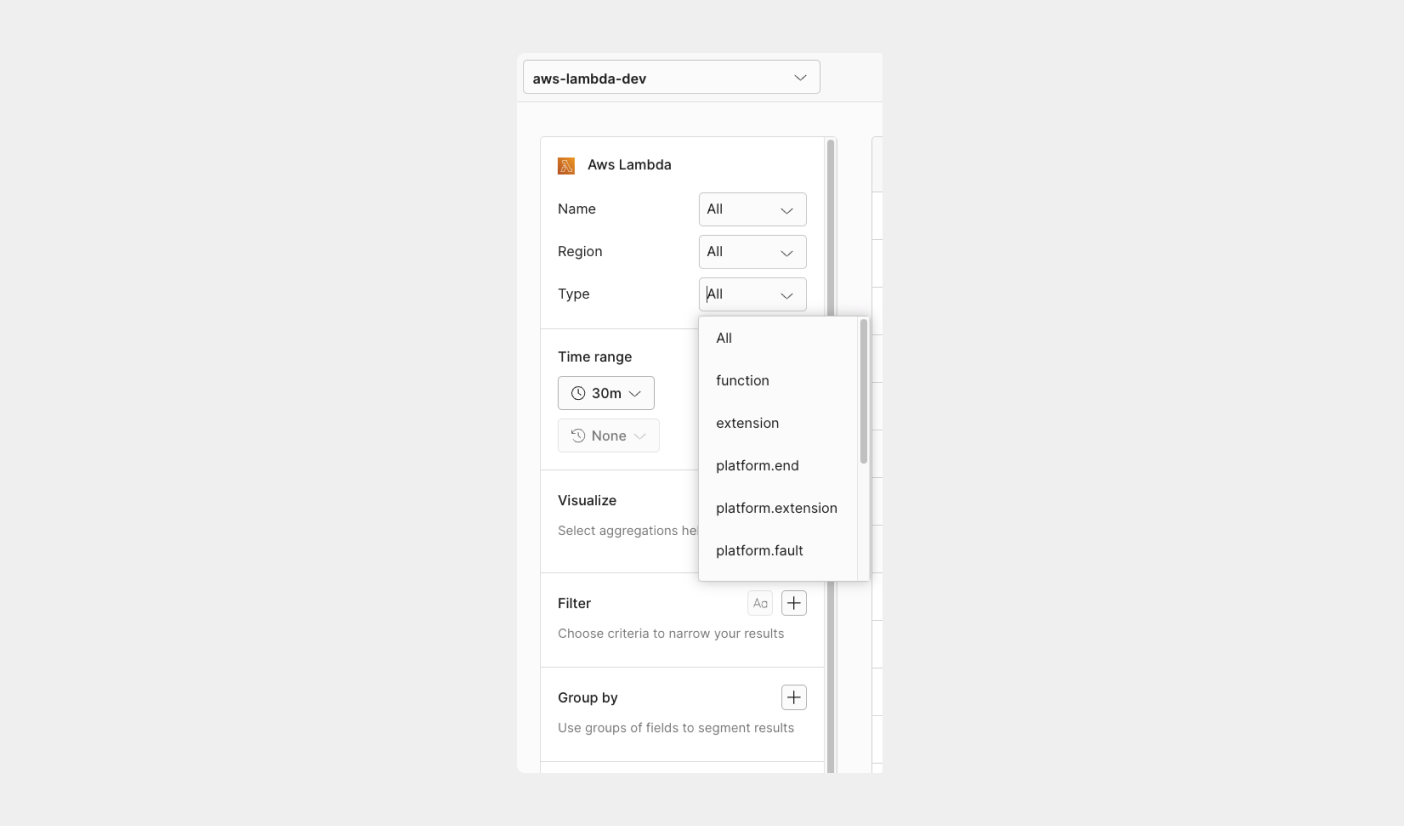
 ## Smart filters [#smart-filters]
Axiom Lambda Serverless Smart Filters lets you easily filter down to specific AWS Lambda functions or Serverless projects and use saved queries to get deep insights on how functions are performing with a single click.
## Smart filters [#smart-filters]
Axiom Lambda Serverless Smart Filters lets you easily filter down to specific AWS Lambda functions or Serverless projects and use saved queries to get deep insights on how functions are performing with a single click.
 ---
# Connect Axiom with Netlify
Source: https://axiom.co/docs/apps/netlify
Netlify is a platform for building and deploying highly performant websites, e-commerce stores, and web apps. Netlify automatically builds your site and deploys it across its global edge network.
Integrating Axiom with Netlify allows you to stream traffic, function, and deployment logs directly to Axiom, giving you comprehensive observability over your Netlify projects. With real-time, unsampled data, you can monitor site performance, detect errors quickly, and make informed decisions about your Jamstack apps.
The Netlify integration supports all [edge deployments](/reference/edge-deployments). The integration sends data to your organization's default edge deployment automatically.
---
# Connect Axiom with Netlify
Source: https://axiom.co/docs/apps/netlify
Netlify is a platform for building and deploying highly performant websites, e-commerce stores, and web apps. Netlify automatically builds your site and deploys it across its global edge network.
Integrating Axiom with Netlify allows you to stream traffic, function, and deployment logs directly to Axiom, giving you comprehensive observability over your Netlify projects. With real-time, unsampled data, you can monitor site performance, detect errors quickly, and make informed decisions about your Jamstack apps.
The Netlify integration supports all [edge deployments](/reference/edge-deployments). The integration sends data to your organization's default edge deployment automatically.
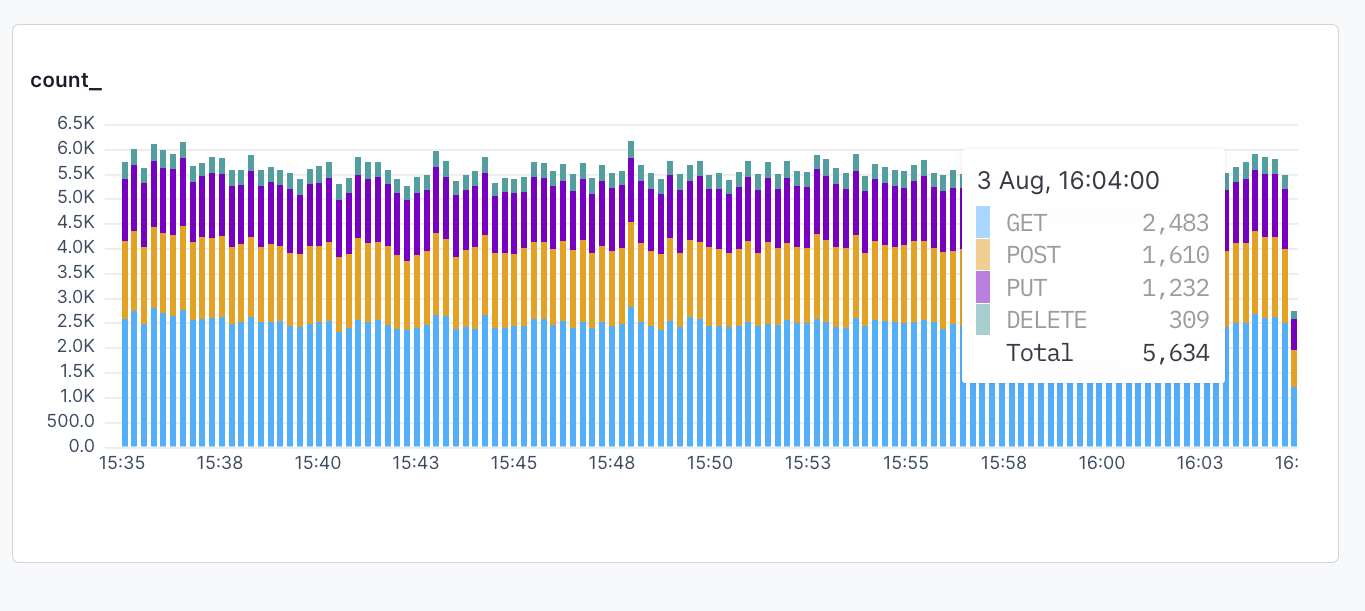
 **Bars:** A bar chart represents data in rectangular bars. The length of each bar is proportional to the value it represents. Bar charts can be used to compare discrete quantities, or when you have categorical data.
 **Line:** A line chart connects individual data points into a continuous line, which is useful for showing logs over time. Line charts are often used for time series data.
 ## Y-Axis [#y-axis]
Specify the scale of the vertical axis.
**Linear:** A linear scale maintains a consistent scale where equal distances represent equal changes in value. This is the most common scale type and is useful for most types of data.
## Y-Axis [#y-axis]
Specify the scale of the vertical axis.
**Linear:** A linear scale maintains a consistent scale where equal distances represent equal changes in value. This is the most common scale type and is useful for most types of data.
 **Log:** A logarithmic (or log) scale represents values in terms of their order of magnitude. Each unit of distance on a log scale represents a tenfold increase in value. Log scales make it easy to see backend errors and compare values across a wide range.
 ## Annotations [#annotations]
Specify the types of annotations to display in the chart:
* Show all annotations
* Hide all annotations
* Selective determine the annotations types to display
---
# Create dashboard elements
Source: https://axiom.co/docs/dashboard-elements/create
Dashboard elements are the different visual elements that you can include in your dashboard to display your data and other information. For example, you can track key metrics, logs, and traces, and monitor real-time data flow.
You can create the following dashboard elements:
* [Filter bar](/query-data/filters)
* [Gauge](/dashboard-elements/gauge)
* [Heatmap](/dashboard-elements/heatmap)
* [Log stream](/dashboard-elements/log-stream)
* [Monitor list](/dashboard-elements/monitor-list)
* [Note](/dashboard-elements/note)
* [Pie](/dashboard-elements/pie-chart)
* [Scatter](/dashboard-elements/scatter-plot)
* [Statistic](/dashboard-elements/statistic)
* [Table](/dashboard-elements/table)
* [Time series](/dashboard-elements/time-series)
* [Top list](/dashboard-elements/top-list)
* [Spacer](/dashboard-elements/spacer)
To organize related dashboard elements into collapsible groups, [create dashboard sections](/dashboards/sections).
## Create dashboard elements [#create-dashboard-elements]
1. [Create a dashboard](/dashboards/create) or open an existing dashboard.
2. Click **Edit dashboard**.
3. Click
## Annotations [#annotations]
Specify the types of annotations to display in the chart:
* Show all annotations
* Hide all annotations
* Selective determine the annotations types to display
---
# Create dashboard elements
Source: https://axiom.co/docs/dashboard-elements/create
Dashboard elements are the different visual elements that you can include in your dashboard to display your data and other information. For example, you can track key metrics, logs, and traces, and monitor real-time data flow.
You can create the following dashboard elements:
* [Filter bar](/query-data/filters)
* [Gauge](/dashboard-elements/gauge)
* [Heatmap](/dashboard-elements/heatmap)
* [Log stream](/dashboard-elements/log-stream)
* [Monitor list](/dashboard-elements/monitor-list)
* [Note](/dashboard-elements/note)
* [Pie](/dashboard-elements/pie-chart)
* [Scatter](/dashboard-elements/scatter-plot)
* [Statistic](/dashboard-elements/statistic)
* [Table](/dashboard-elements/table)
* [Time series](/dashboard-elements/time-series)
* [Top list](/dashboard-elements/top-list)
* [Spacer](/dashboard-elements/spacer)
To organize related dashboard elements into collapsible groups, [create dashboard sections](/dashboards/sections).
## Create dashboard elements [#create-dashboard-elements]
1. [Create a dashboard](/dashboards/create) or open an existing dashboard.
2. Click **Edit dashboard**.
3. Click 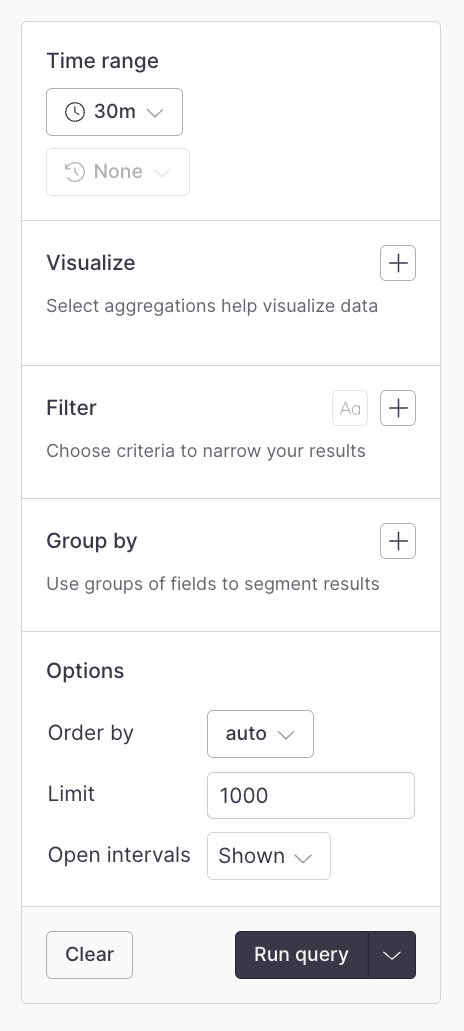 This component is a visual query builder that eases the process of building visualizations and segments of your data.
This guide walks you through the individual sections of the query builder.
### Time range [#time-range]
Every query has a start and end time and the time range component allows quick selection of common time ranges as well as the ability to input specific start and end timestamps:
This component is a visual query builder that eases the process of building visualizations and segments of your data.
This guide walks you through the individual sections of the query builder.
### Time range [#time-range]
Every query has a start and end time and the time range component allows quick selection of common time ranges as well as the ability to input specific start and end timestamps:
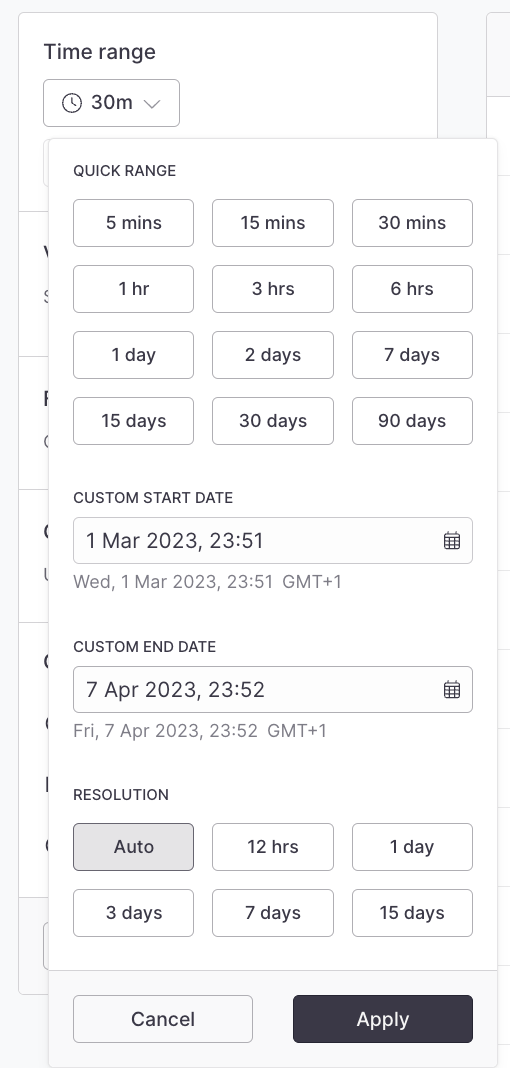 * Use the **Quick Range** items to quickly select popular ranges
* Use the **Custom Start/End Date** inputs to select specific times
* Use the **Resolution** items to choose between various time bucket resolutions
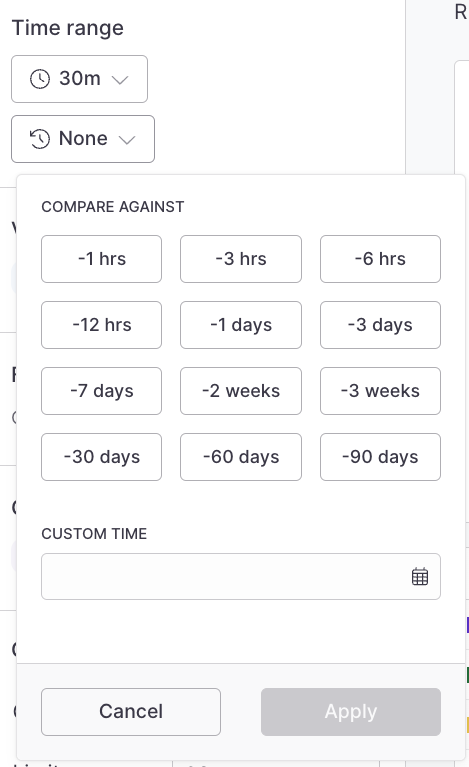
### Against [#against]
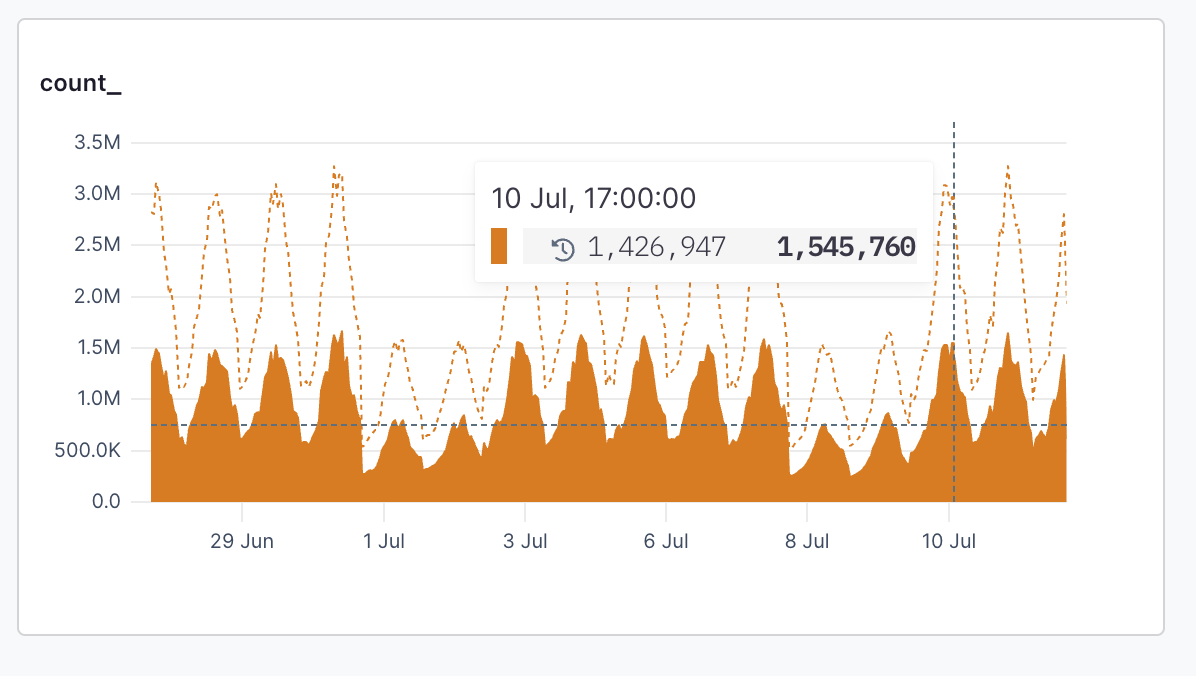
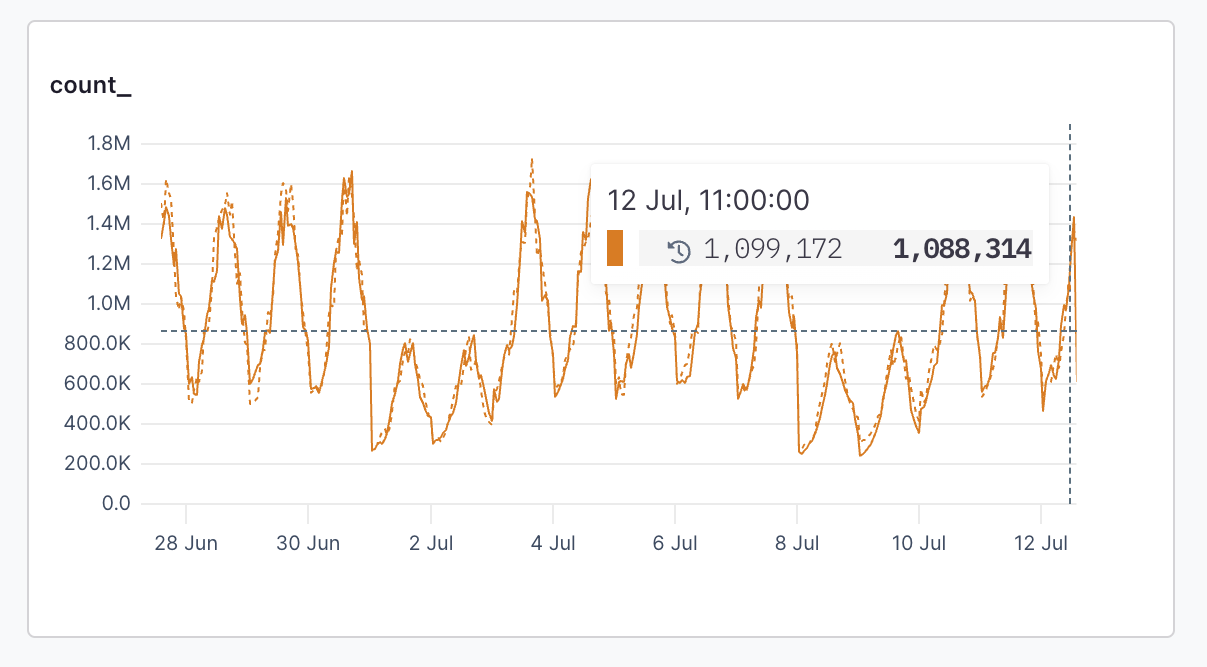
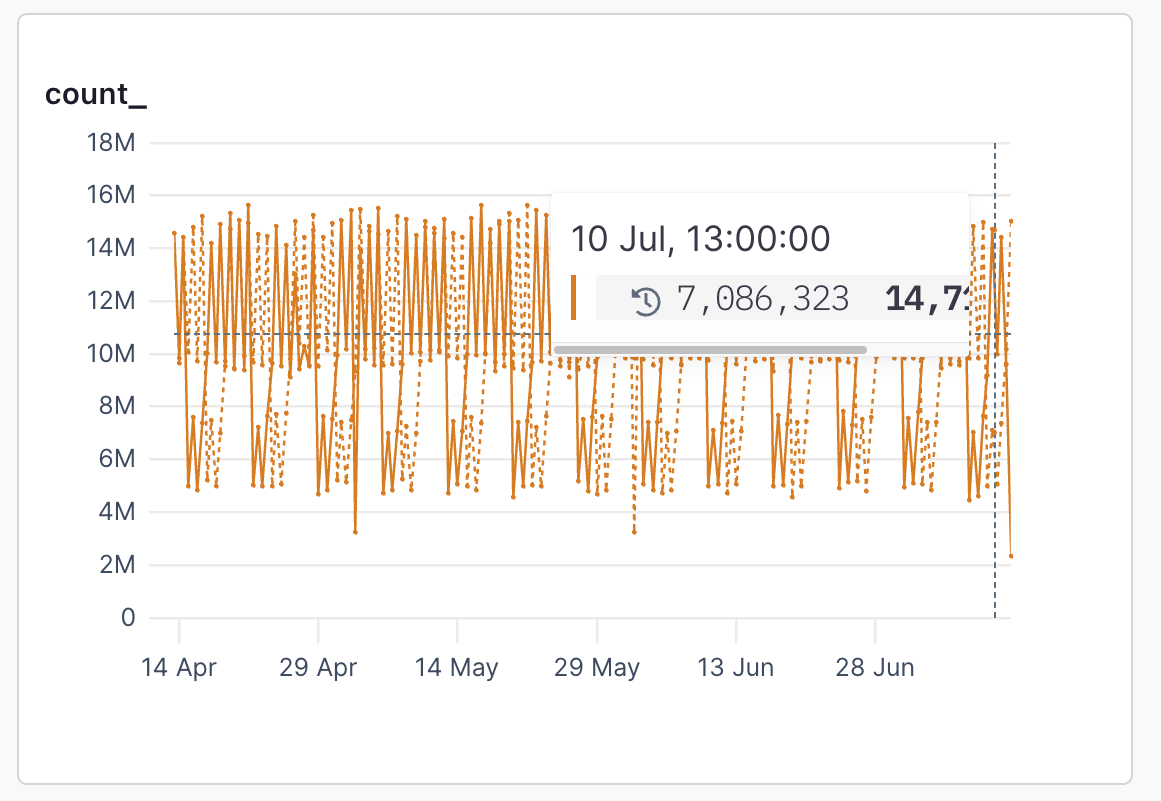
When a time series visualization is selected, such as `count`, the **Against** menu is enabled and it’s possible to select a historical time to compare the results of your time range too.
For example, to compare the last hour’s average response time to the same time yesterday, select `1 hr` in the time range menu, and then select `-1D` from the **Against** menu:
* Use the **Quick Range** items to quickly select popular ranges
* Use the **Custom Start/End Date** inputs to select specific times
* Use the **Resolution** items to choose between various time bucket resolutions
### Against [#against]
When a time series visualization is selected, such as `count`, the **Against** menu is enabled and it’s possible to select a historical time to compare the results of your time range too.
For example, to compare the last hour’s average response time to the same time yesterday, select `1 hr` in the time range menu, and then select `-1D` from the **Against** menu:
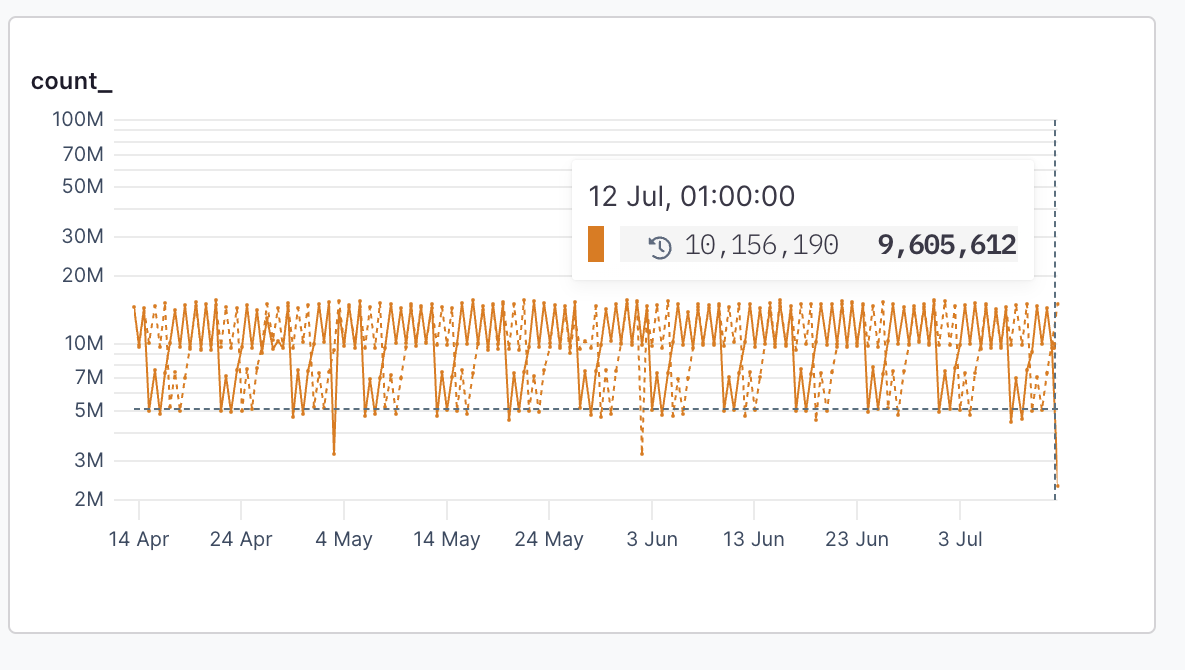
 The results look like this:
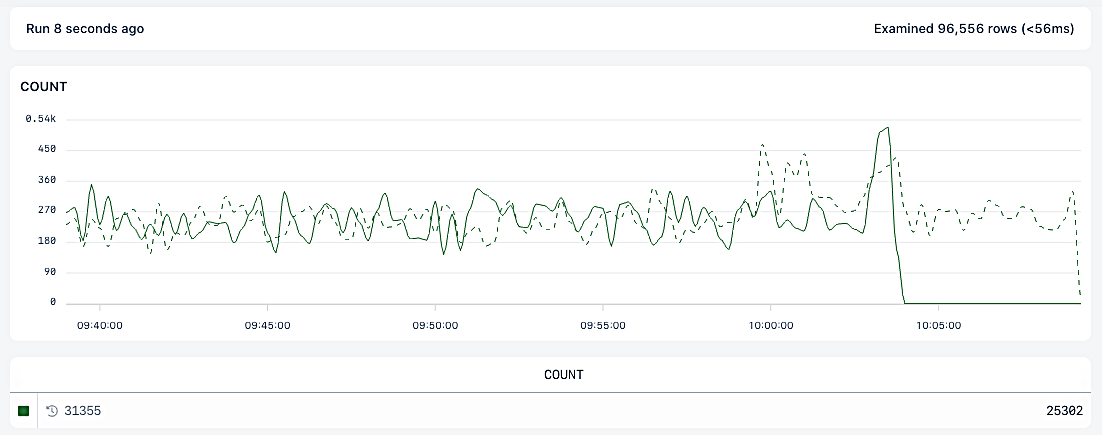 The dotted line represents results from the base date, and the totals table includes the comparative totals.
When you add `field` to the `group by` clause, the **time range against** values are attached to each `events`.
The dotted line represents results from the base date, and the totals table includes the comparative totals.
When you add `field` to the `group by` clause, the **time range against** values are attached to each `events`.
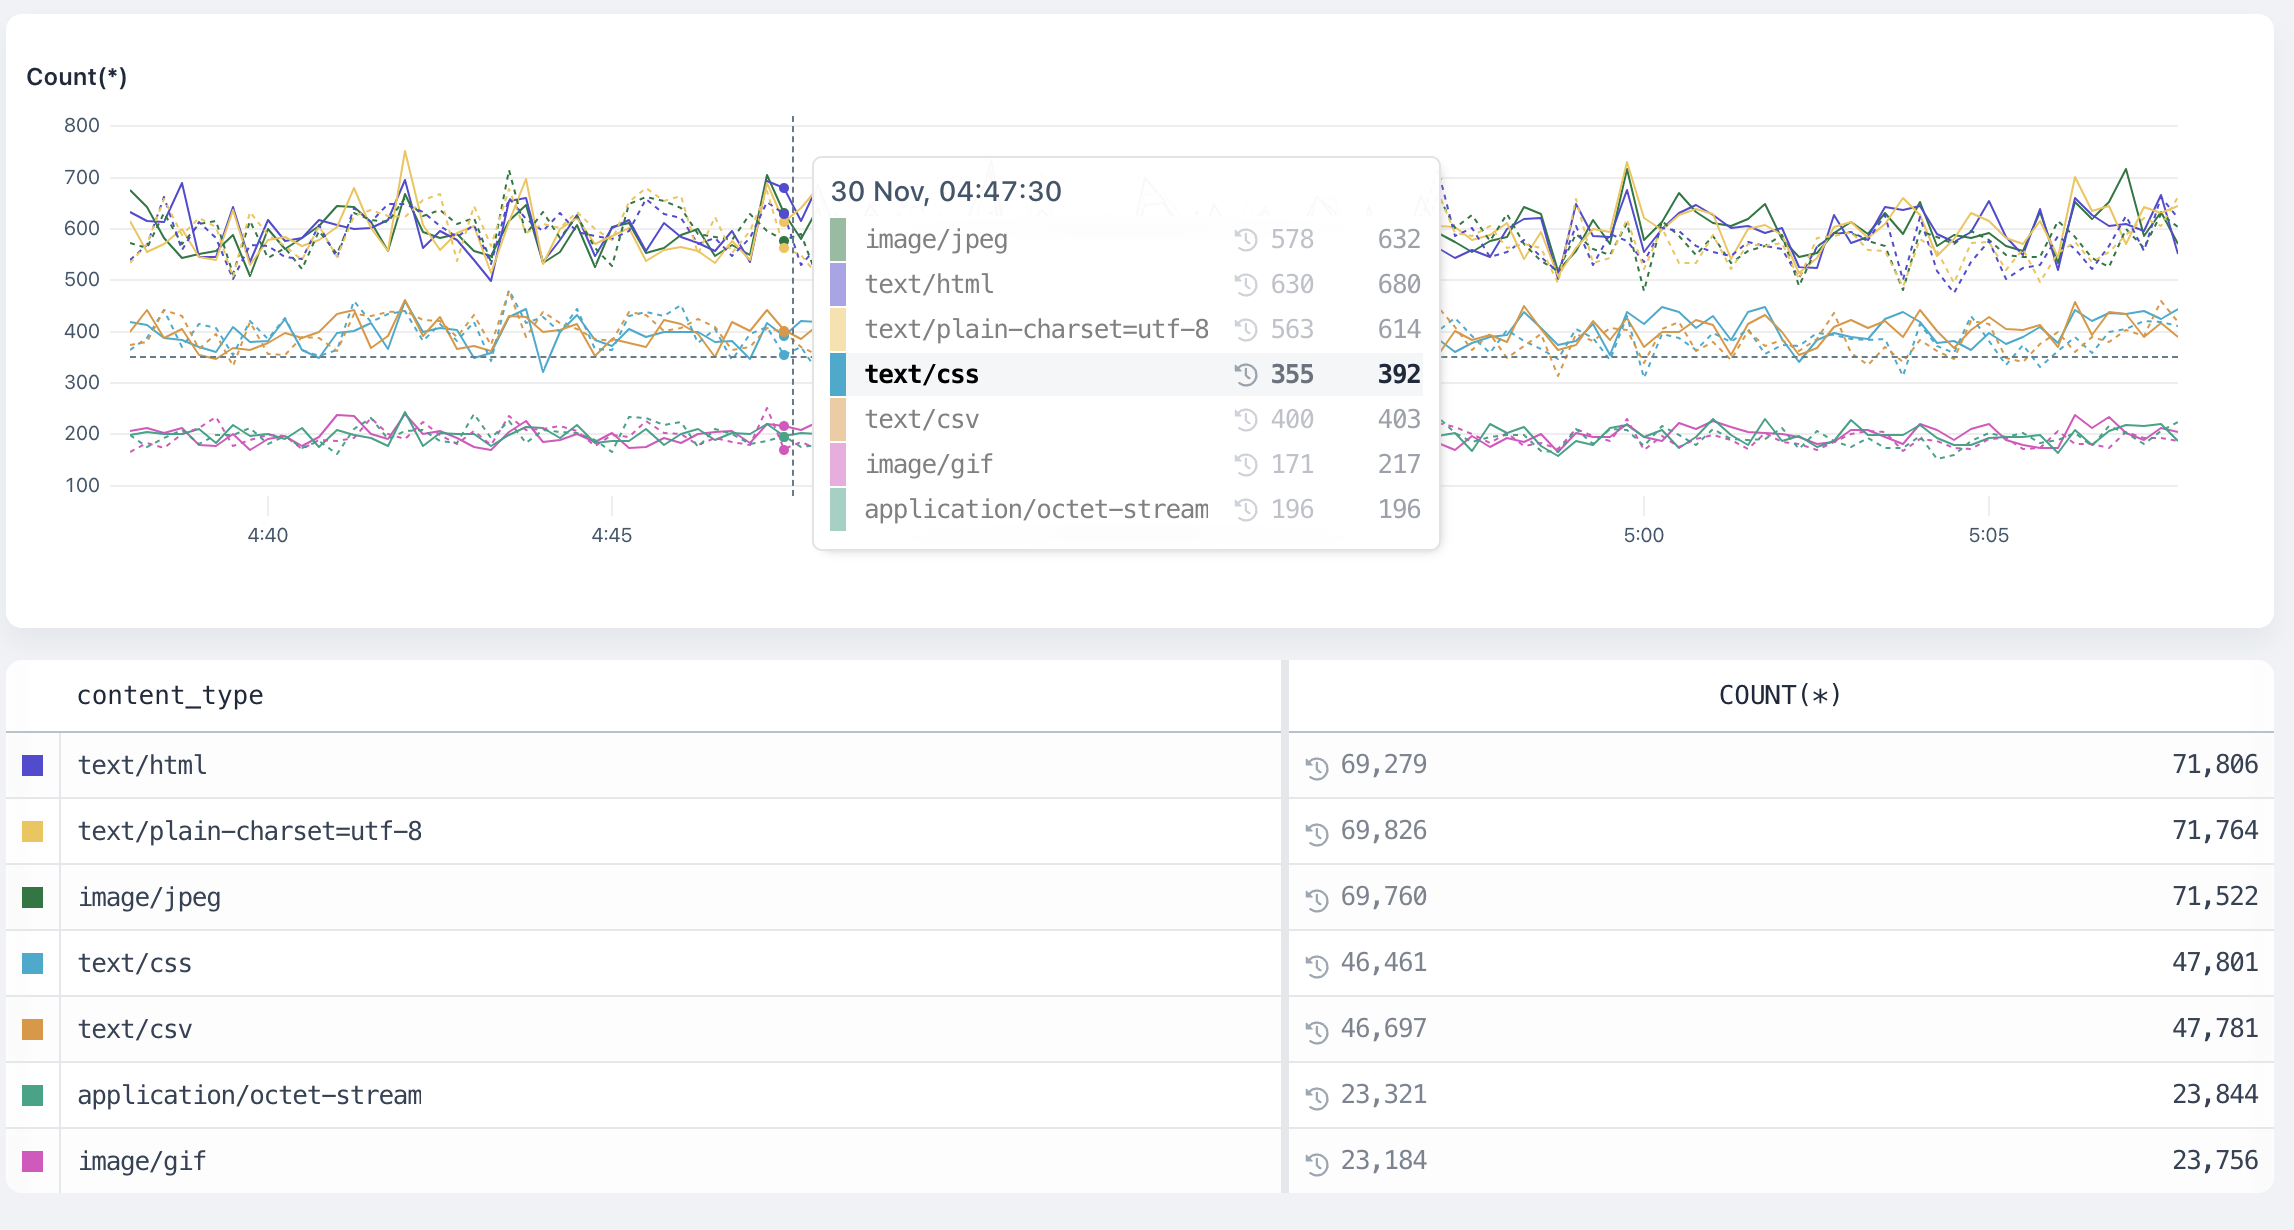 ### Visualizations [#visualizations]
Axiom provides powerful visualizations that display the output of running aggregate functions across your dataset. The Visualization menu allows you to add these visualizations and, where required, input their arguments:
### Visualizations [#visualizations]
Axiom provides powerful visualizations that display the output of running aggregate functions across your dataset. The Visualization menu allows you to add these visualizations and, where required, input their arguments:
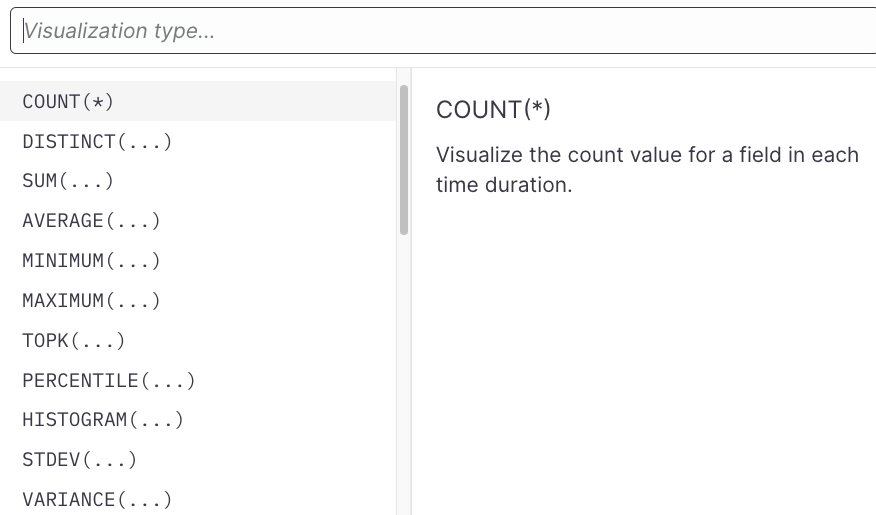 You can select a visualization to add it to the query. If a visualization requires an argument (such as the field and/or other parameters), the menu allows you to select eligible fields and input those arguments. Press Enter to complete the addition.
Click Visualization in the query builder to edit it at any time.
[Learn about supported visualizations](/query-data/visualizations)
### Filters [#filters]
Use the filter menu to attach filter clauses to your search.
Axiom supports AND/OR operators at the top-level as well as one level deep. This means you can create filters that would read as `status == 200 AND (method == get OR method == head) AND (user-agent contains Mozilla or user-agent contains Webkit)`.
Filters are divided up by the field type they operate on, but some may apply to more than one field type.
#### List of filters [#list-of-filters]
*String Fields*
* `==`
* `!=`
* `exists`
* `not-exists`
* `starts-with`
* `not-starts-with`
* `ends-with`
* `not-ends-with`
* `contains`
* `not-contains`
* `regexp`
* `not-regexp`
*Number Fields*
* `==`
* `!=`
* `exists`
* `not-exists`
* `>`
* `>=`
* `<`
* `<=`
*Boolean Fields*
* `==`
* `!=`
* `exists`
* `not-exists`
*Array Fields*
* `contains`
* `not-contains`
* `exists`
* `not-exists`
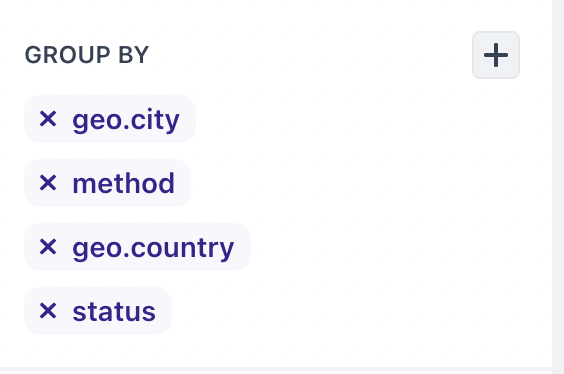
### Group by (segmentation) [#group-by-segmentation]
When visualizing data, it can be useful to segment data into specific groups to more clearly understand how the data behaves.
The Group By component enables you to add one or more fields to group events by:
You can select a visualization to add it to the query. If a visualization requires an argument (such as the field and/or other parameters), the menu allows you to select eligible fields and input those arguments. Press Enter to complete the addition.
Click Visualization in the query builder to edit it at any time.
[Learn about supported visualizations](/query-data/visualizations)
### Filters [#filters]
Use the filter menu to attach filter clauses to your search.
Axiom supports AND/OR operators at the top-level as well as one level deep. This means you can create filters that would read as `status == 200 AND (method == get OR method == head) AND (user-agent contains Mozilla or user-agent contains Webkit)`.
Filters are divided up by the field type they operate on, but some may apply to more than one field type.
#### List of filters [#list-of-filters]
*String Fields*
* `==`
* `!=`
* `exists`
* `not-exists`
* `starts-with`
* `not-starts-with`
* `ends-with`
* `not-ends-with`
* `contains`
* `not-contains`
* `regexp`
* `not-regexp`
*Number Fields*
* `==`
* `!=`
* `exists`
* `not-exists`
* `>`
* `>=`
* `<`
* `<=`
*Boolean Fields*
* `==`
* `!=`
* `exists`
* `not-exists`
*Array Fields*
* `contains`
* `not-contains`
* `exists`
* `not-exists`
### Group by (segmentation) [#group-by-segmentation]
When visualizing data, it can be useful to segment data into specific groups to more clearly understand how the data behaves.
The Group By component enables you to add one or more fields to group events by:
 ### Other options [#other-options]
#### Order [#order]
By default, Axiom automatically chooses the best ordering for results. However, you can manually set the desired order through this menu.
#### Limit [#limit]
By default, Axiom chooses a reasonable limit for the query that has been passed in. However, you can control that limit manually through this component.
## Change element’s position [#change-elements-position]
To change element’s position on the dashboard, drag the title bar of the chart.
## Change element size [#change-element-size]
To change the size of the element, drag the bottom-right corner.
## Set custom time range [#set-custom-time-range]
You can set a custom time range for individual dashboard elements that’s different from the dashboard’s time range. For example, the dashboard displays data about the last 30 minutes but individual dashboard elements display data for different time ranges. This can be useful for visualizing the same chart or statistic for different time periods, among others.
To set a custom time range for a dashboard element:
1. In the top right of the dashboard element, click
### Other options [#other-options]
#### Order [#order]
By default, Axiom automatically chooses the best ordering for results. However, you can manually set the desired order through this menu.
#### Limit [#limit]
By default, Axiom chooses a reasonable limit for the query that has been passed in. However, you can control that limit manually through this component.
## Change element’s position [#change-elements-position]
To change element’s position on the dashboard, drag the title bar of the chart.
## Change element size [#change-element-size]
To change the size of the element, drag the bottom-right corner.
## Set custom time range [#set-custom-time-range]
You can set a custom time range for individual dashboard elements that’s different from the dashboard’s time range. For example, the dashboard displays data about the last 30 minutes but individual dashboard elements display data for different time ranges. This can be useful for visualizing the same chart or statistic for different time periods, among others.
To set a custom time range for a dashboard element:
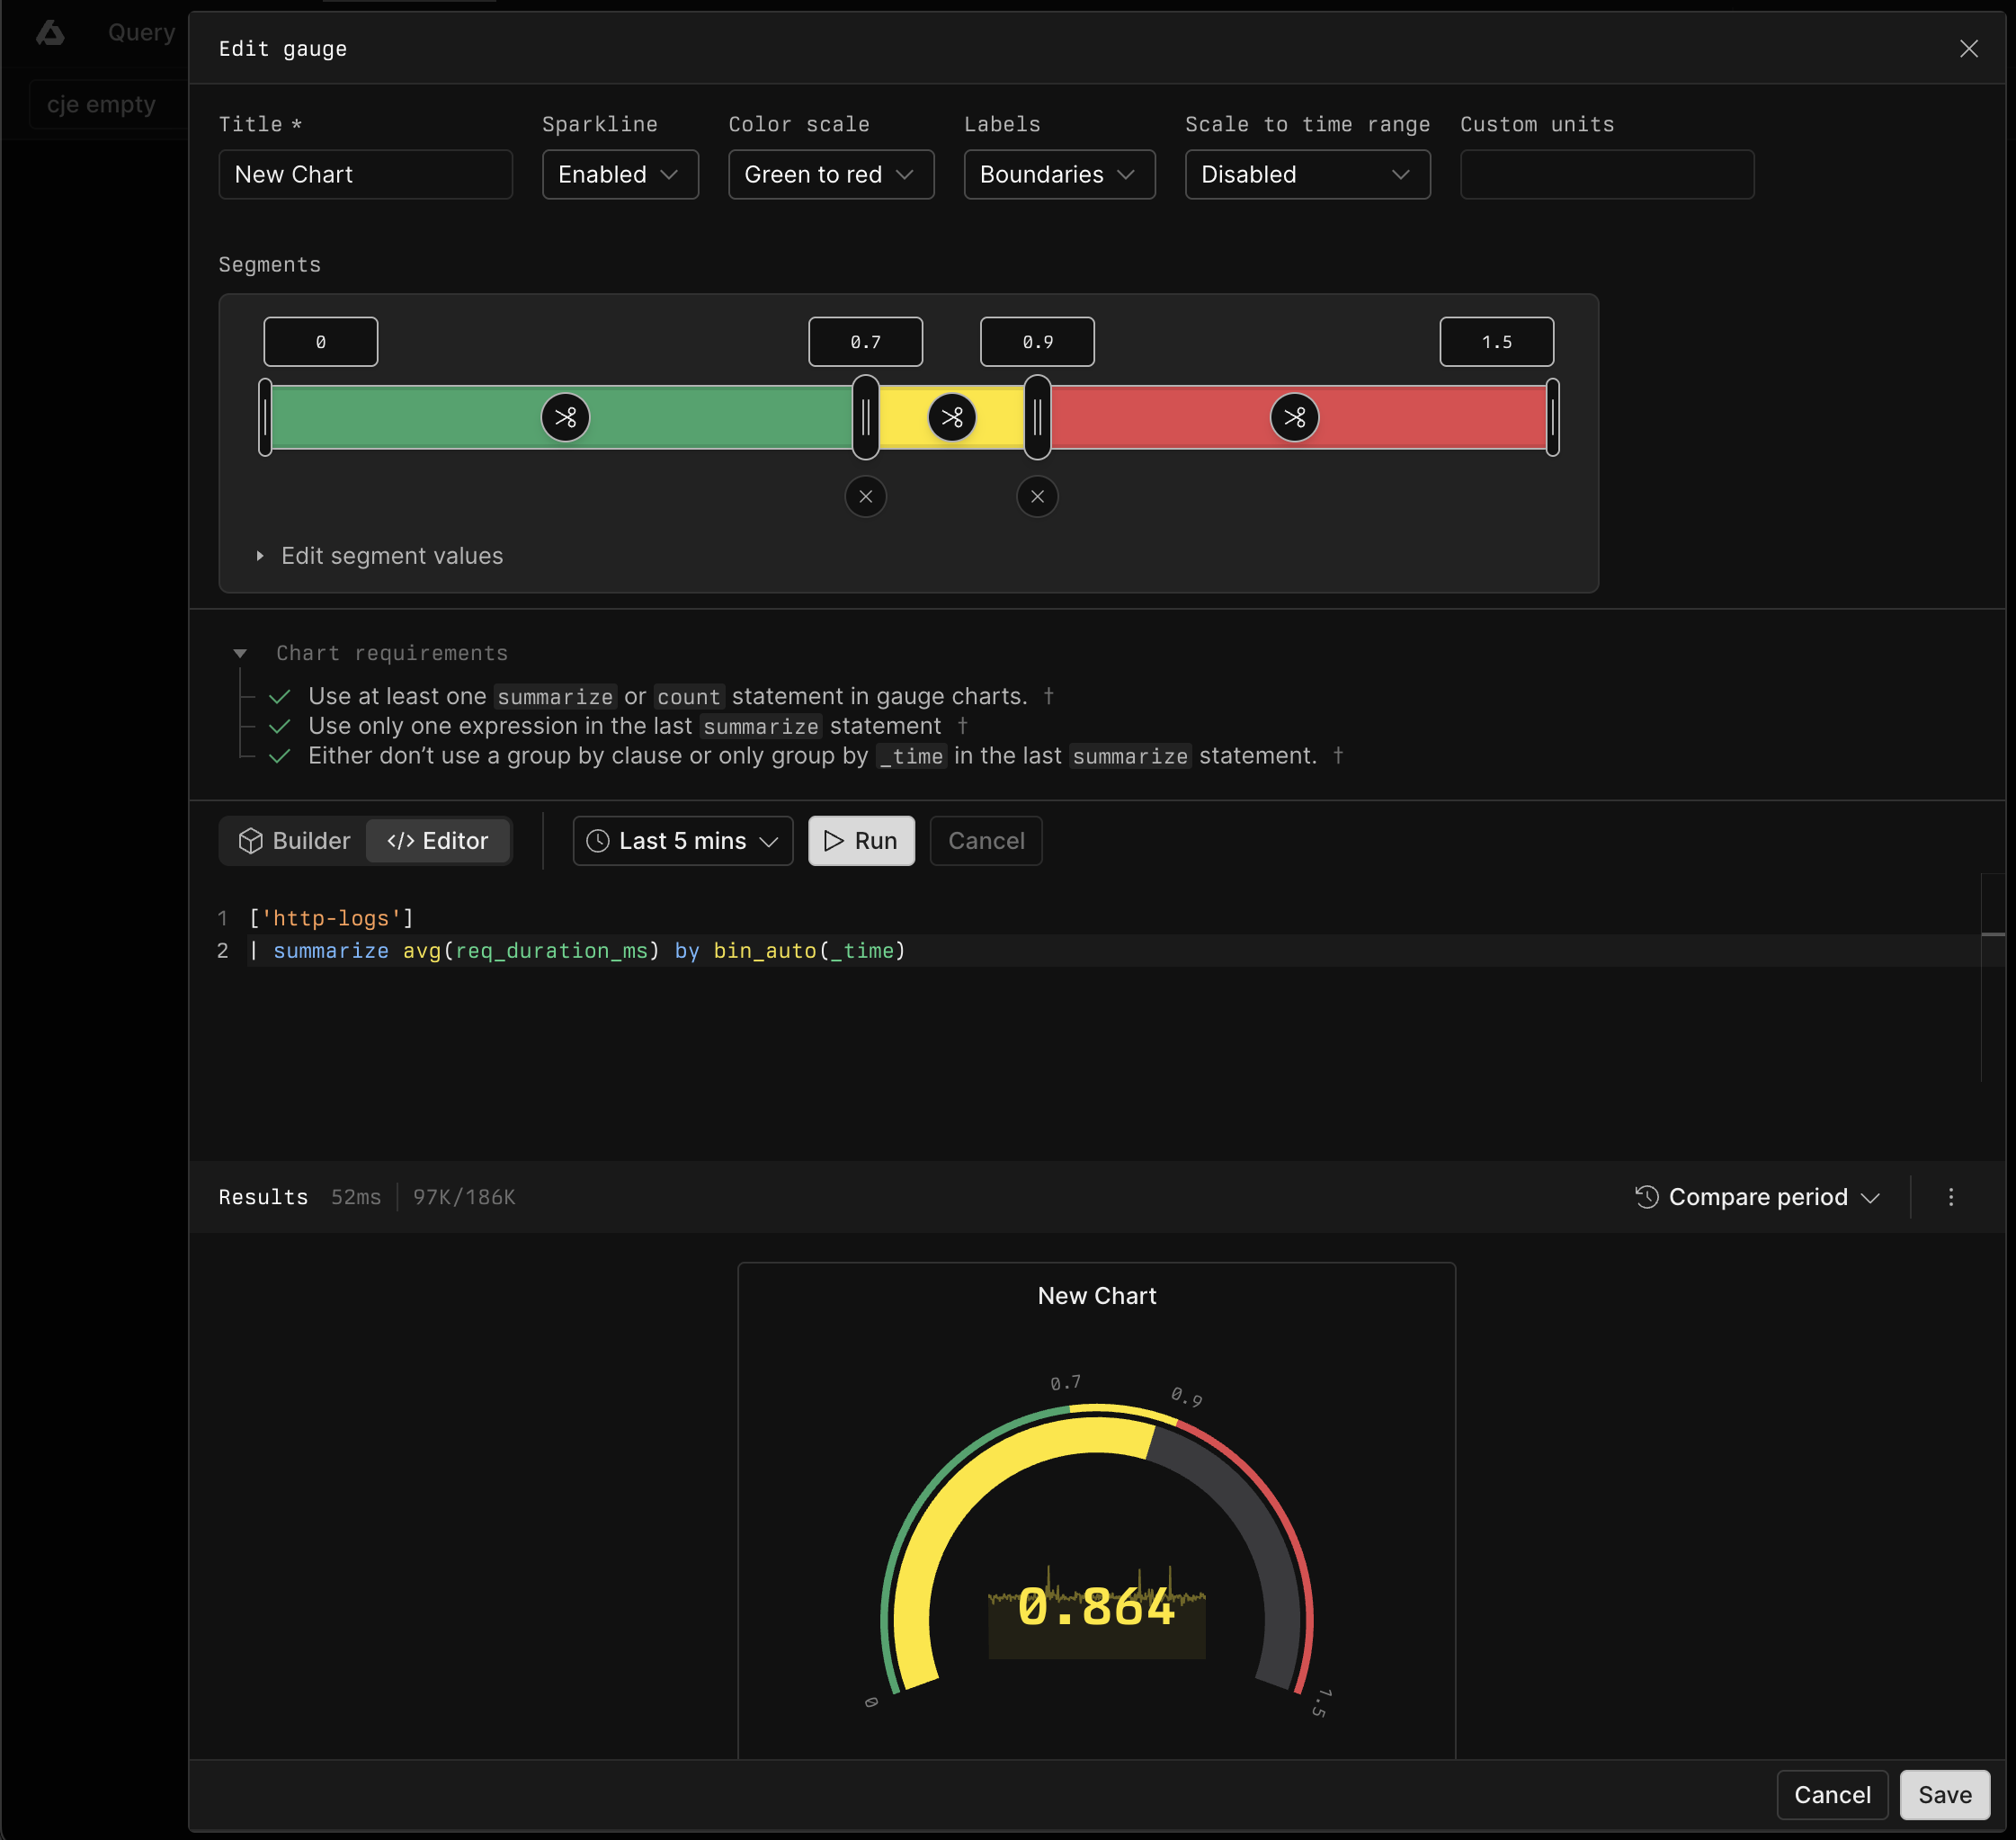
1. In the top right of the dashboard element, click 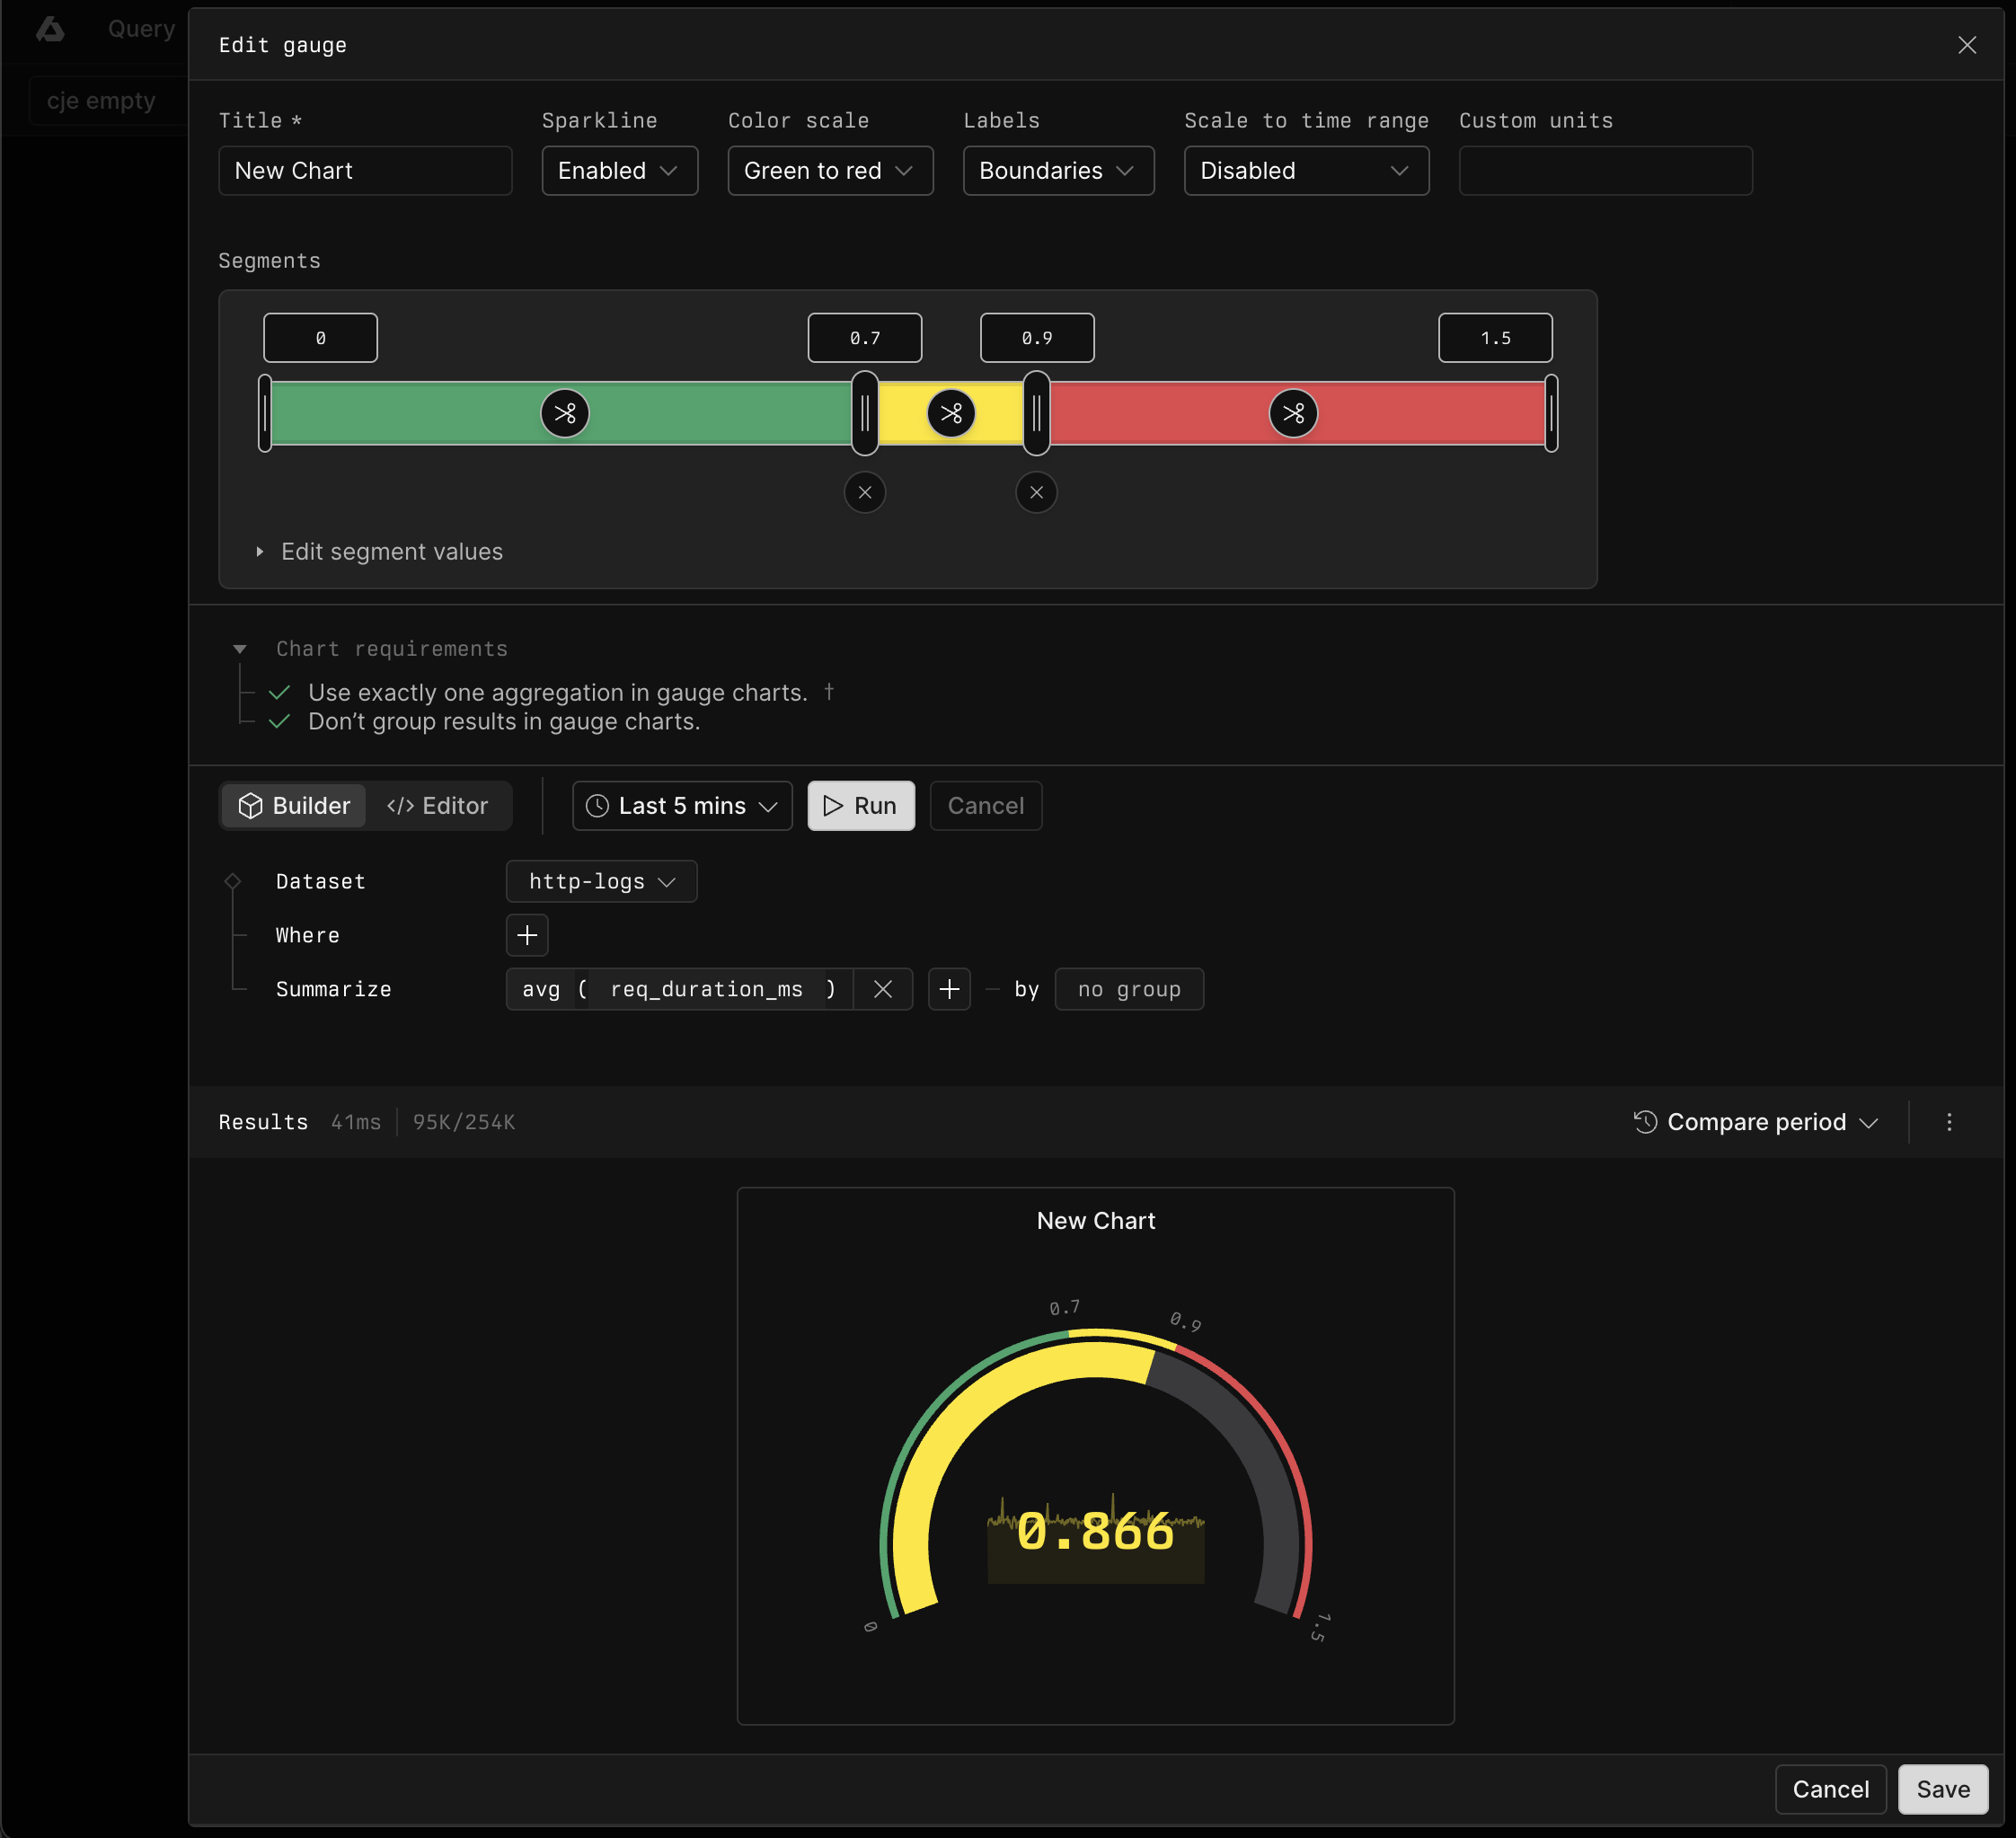 ## Example with APL [#example-with-apl]
```kusto
['sample-http-logs']
| summarize avg(req_duration_ms) by bin_auto(_time)
```
## Example with APL [#example-with-apl]
```kusto
['sample-http-logs']
| summarize avg(req_duration_ms) by bin_auto(_time)
```
 ---
# Heatmap
Source: https://axiom.co/docs/dashboard-elements/heatmap
Heatmaps represent the distribution of numerical data by grouping values into ranges or buckets. Each bucket reflects a frequency count of data points that fall within its range. Instead of showing individual events or measurements, heatmaps give a clear view of the overall distribution patterns. This allows you to identify performance bottlenecks, outliers, or shifts in behavior. For instance, you can use heatmaps to track response times, latency, or error rates.
---
# Heatmap
Source: https://axiom.co/docs/dashboard-elements/heatmap
Heatmaps represent the distribution of numerical data by grouping values into ranges or buckets. Each bucket reflects a frequency count of data points that fall within its range. Instead of showing individual events or measurements, heatmaps give a clear view of the overall distribution patterns. This allows you to identify performance bottlenecks, outliers, or shifts in behavior. For instance, you can use heatmaps to track response times, latency, or error rates.
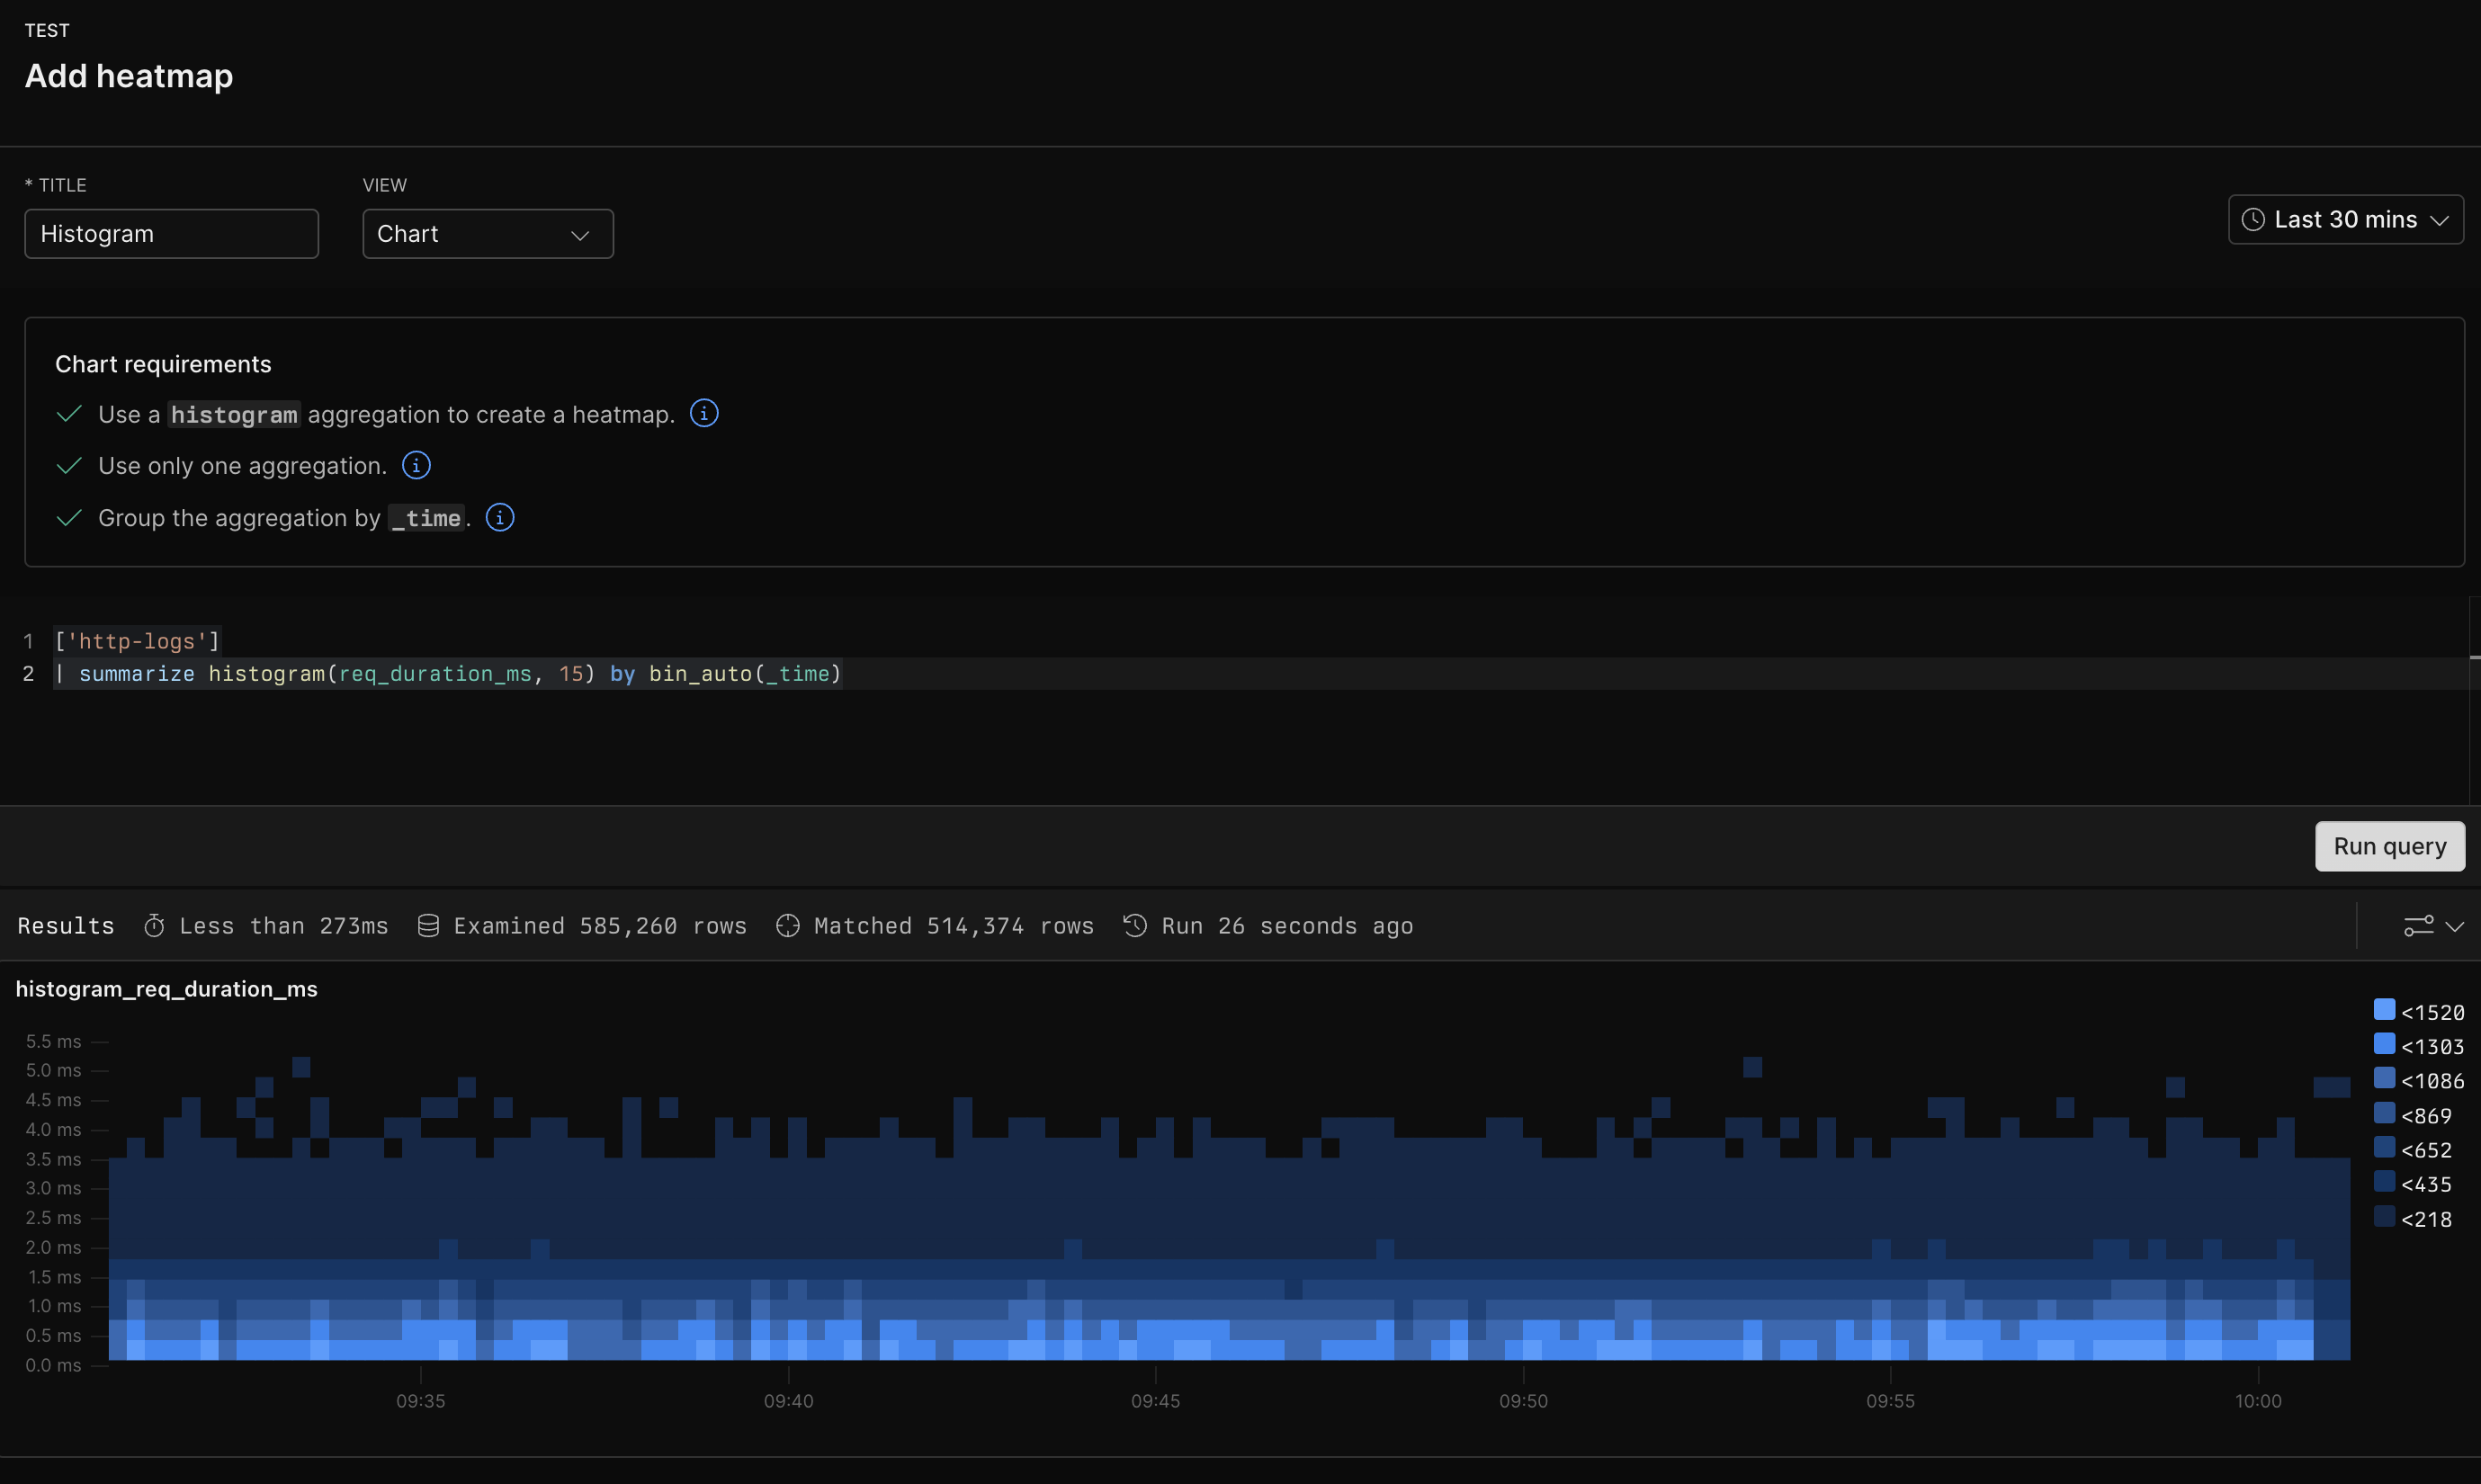
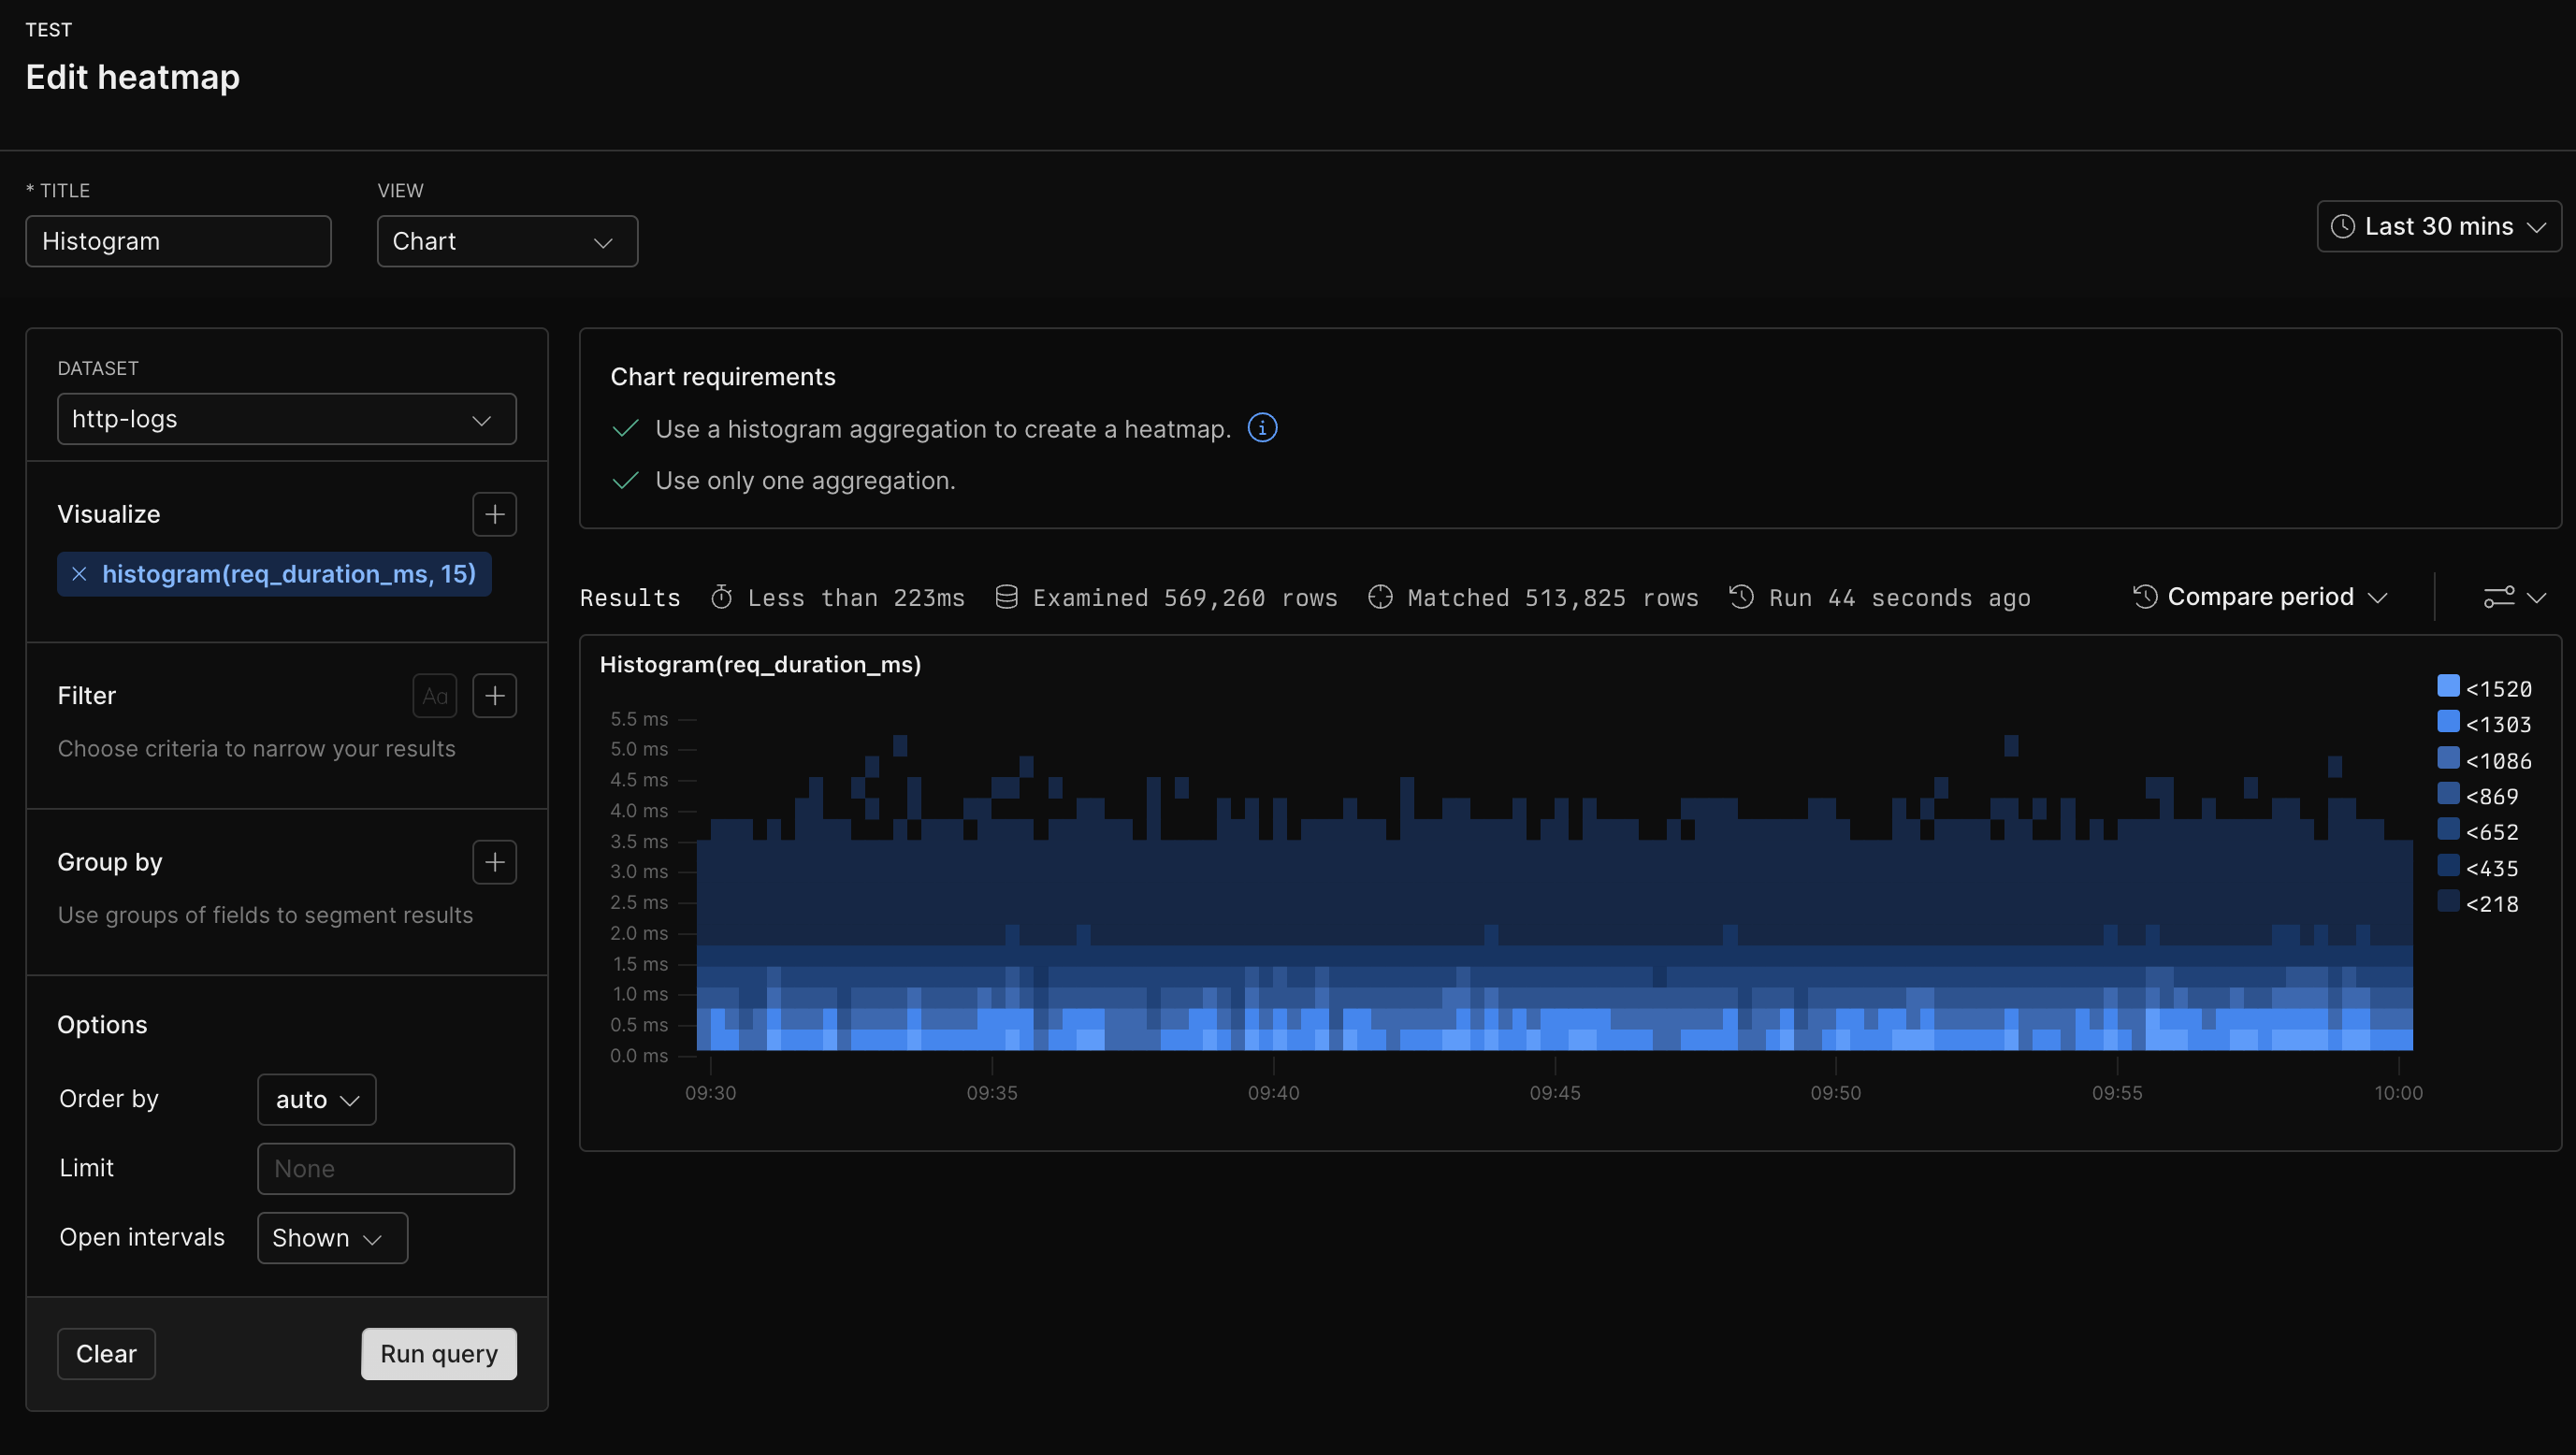 ## Example with APL [#example-with-apl]
```kusto
['sample-http-logs']
| summarize histogram(req_duration_ms, 15) by bin_auto(_time)
```
## Example with APL [#example-with-apl]
```kusto
['sample-http-logs']
| summarize histogram(req_duration_ms, 15) by bin_auto(_time)
```
 ---
# Log stream
Source: https://axiom.co/docs/dashboard-elements/log-stream
The log stream dashboard element displays your logs as they come in real-time. Each log appears as a separate line with various details. The benefit of a log stream is that it provides immediate visibility into your system’s operations. When you debug an issue or trying to understand an ongoing event, the log stream allows you to see exactly what’s happening as it occurs.
---
# Log stream
Source: https://axiom.co/docs/dashboard-elements/log-stream
The log stream dashboard element displays your logs as they come in real-time. Each log appears as a separate line with various details. The benefit of a log stream is that it provides immediate visibility into your system’s operations. When you debug an issue or trying to understand an ongoing event, the log stream allows you to see exactly what’s happening as it occurs.
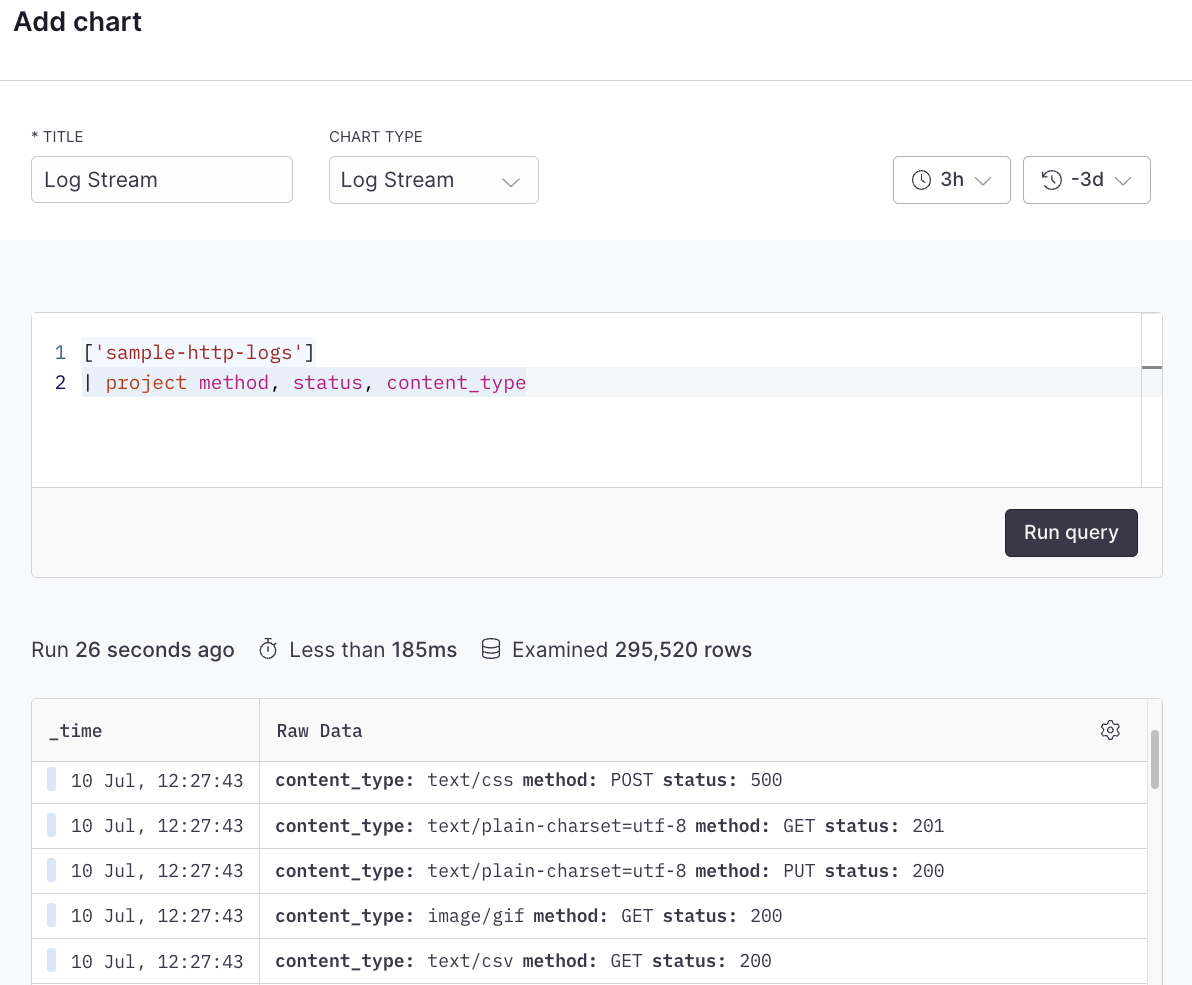
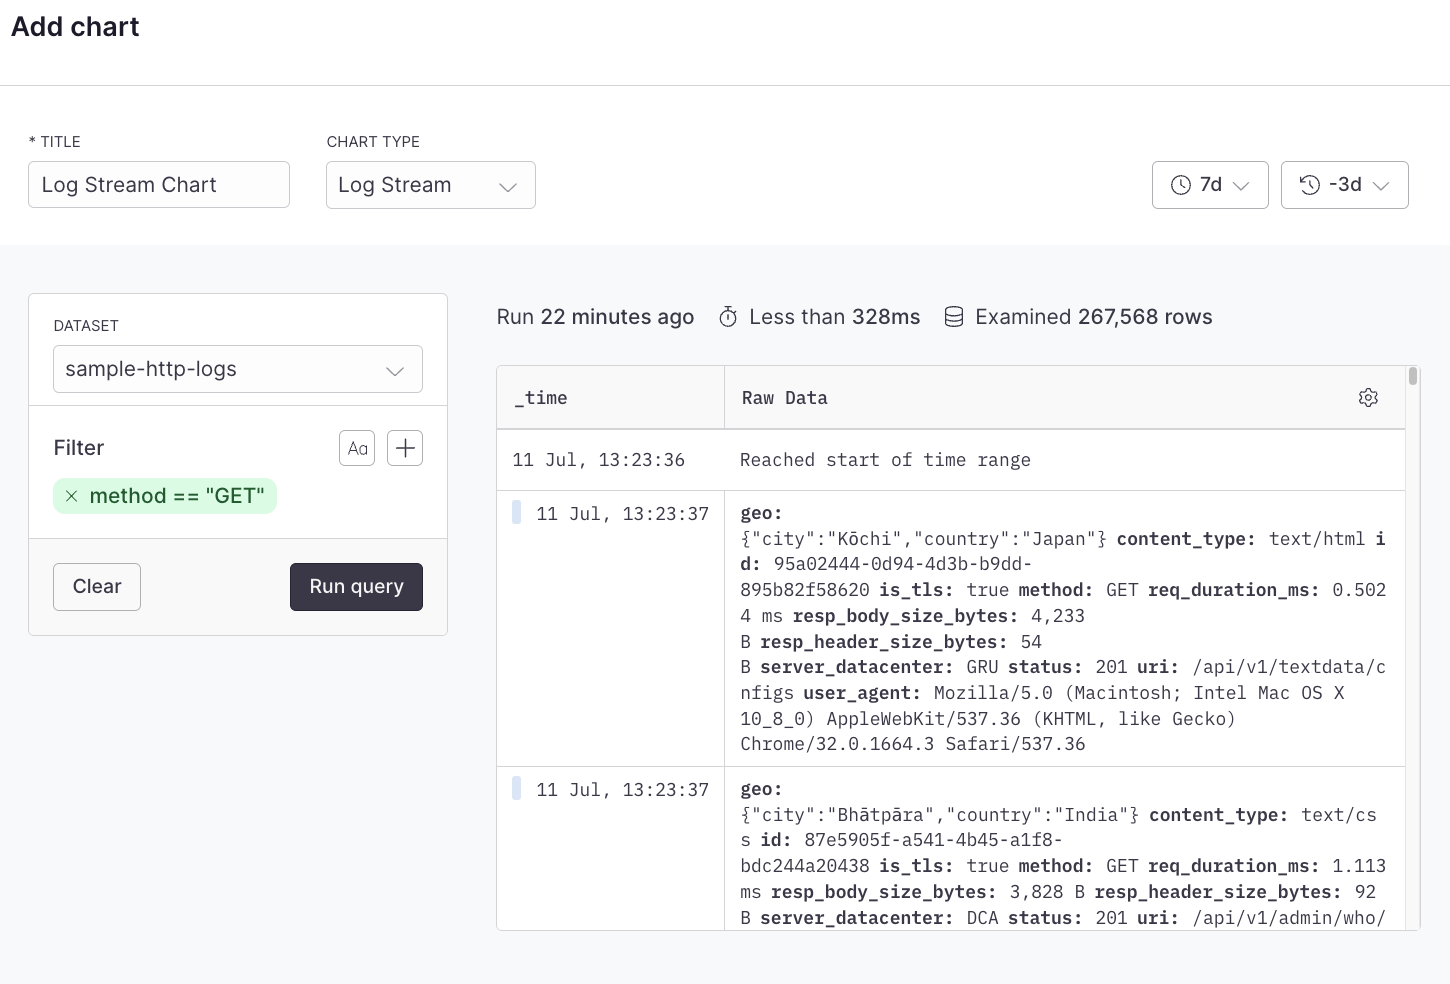 ## Example with APL [#example-with-apl]
```kusto
['sample-http-logs']
| project method, status, content_type
```
## Example with APL [#example-with-apl]
```kusto
['sample-http-logs']
| project method, status, content_type
```
 ---
# Monitor list
Source: https://axiom.co/docs/dashboard-elements/monitor-list
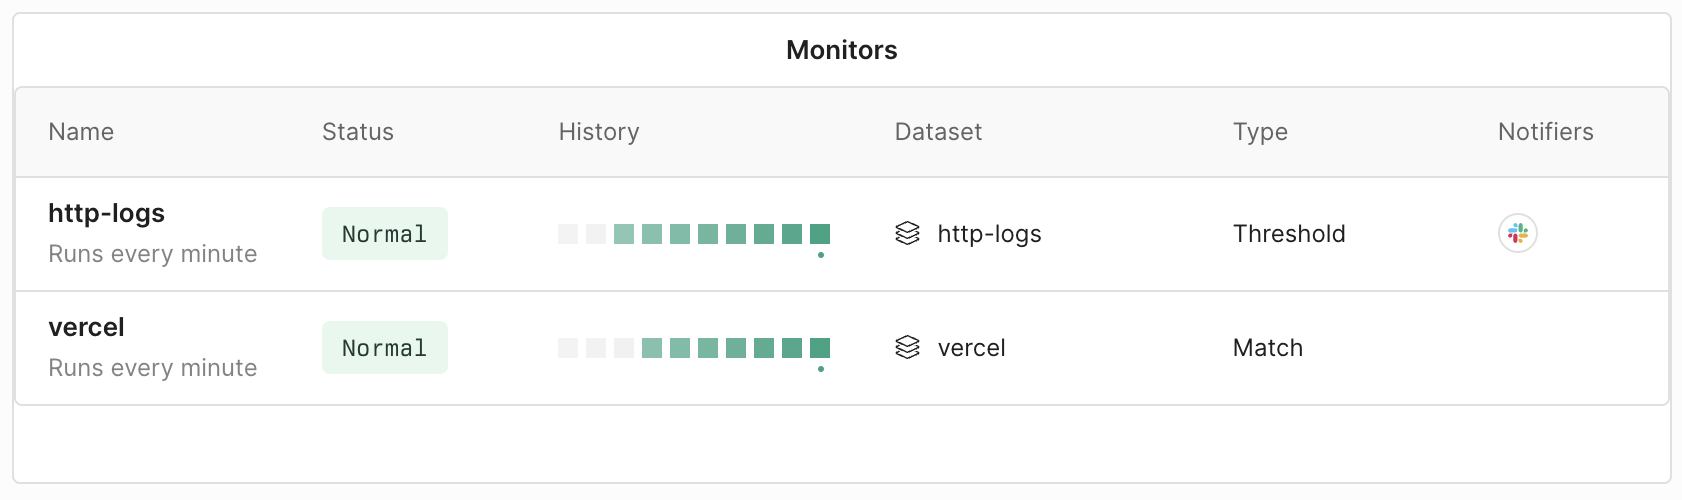
The monitor list dashboard element provides a visual overview of the monitors you specify. It offers a quick glance into important developments about the monitors such as their status and history.
---
# Monitor list
Source: https://axiom.co/docs/dashboard-elements/monitor-list
The monitor list dashboard element provides a visual overview of the monitors you specify. It offers a quick glance into important developments about the monitors such as their status and history.
 ---
# Note
Source: https://axiom.co/docs/dashboard-elements/note
The note dashboard element adds a textbox to your dashboard that you can customise to your needs. For example, you can provide context in a note about the other dashboard elements.
---
# Note
Source: https://axiom.co/docs/dashboard-elements/note
The note dashboard element adds a textbox to your dashboard that you can customise to your needs. For example, you can provide context in a note about the other dashboard elements.
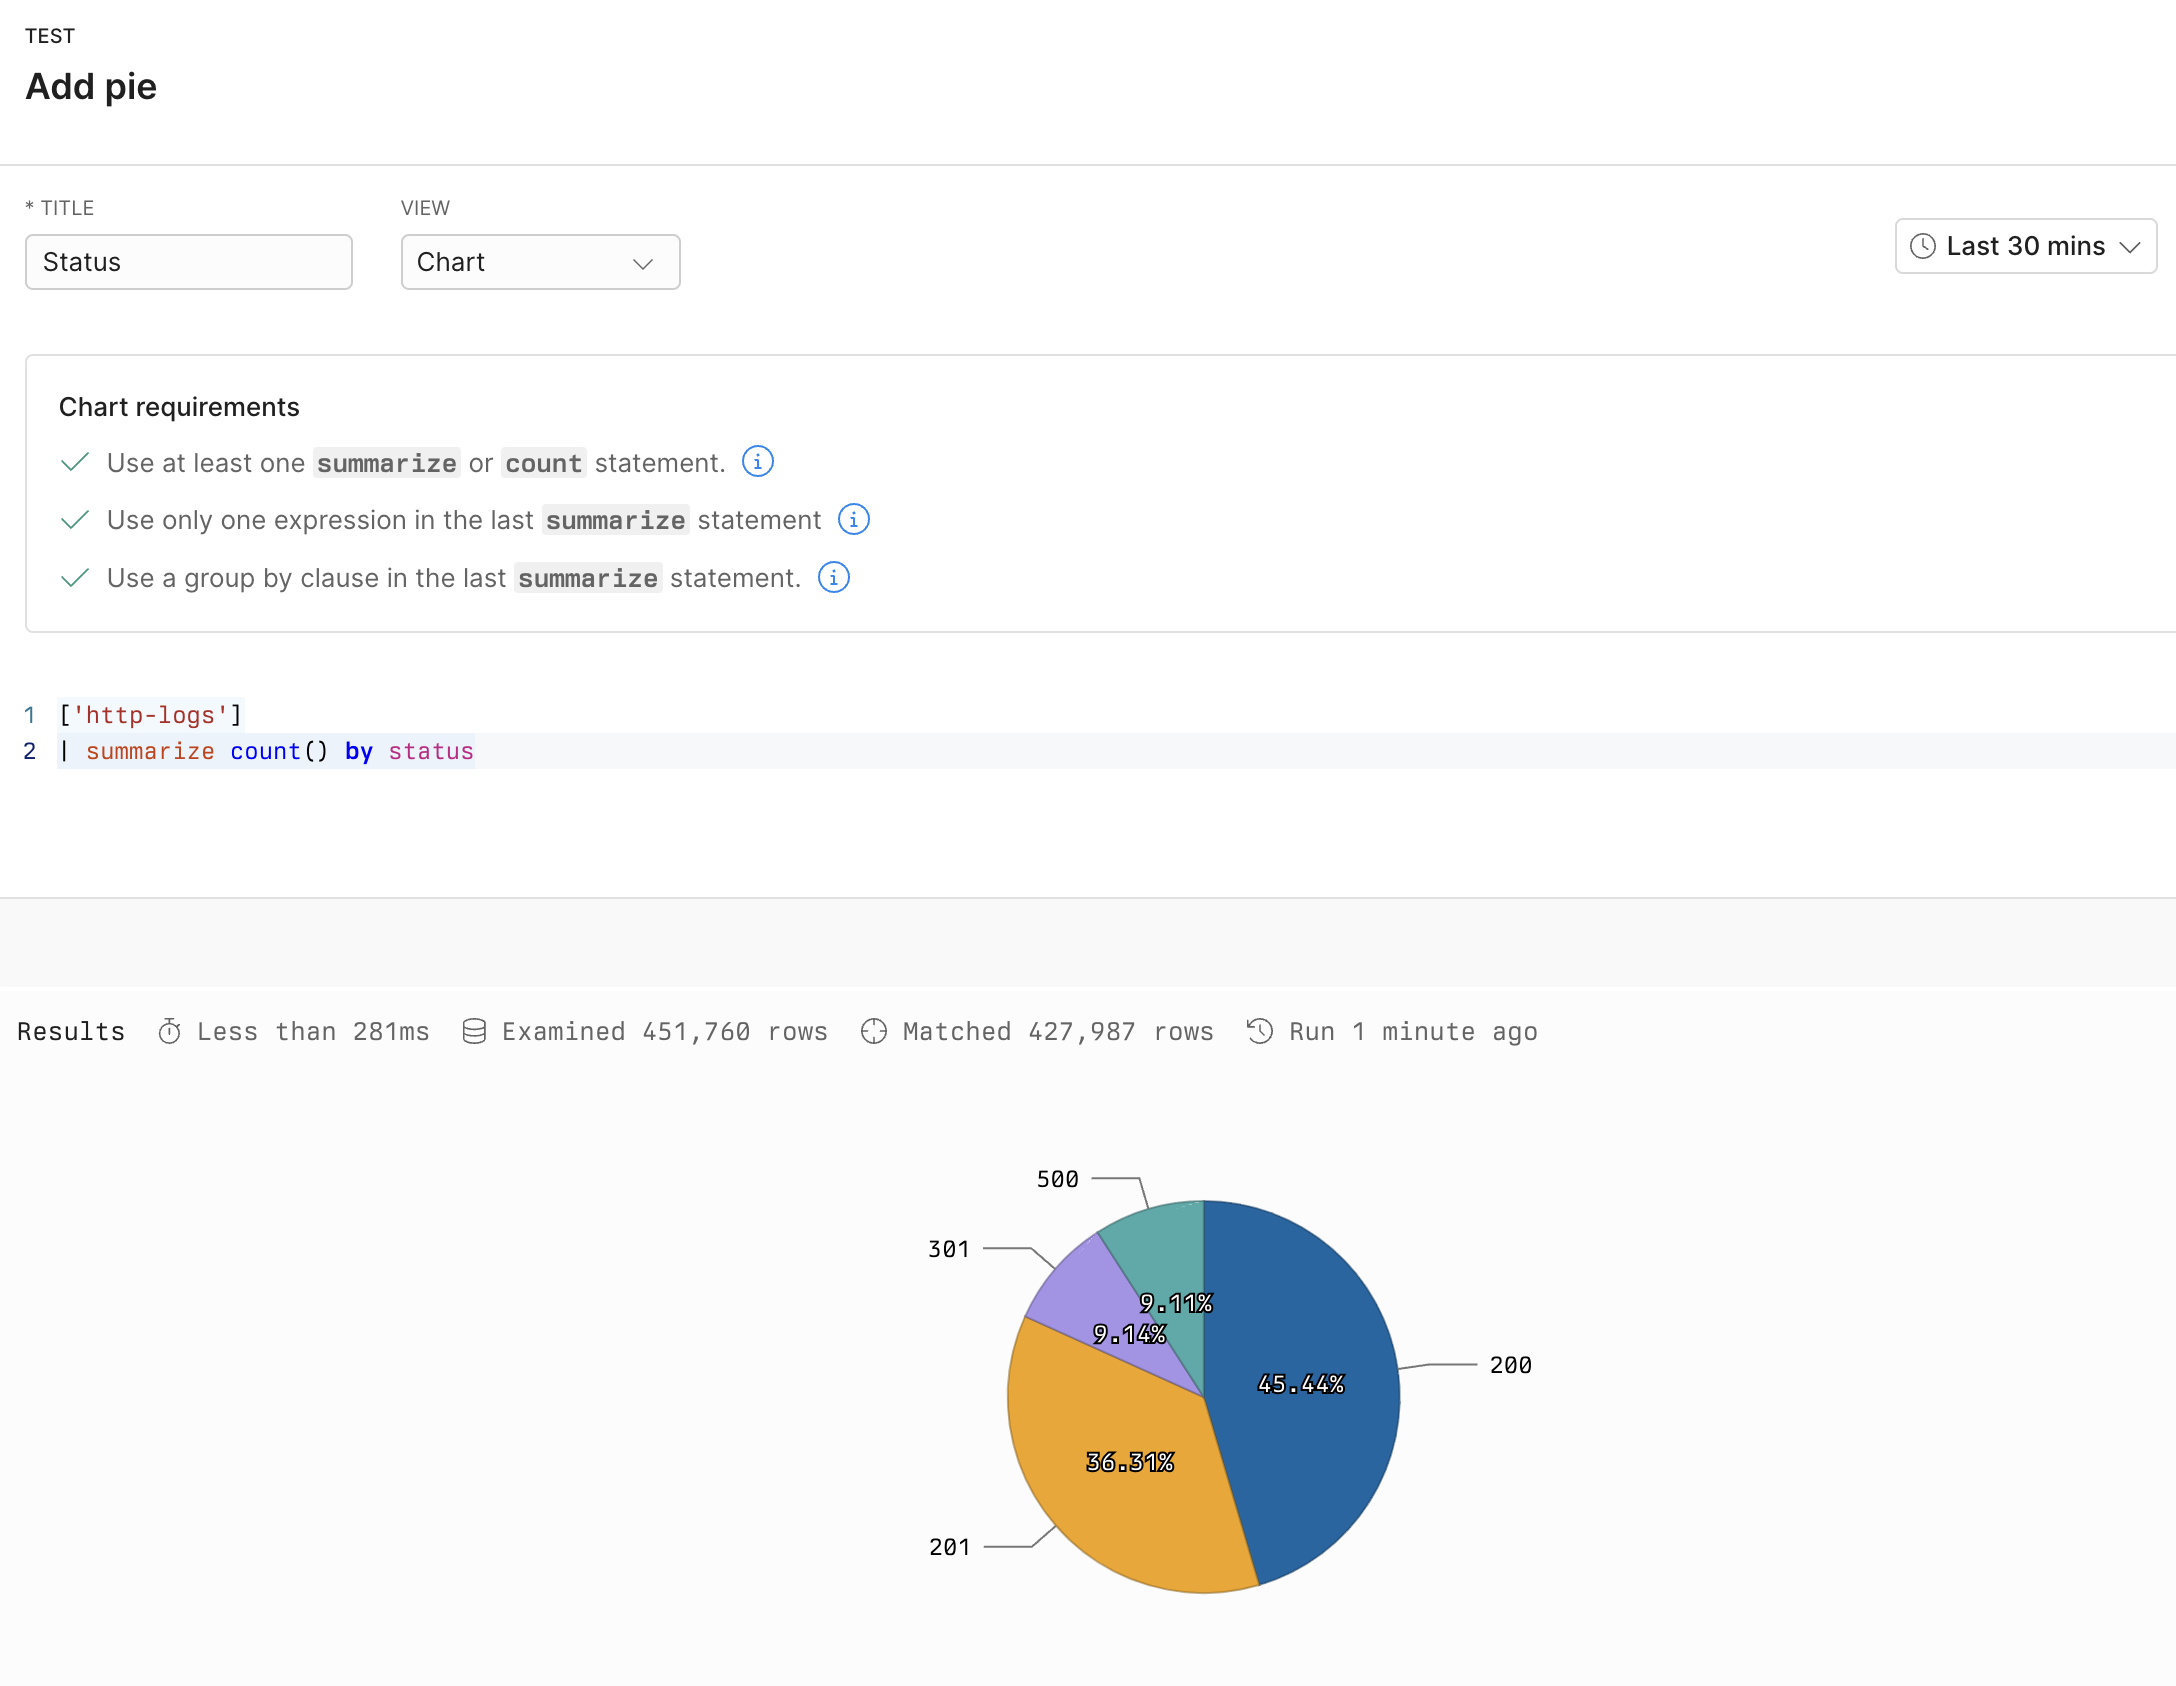
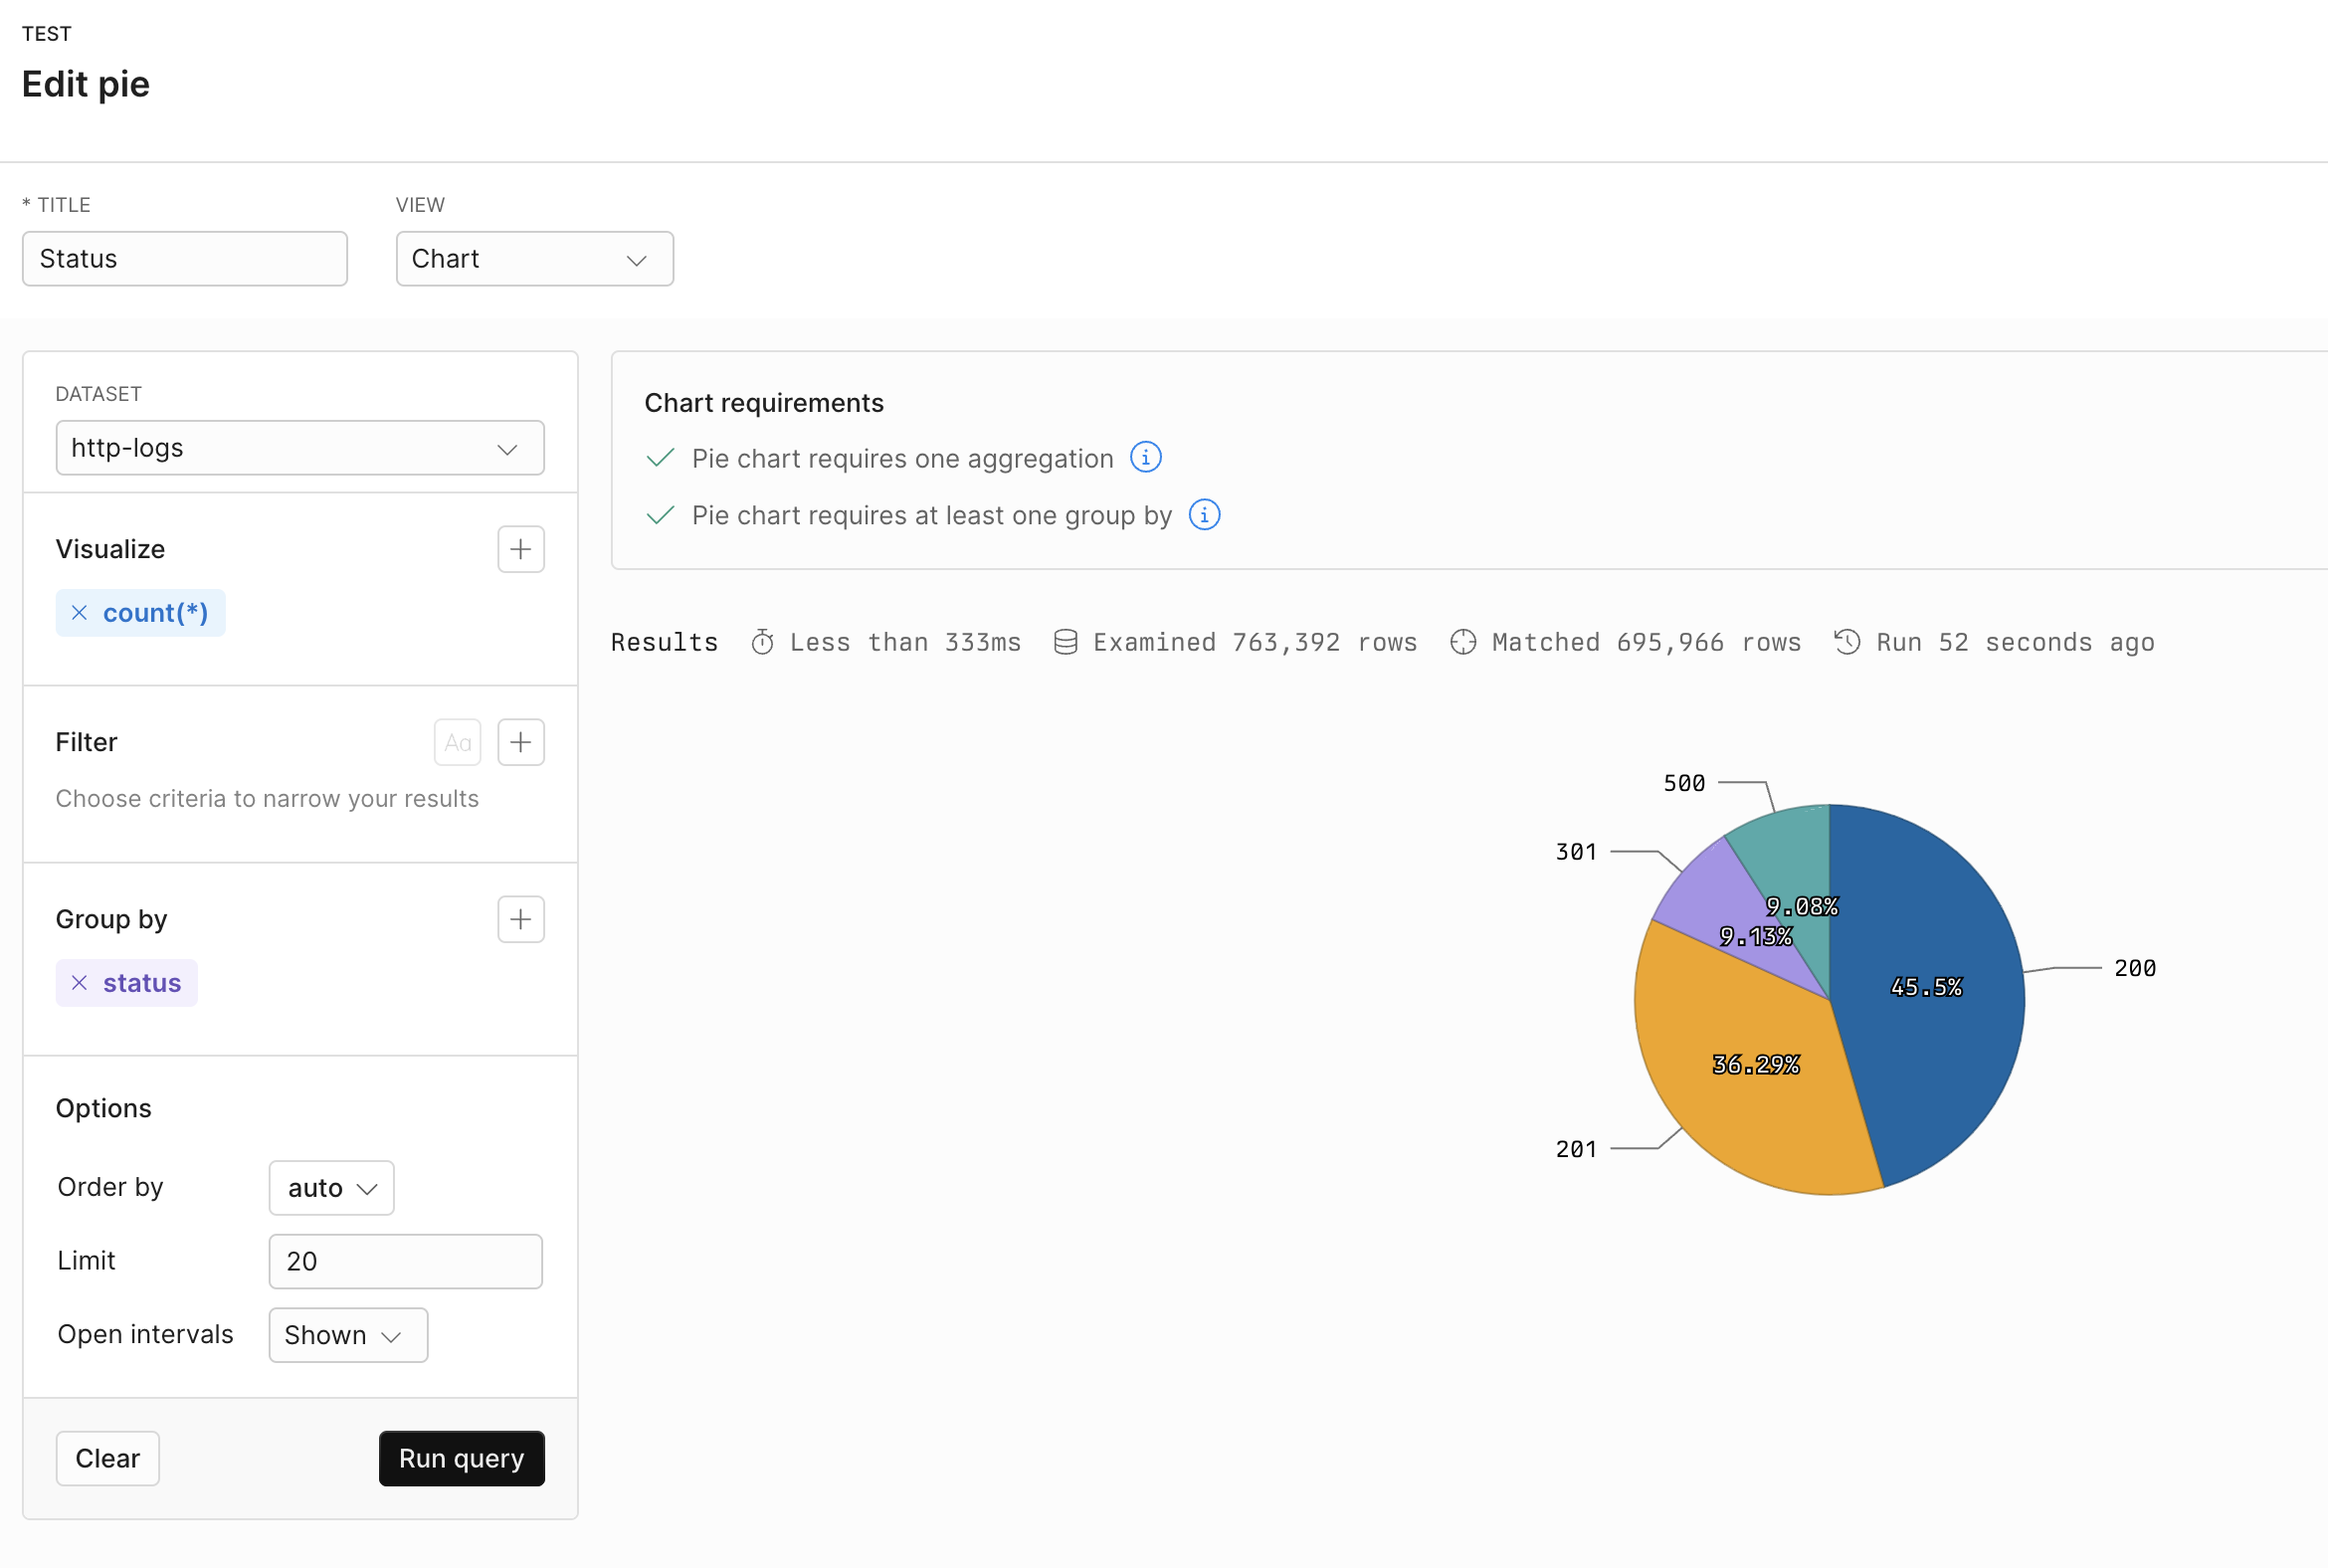 ## Example with APL [#example-with-apl]
```kusto
['sample-http-logs']
| summarize count() by status
```
## Example with APL [#example-with-apl]
```kusto
['sample-http-logs']
| summarize count() by status
```
 ---
# Scatter plot
Source: https://axiom.co/docs/dashboard-elements/scatter-plot
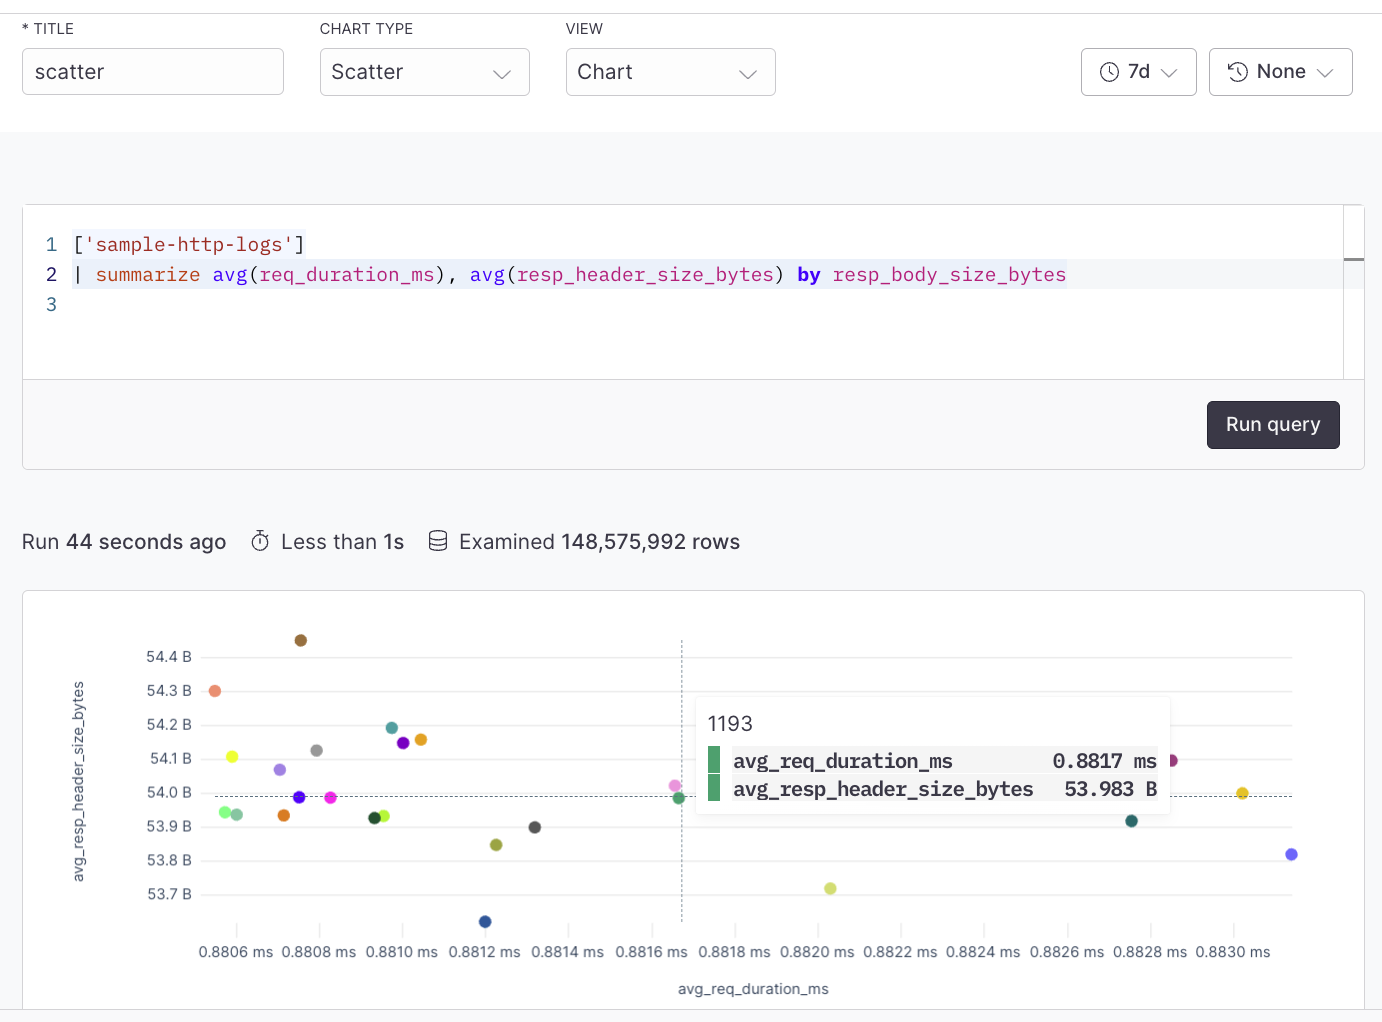
Scatter plots are used to visualize the correlation or distribution between two distinct metrics or logs. Each point in the scatter plot could represent a log entry, with the X and Y axes showing different log attributes (like request time and response size). The scatter plot chart can be created using the simple query builder or advanced query builder.
For example, plot response size against response time for an API to see if larger responses are correlated with slower response times.
---
# Scatter plot
Source: https://axiom.co/docs/dashboard-elements/scatter-plot
Scatter plots are used to visualize the correlation or distribution between two distinct metrics or logs. Each point in the scatter plot could represent a log entry, with the X and Y axes showing different log attributes (like request time and response size). The scatter plot chart can be created using the simple query builder or advanced query builder.
For example, plot response size against response time for an API to see if larger responses are correlated with slower response times.
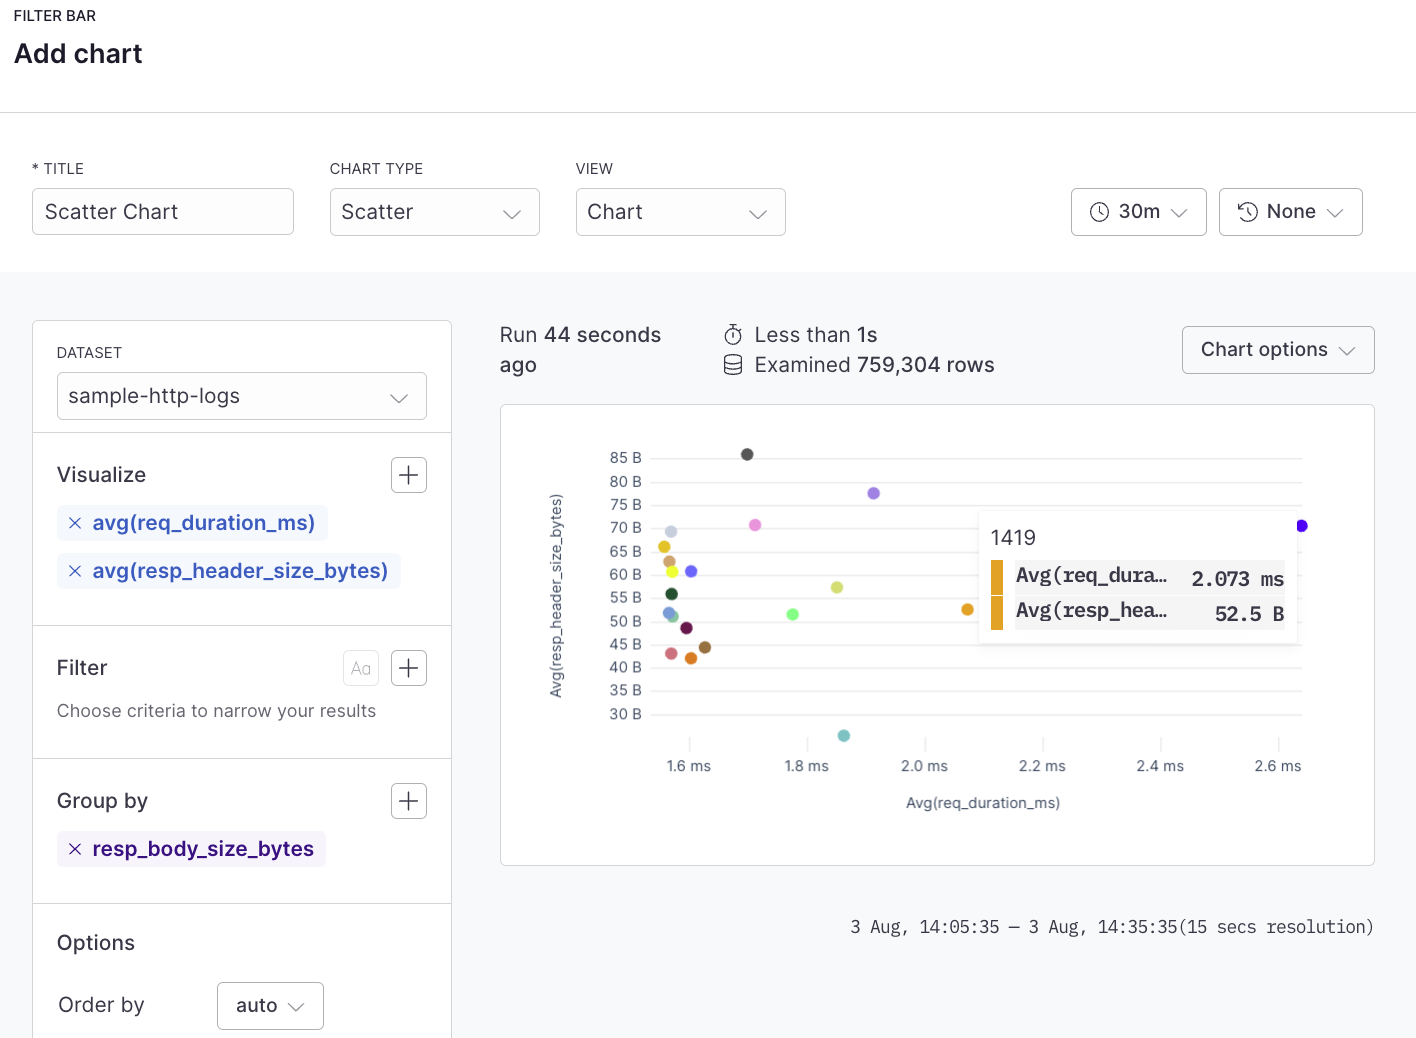 ## Example with APL [#example-with-apl]
```kusto
['sample-http-logs']
| summarize avg(req_duration_ms), avg(resp_header_size_bytes) by resp_body_size_bytes
```
## Example with APL [#example-with-apl]
```kusto
['sample-http-logs']
| summarize avg(req_duration_ms), avg(resp_header_size_bytes) by resp_body_size_bytes
```
 ---
# Spacer
Source: https://axiom.co/docs/dashboard-elements/spacer
The spacer dashboard element adds empty space to your dashboard layout. Use spacers to create visual separation between dashboard elements, improve the organization of your dashboard, and control the positioning of other elements.
---
# Spacer
Source: https://axiom.co/docs/dashboard-elements/spacer
The spacer dashboard element adds empty space to your dashboard layout. Use spacers to create visual separation between dashboard elements, improve the organization of your dashboard, and control the positioning of other elements.
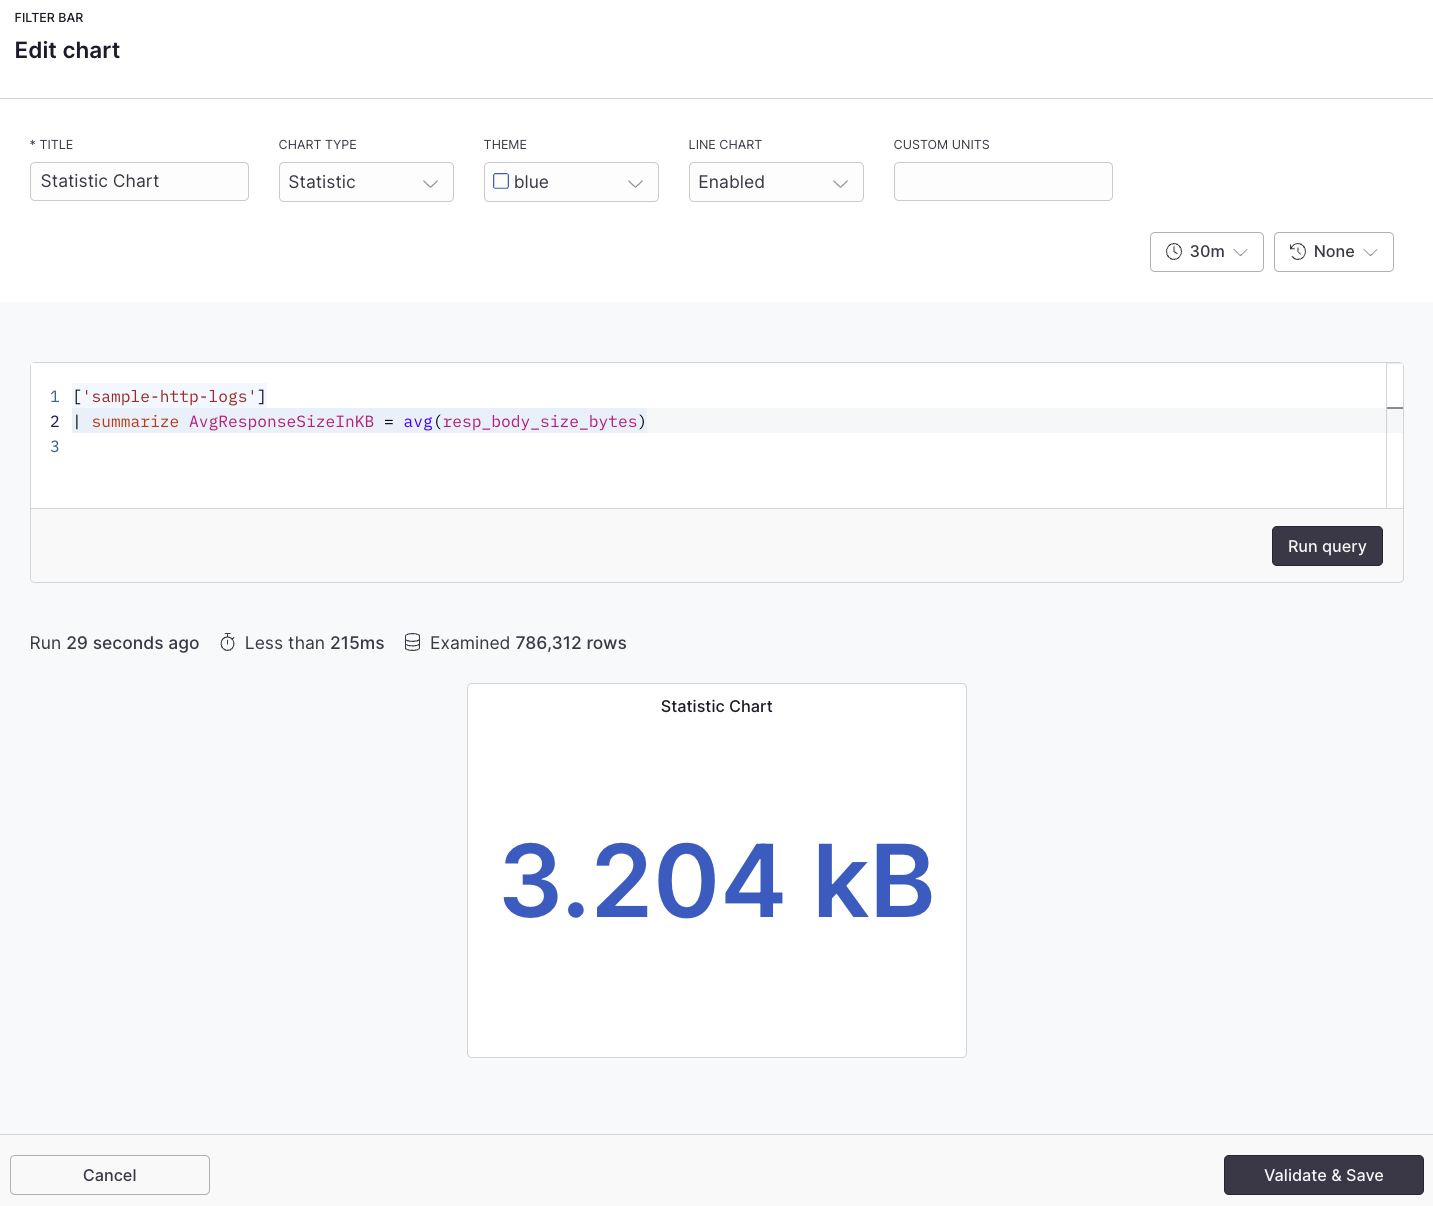
 ## Example with APL [#example-with-apl]
```kusto
['sample-http-logs']
| summarize avg(resp_body_size_bytes)
```
## Example with APL [#example-with-apl]
```kusto
['sample-http-logs']
| summarize avg(resp_body_size_bytes)
```
 ---
# Table
Source: https://axiom.co/docs/dashboard-elements/table
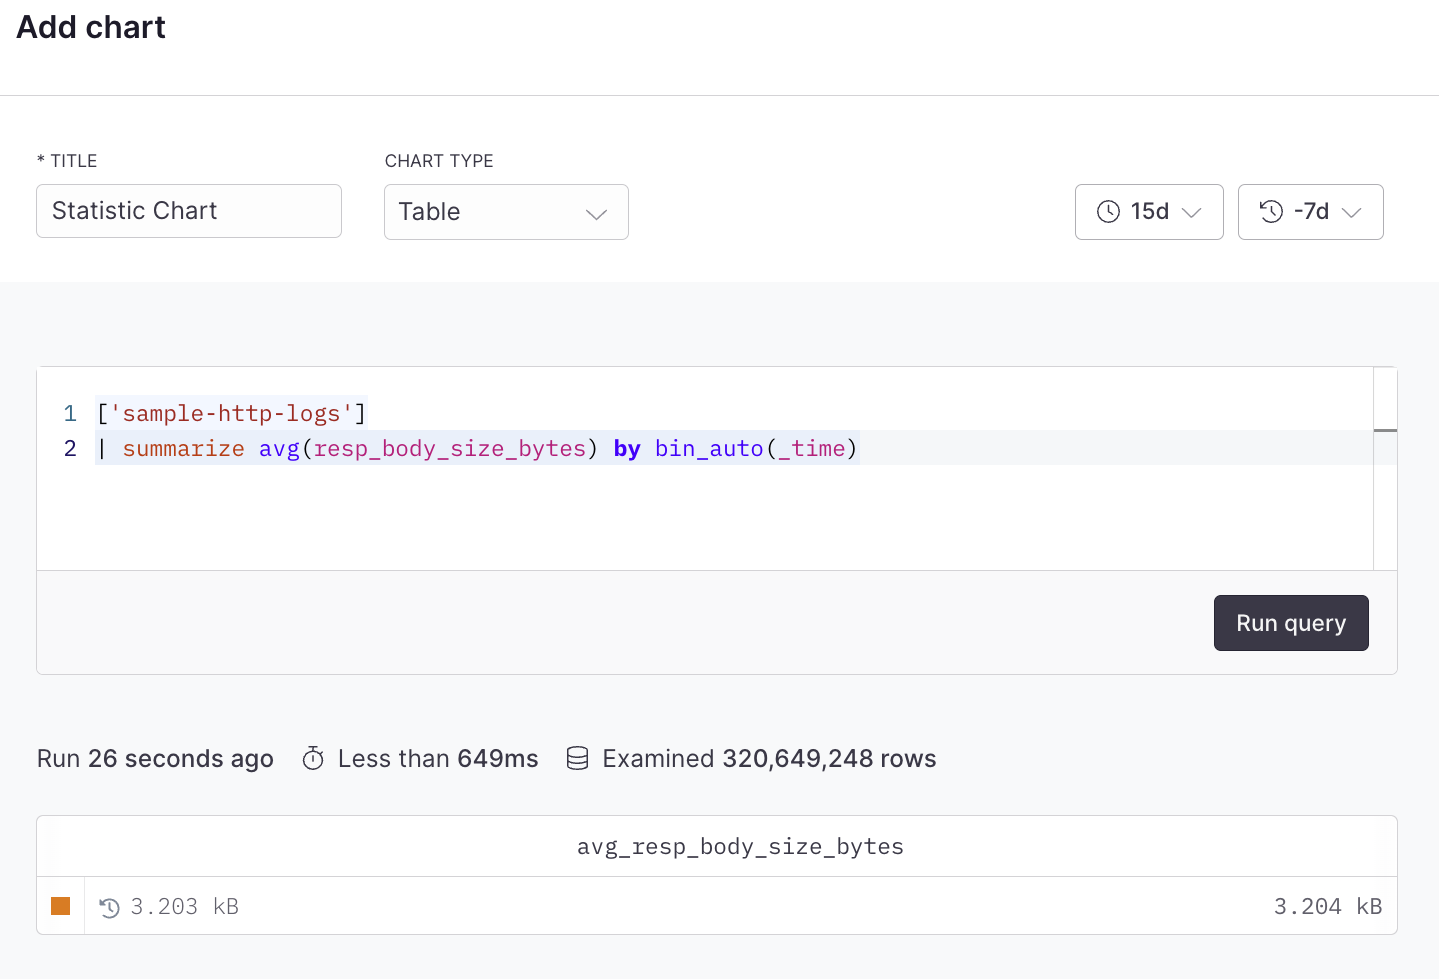
The table dashboard element displays a summary of any attributes from your metrics, logs, or traces in a sortable table format. Each row in the table could represent a different service, host, or other entity, with columns showing various attributes or metrics for that entity.
---
# Table
Source: https://axiom.co/docs/dashboard-elements/table
The table dashboard element displays a summary of any attributes from your metrics, logs, or traces in a sortable table format. Each row in the table could represent a different service, host, or other entity, with columns showing various attributes or metrics for that entity.
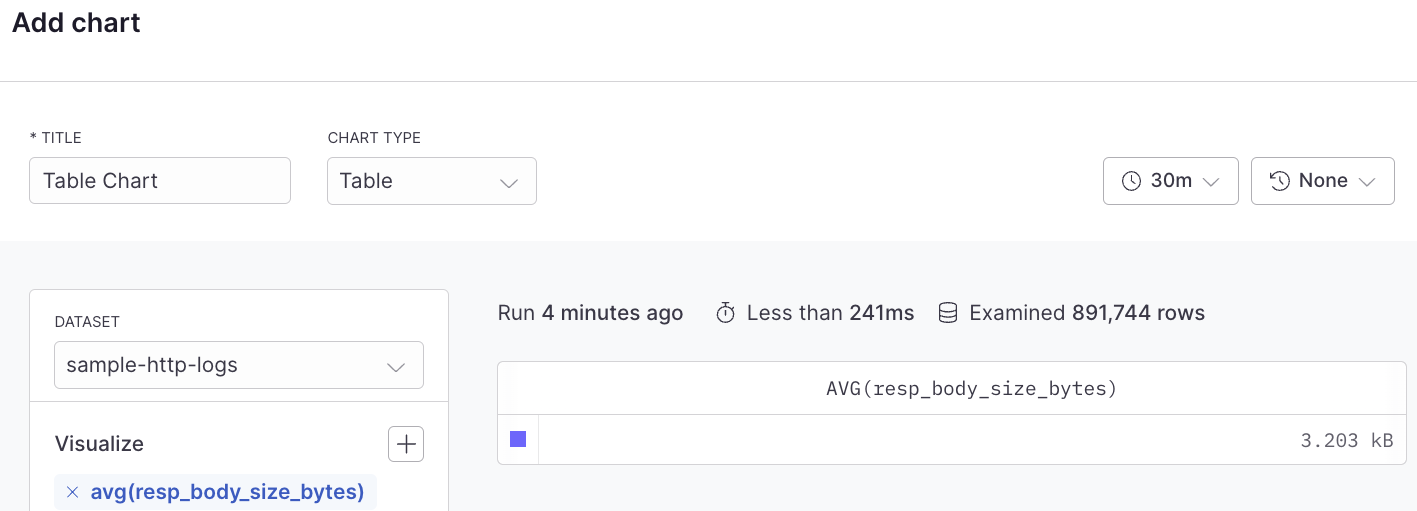 ## Example with APL [#example-with-apl]
```kusto
['sample-http-logs']
| summarize avg(resp_body_size_bytes) by bin_auto(_time)
```
## Example with APL [#example-with-apl]
```kusto
['sample-http-logs']
| summarize avg(resp_body_size_bytes) by bin_auto(_time)
```
 ---
# Time series
Source: https://axiom.co/docs/dashboard-elements/time-series
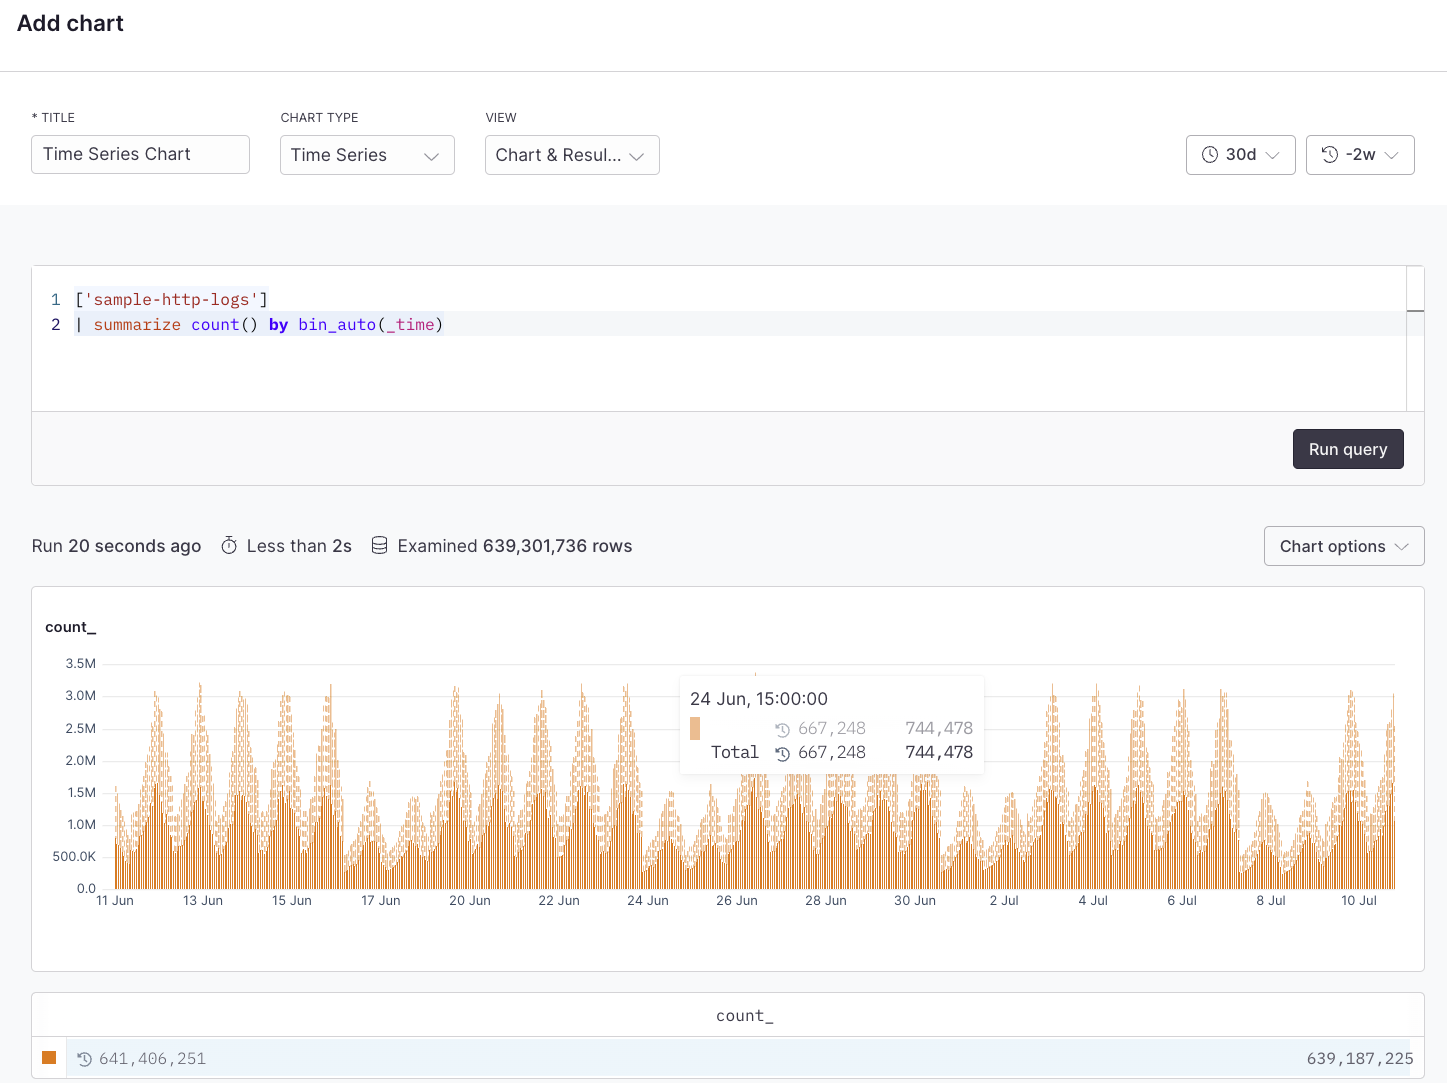
Time series charts show the change in your data over time which can help identify infrastructure issues, spikes, or dips in the data. This can be a simple line chart, an area chart, or a bar chart. A time series chart might be used to show the change in the volume of log events, error rates, latency, or other time-sensitive data.
---
# Time series
Source: https://axiom.co/docs/dashboard-elements/time-series
Time series charts show the change in your data over time which can help identify infrastructure issues, spikes, or dips in the data. This can be a simple line chart, an area chart, or a bar chart. A time series chart might be used to show the change in the volume of log events, error rates, latency, or other time-sensitive data.
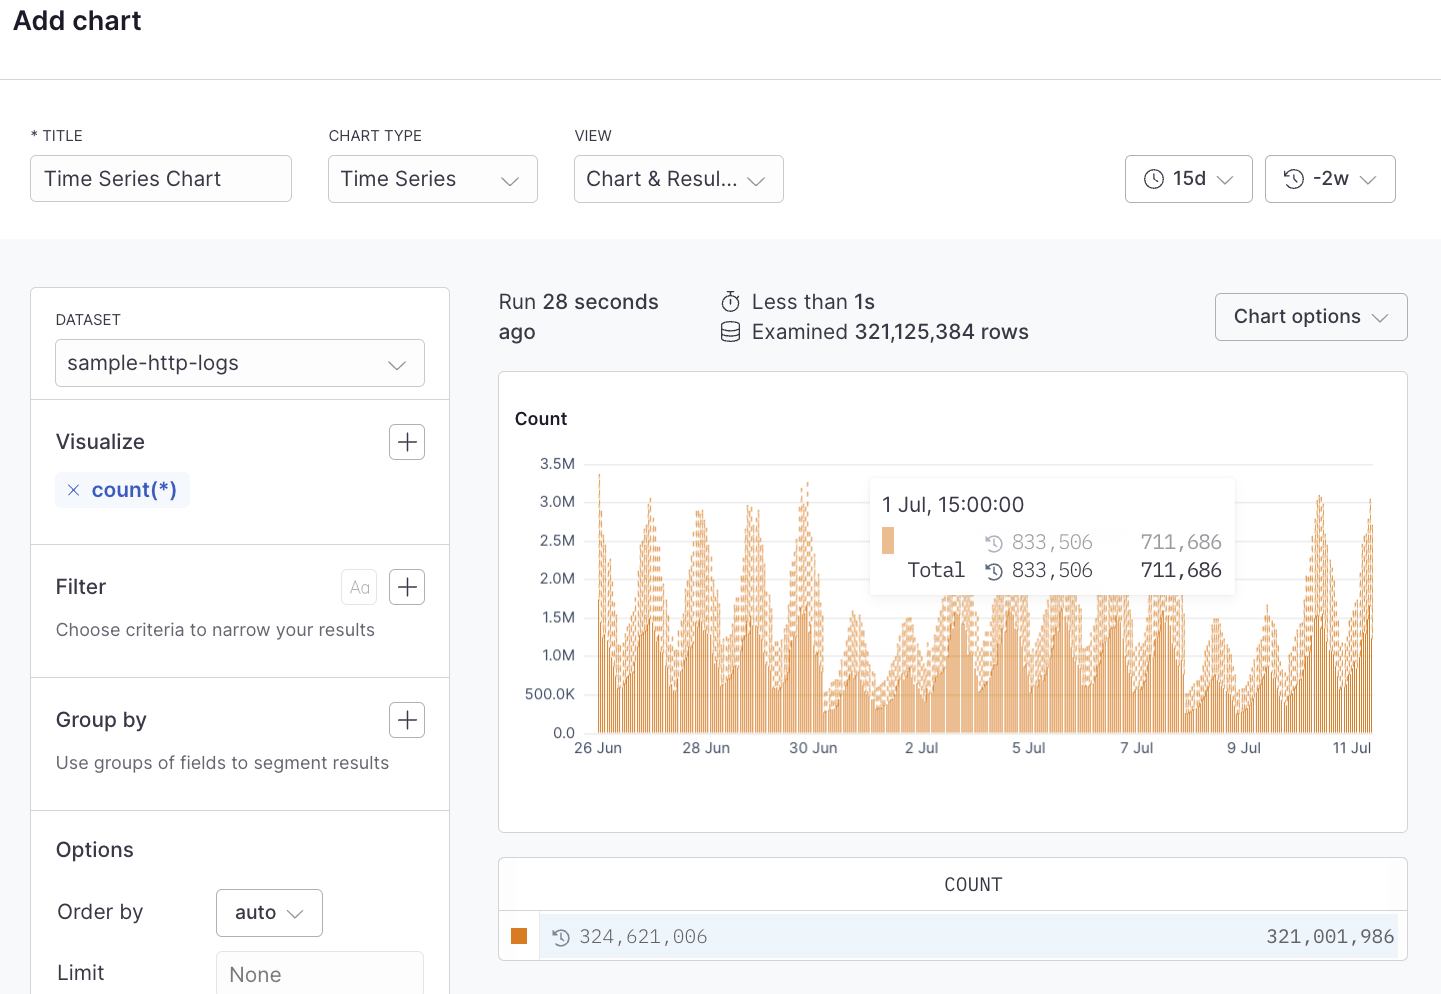 ## Example with APL [#example-with-apl]
```kusto
['sample-http-logs']
| summarize count() by bin_auto(_time)
```
## Example with APL [#example-with-apl]
```kusto
['sample-http-logs']
| summarize count() by bin_auto(_time)
```
 ---
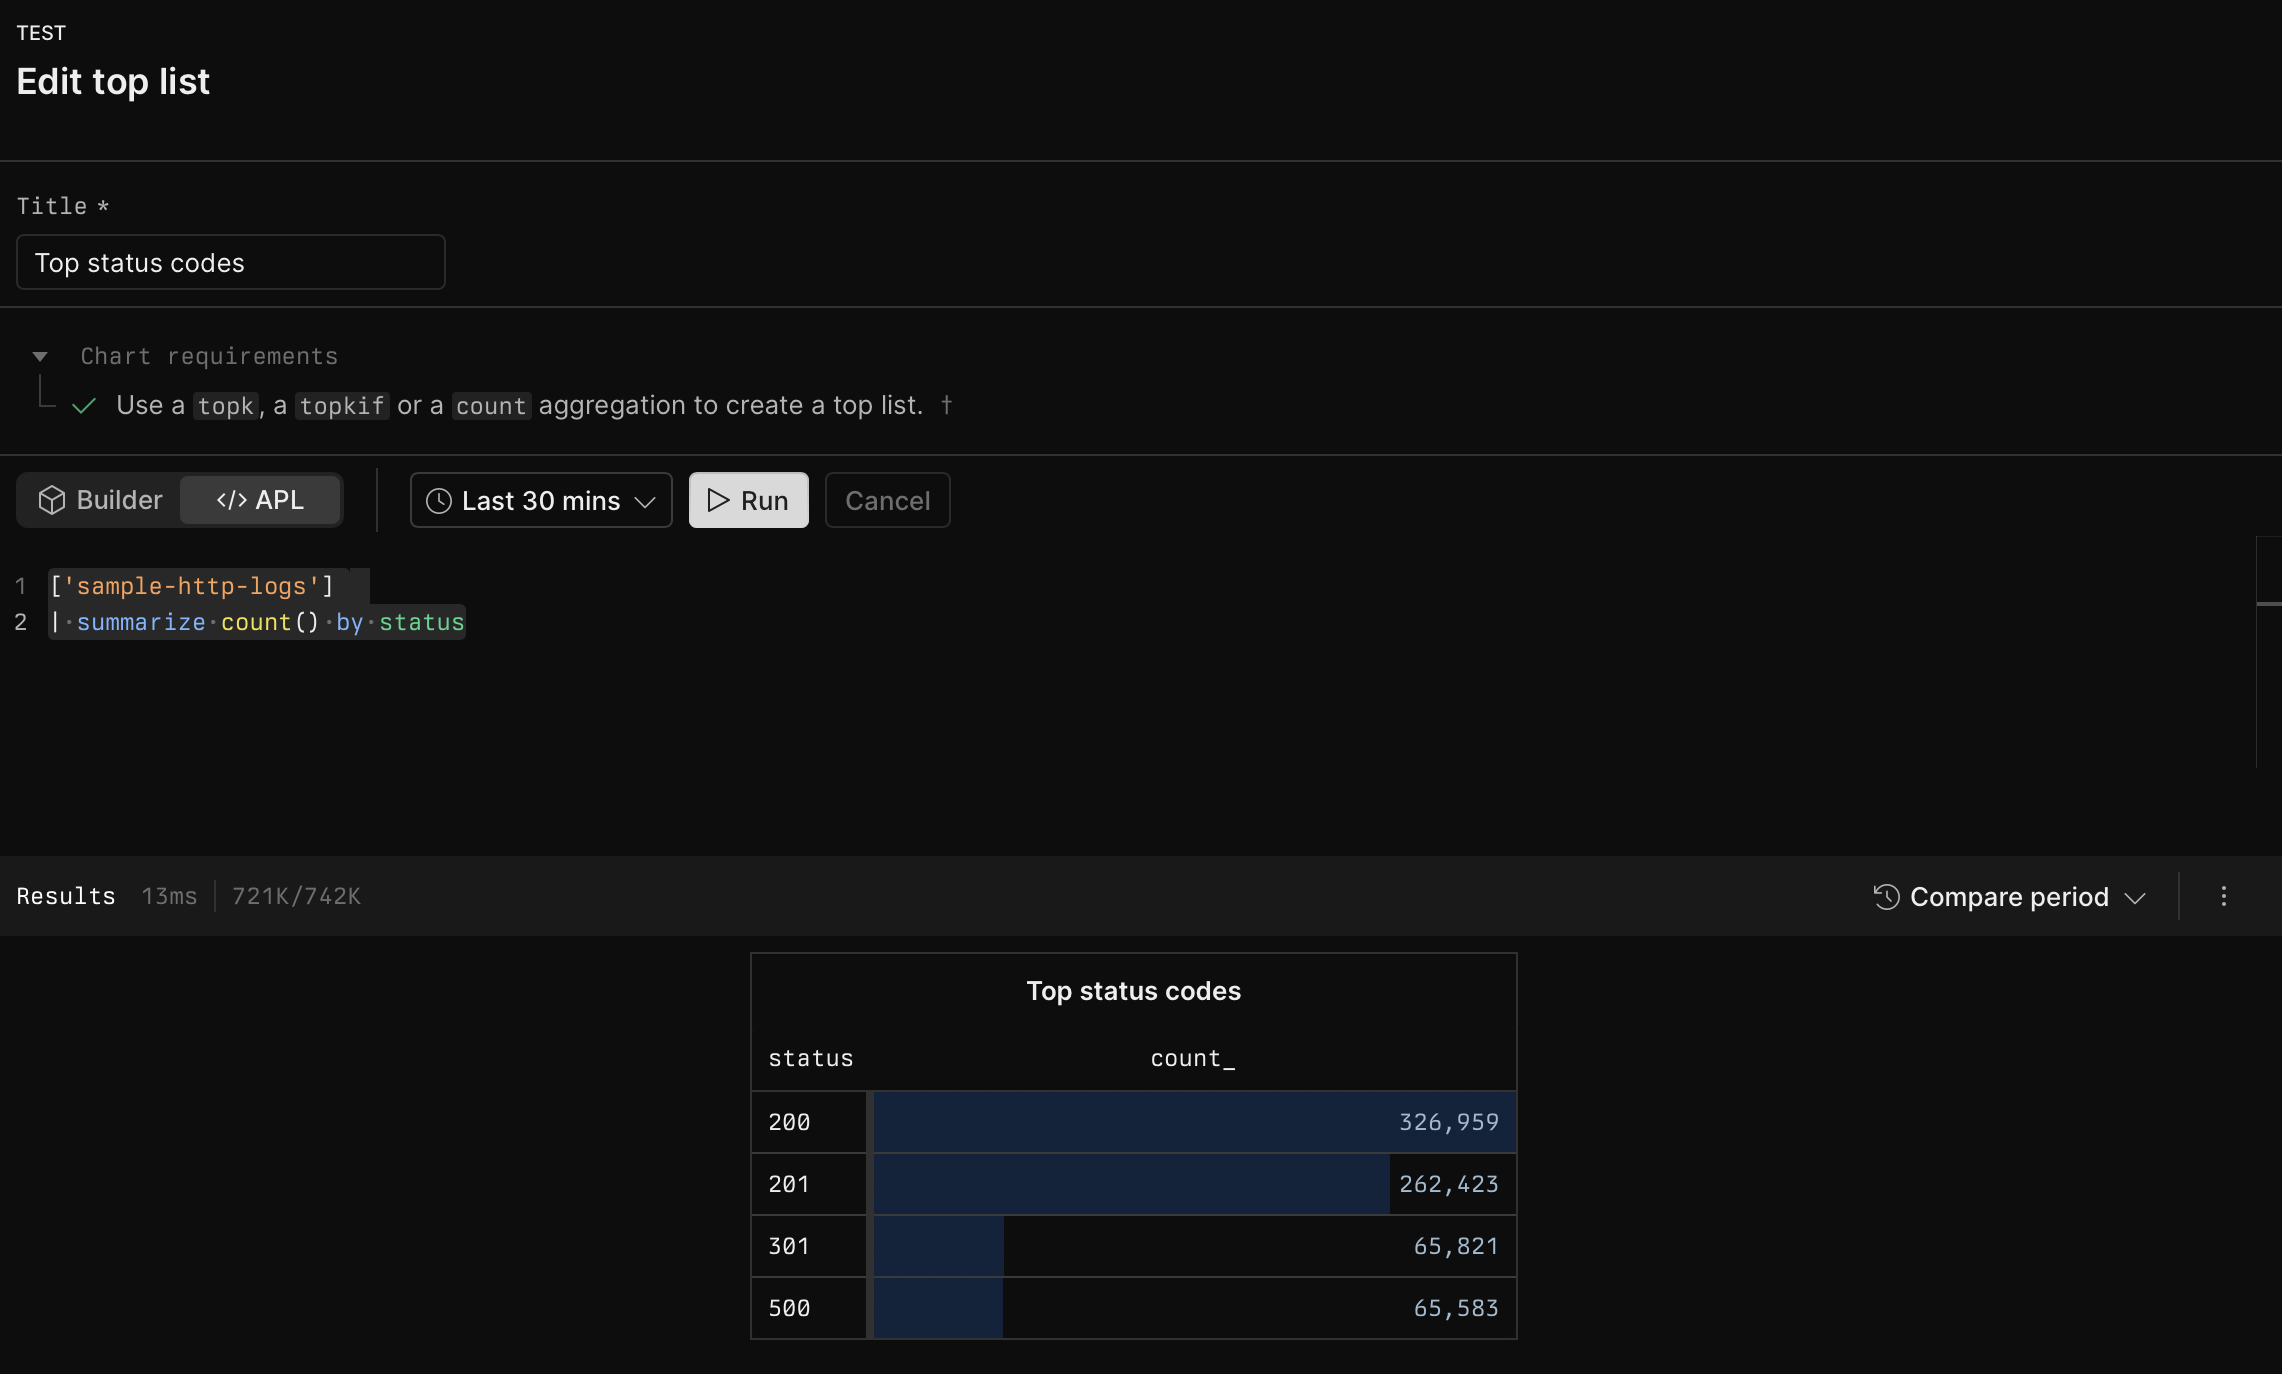
# Top list
Source: https://axiom.co/docs/dashboard-elements/top-list
The top list dashboard element displays the top results from your query, showing the most significant items based on your aggregation and grouping. It can display results as either a table of totals or as time series charts, depending on the aggregation type used.
---
# Top list
Source: https://axiom.co/docs/dashboard-elements/top-list
The top list dashboard element displays the top results from your query, showing the most significant items based on your aggregation and grouping. It can display results as either a table of totals or as time series charts, depending on the aggregation type used.
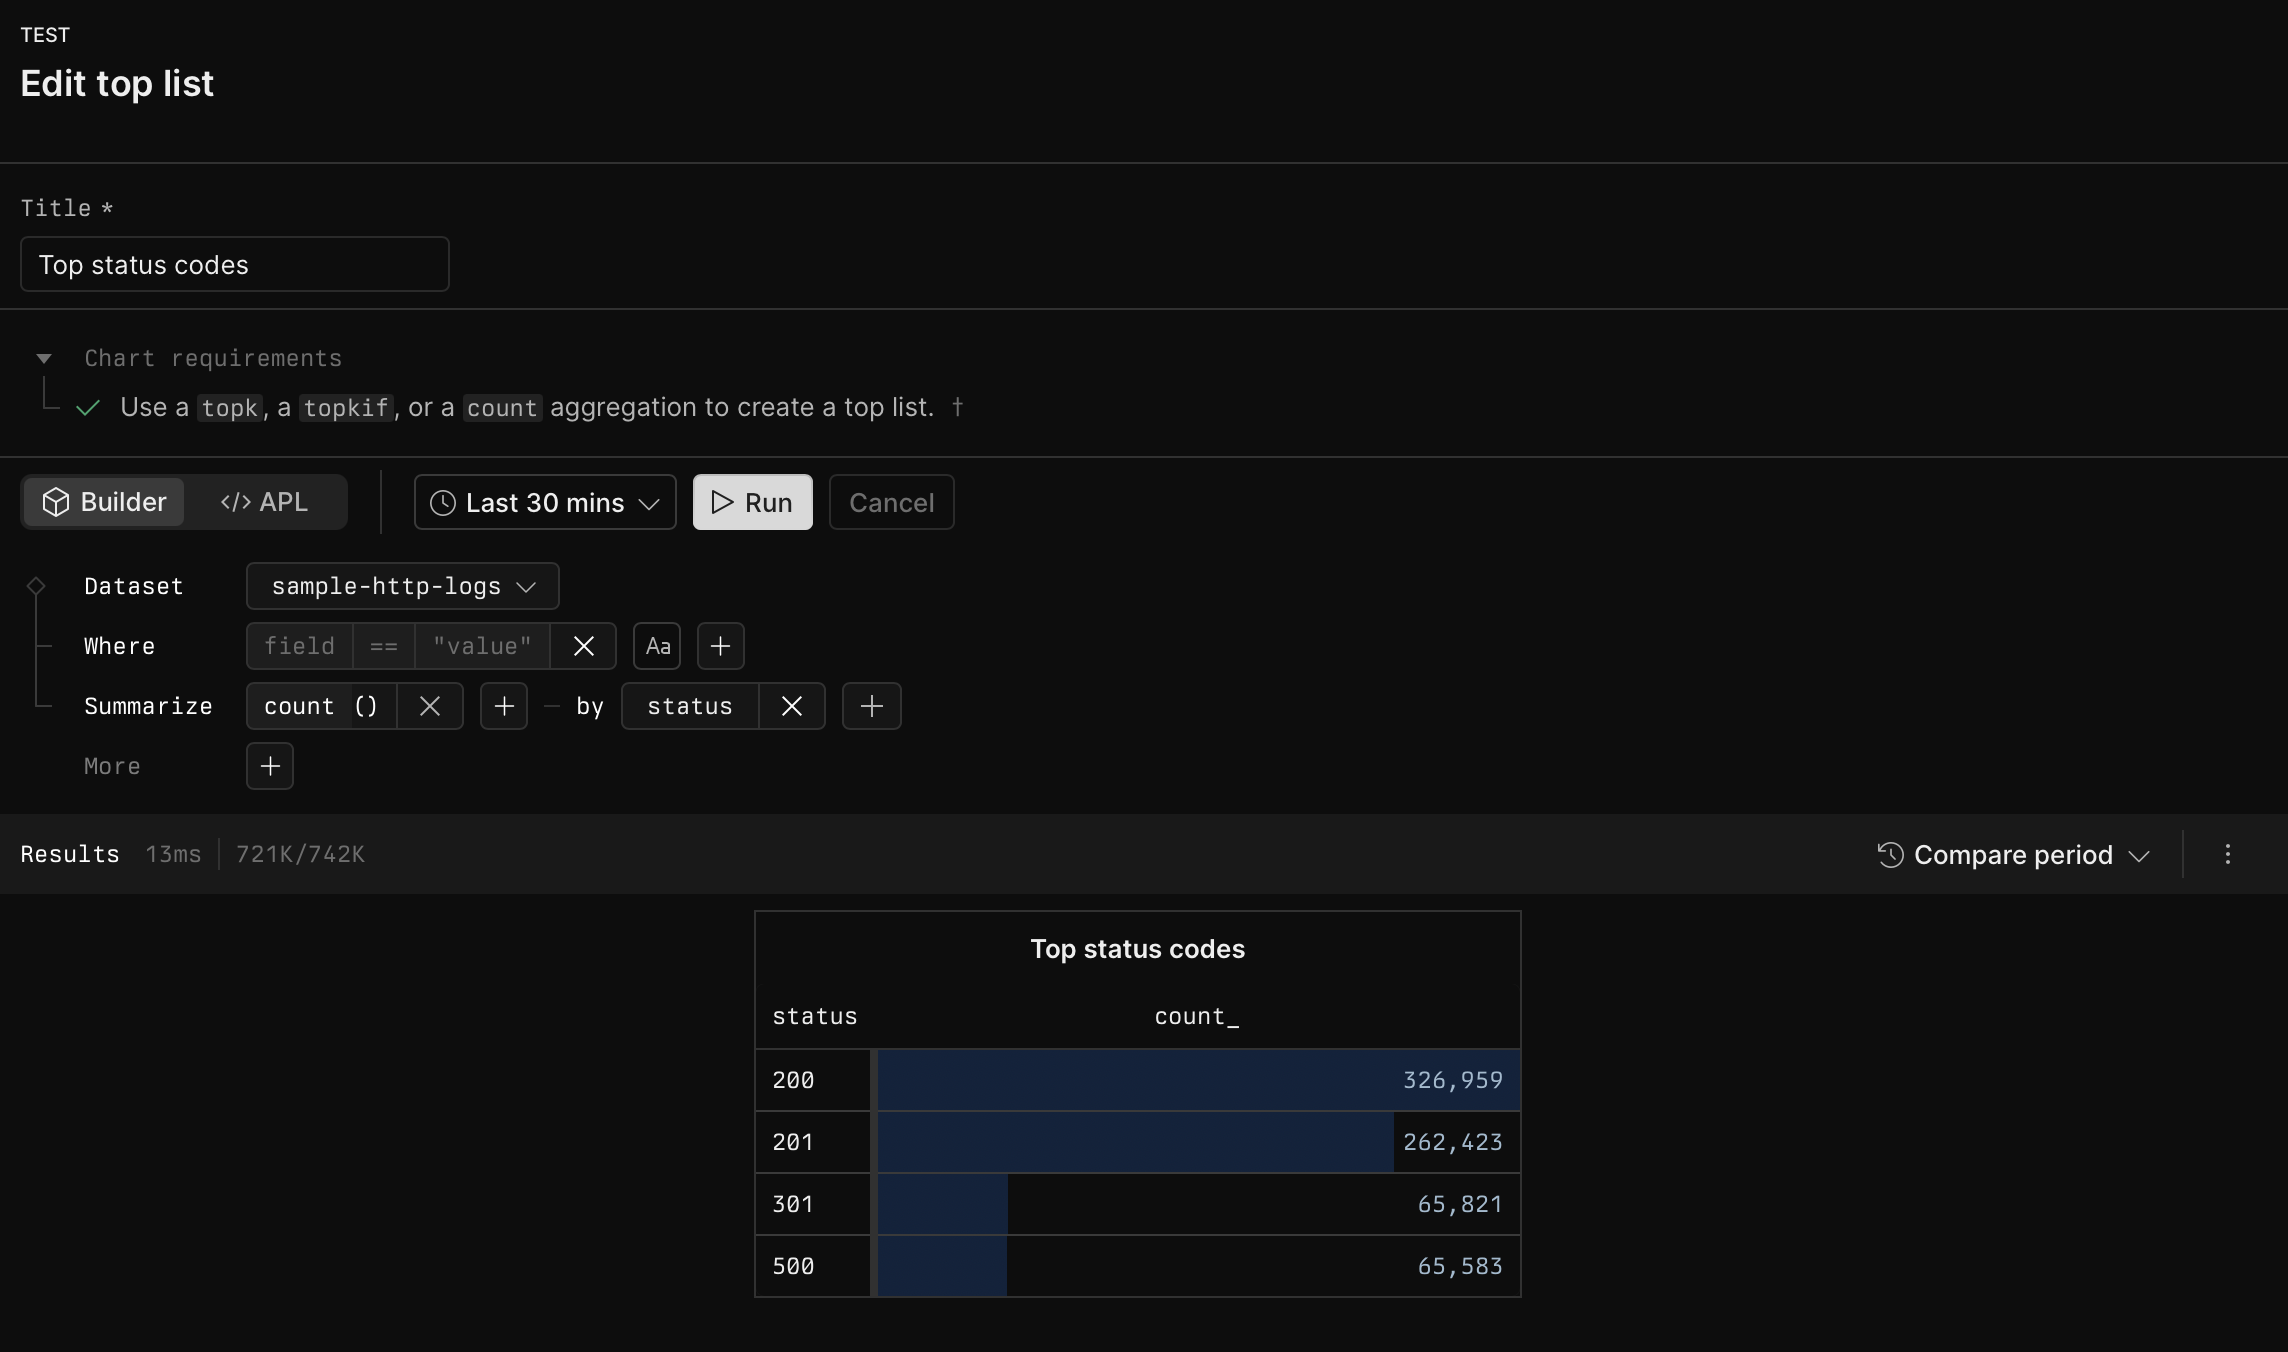 ## Example with APL [#example-with-apl]
```kusto
['sample-http-logs']
| summarize count() by status
| top 10 by count_ desc
```
## Example with APL [#example-with-apl]
```kusto
['sample-http-logs']
| summarize count() by status
| top 10 by count_ desc
```
 ---
# Configure dashboards
Source: https://axiom.co/docs/dashboards/configure
## Select time range [#select-time-range]
When you select the time range, you specify the time interval for which you want to display data in the dashboard. Changing the time range affects the data displayed in all dashboard elements.
To select the time range:
1. In the top right, click
---
# Configure dashboards
Source: https://axiom.co/docs/dashboards/configure
## Select time range [#select-time-range]
When you select the time range, you specify the time interval for which you want to display data in the dashboard. Changing the time range affects the data displayed in all dashboard elements.
To select the time range:
1. In the top right, click 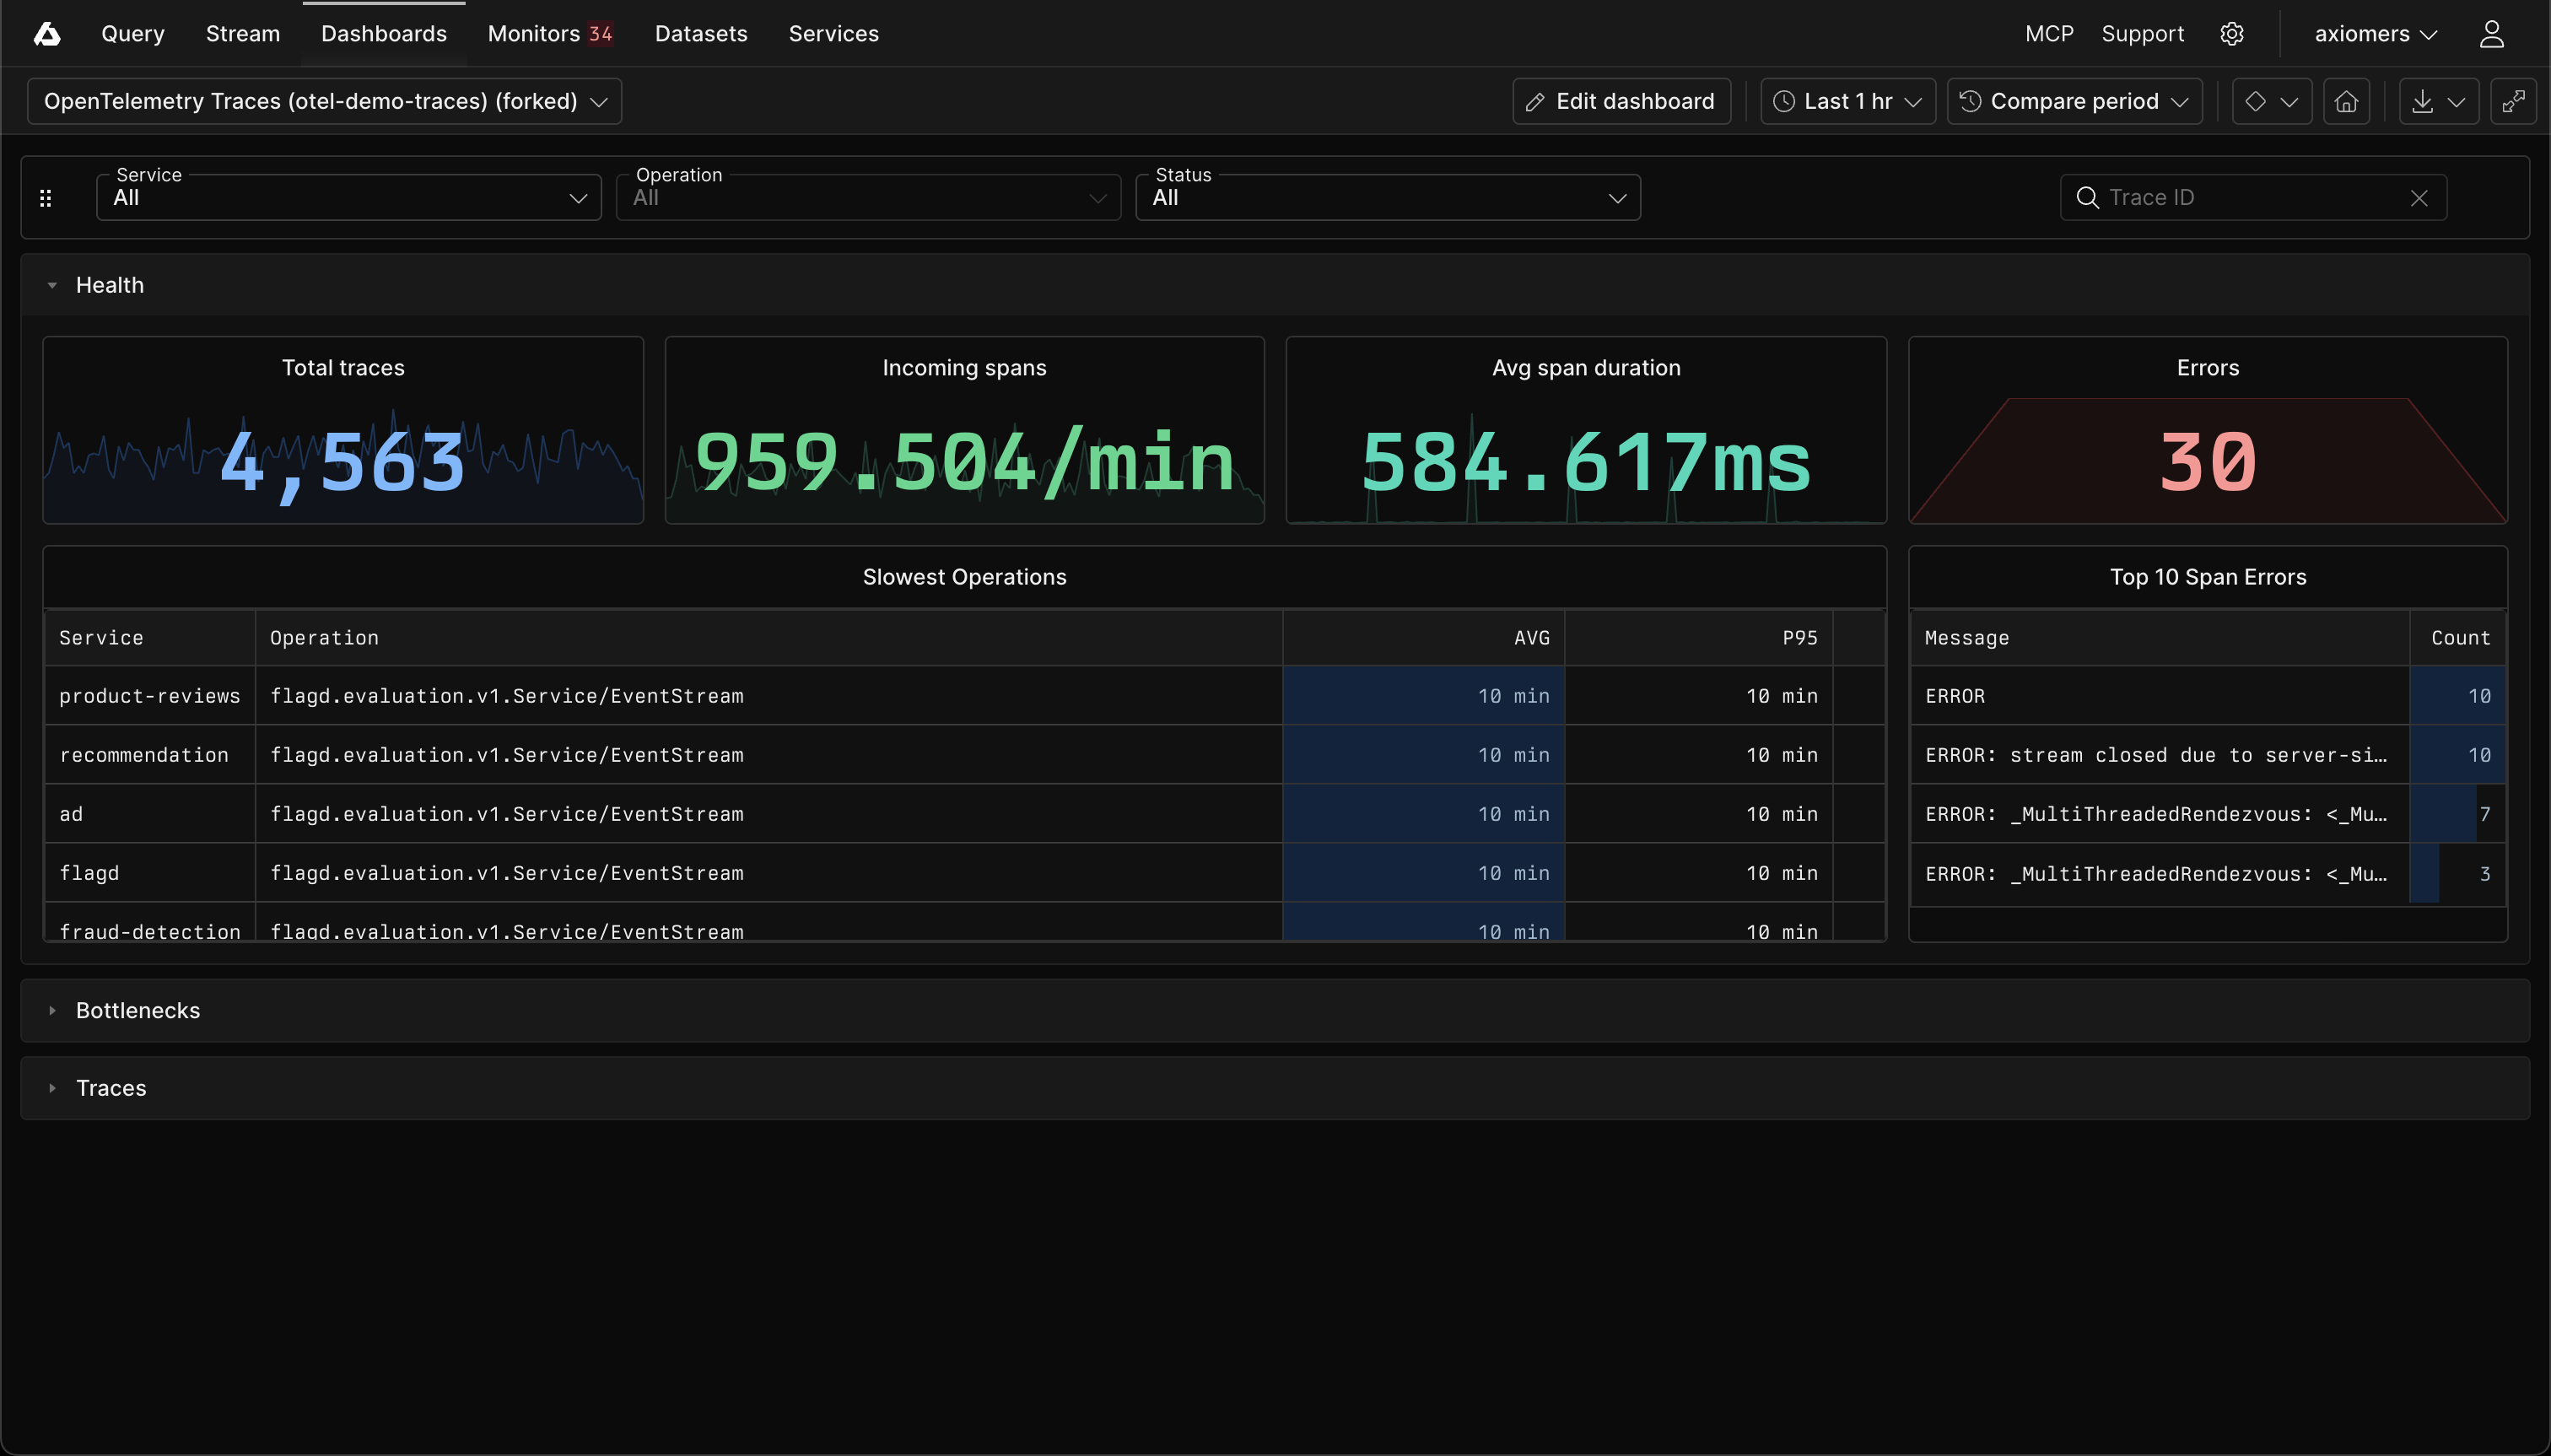
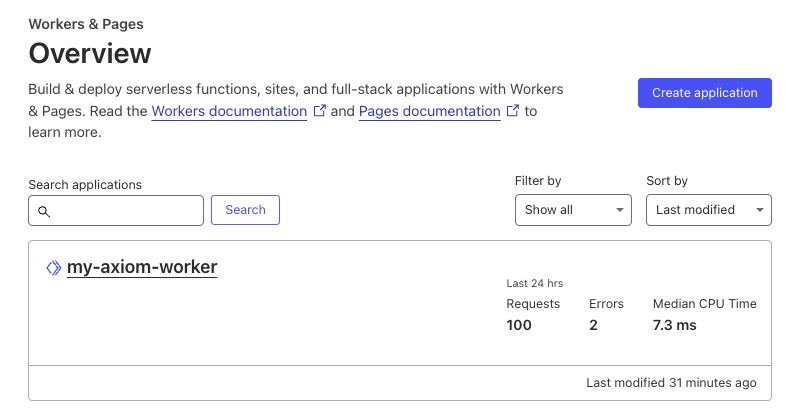 * Click your app’s name to view its details. Within the app’s page, select the triggers tab to review the triggers associated with your app.
* Under the routes section of the triggers tab, you will find the URL route assigned to your Worker. This is where your Cloudflare Worker responds to incoming requests. Vist the [Cloudflare Workers documentation](https://developers.cloudflare.com/workers/get-started/guide/) to learn how to configure routes
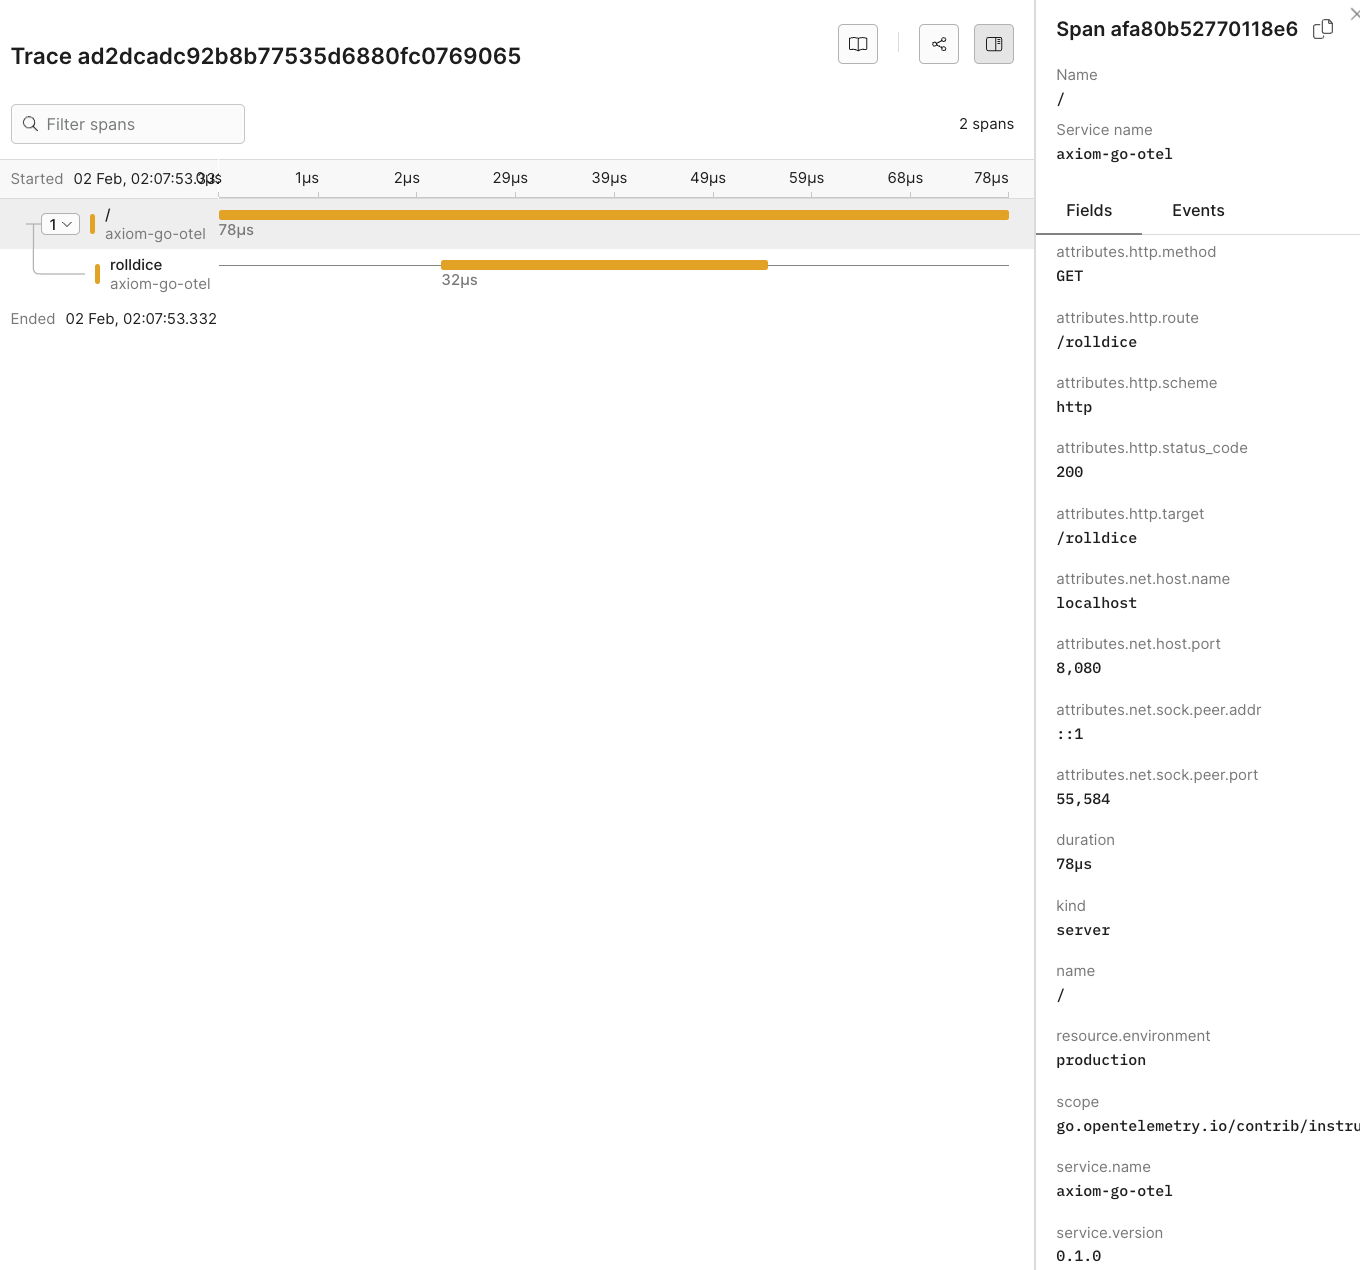
## Observe the telemetry data in Axiom [#observe-the-telemetry-data-in-axiom]
As you interact with your app, traces will be collected and exported to Axiom, allowing you to monitor, analyze, and gain insights into your app’s performance and behavior.
* Click your app’s name to view its details. Within the app’s page, select the triggers tab to review the triggers associated with your app.
* Under the routes section of the triggers tab, you will find the URL route assigned to your Worker. This is where your Cloudflare Worker responds to incoming requests. Vist the [Cloudflare Workers documentation](https://developers.cloudflare.com/workers/get-started/guide/) to learn how to configure routes
## Observe the telemetry data in Axiom [#observe-the-telemetry-data-in-axiom]
As you interact with your app, traces will be collected and exported to Axiom, allowing you to monitor, analyze, and gain insights into your app’s performance and behavior.
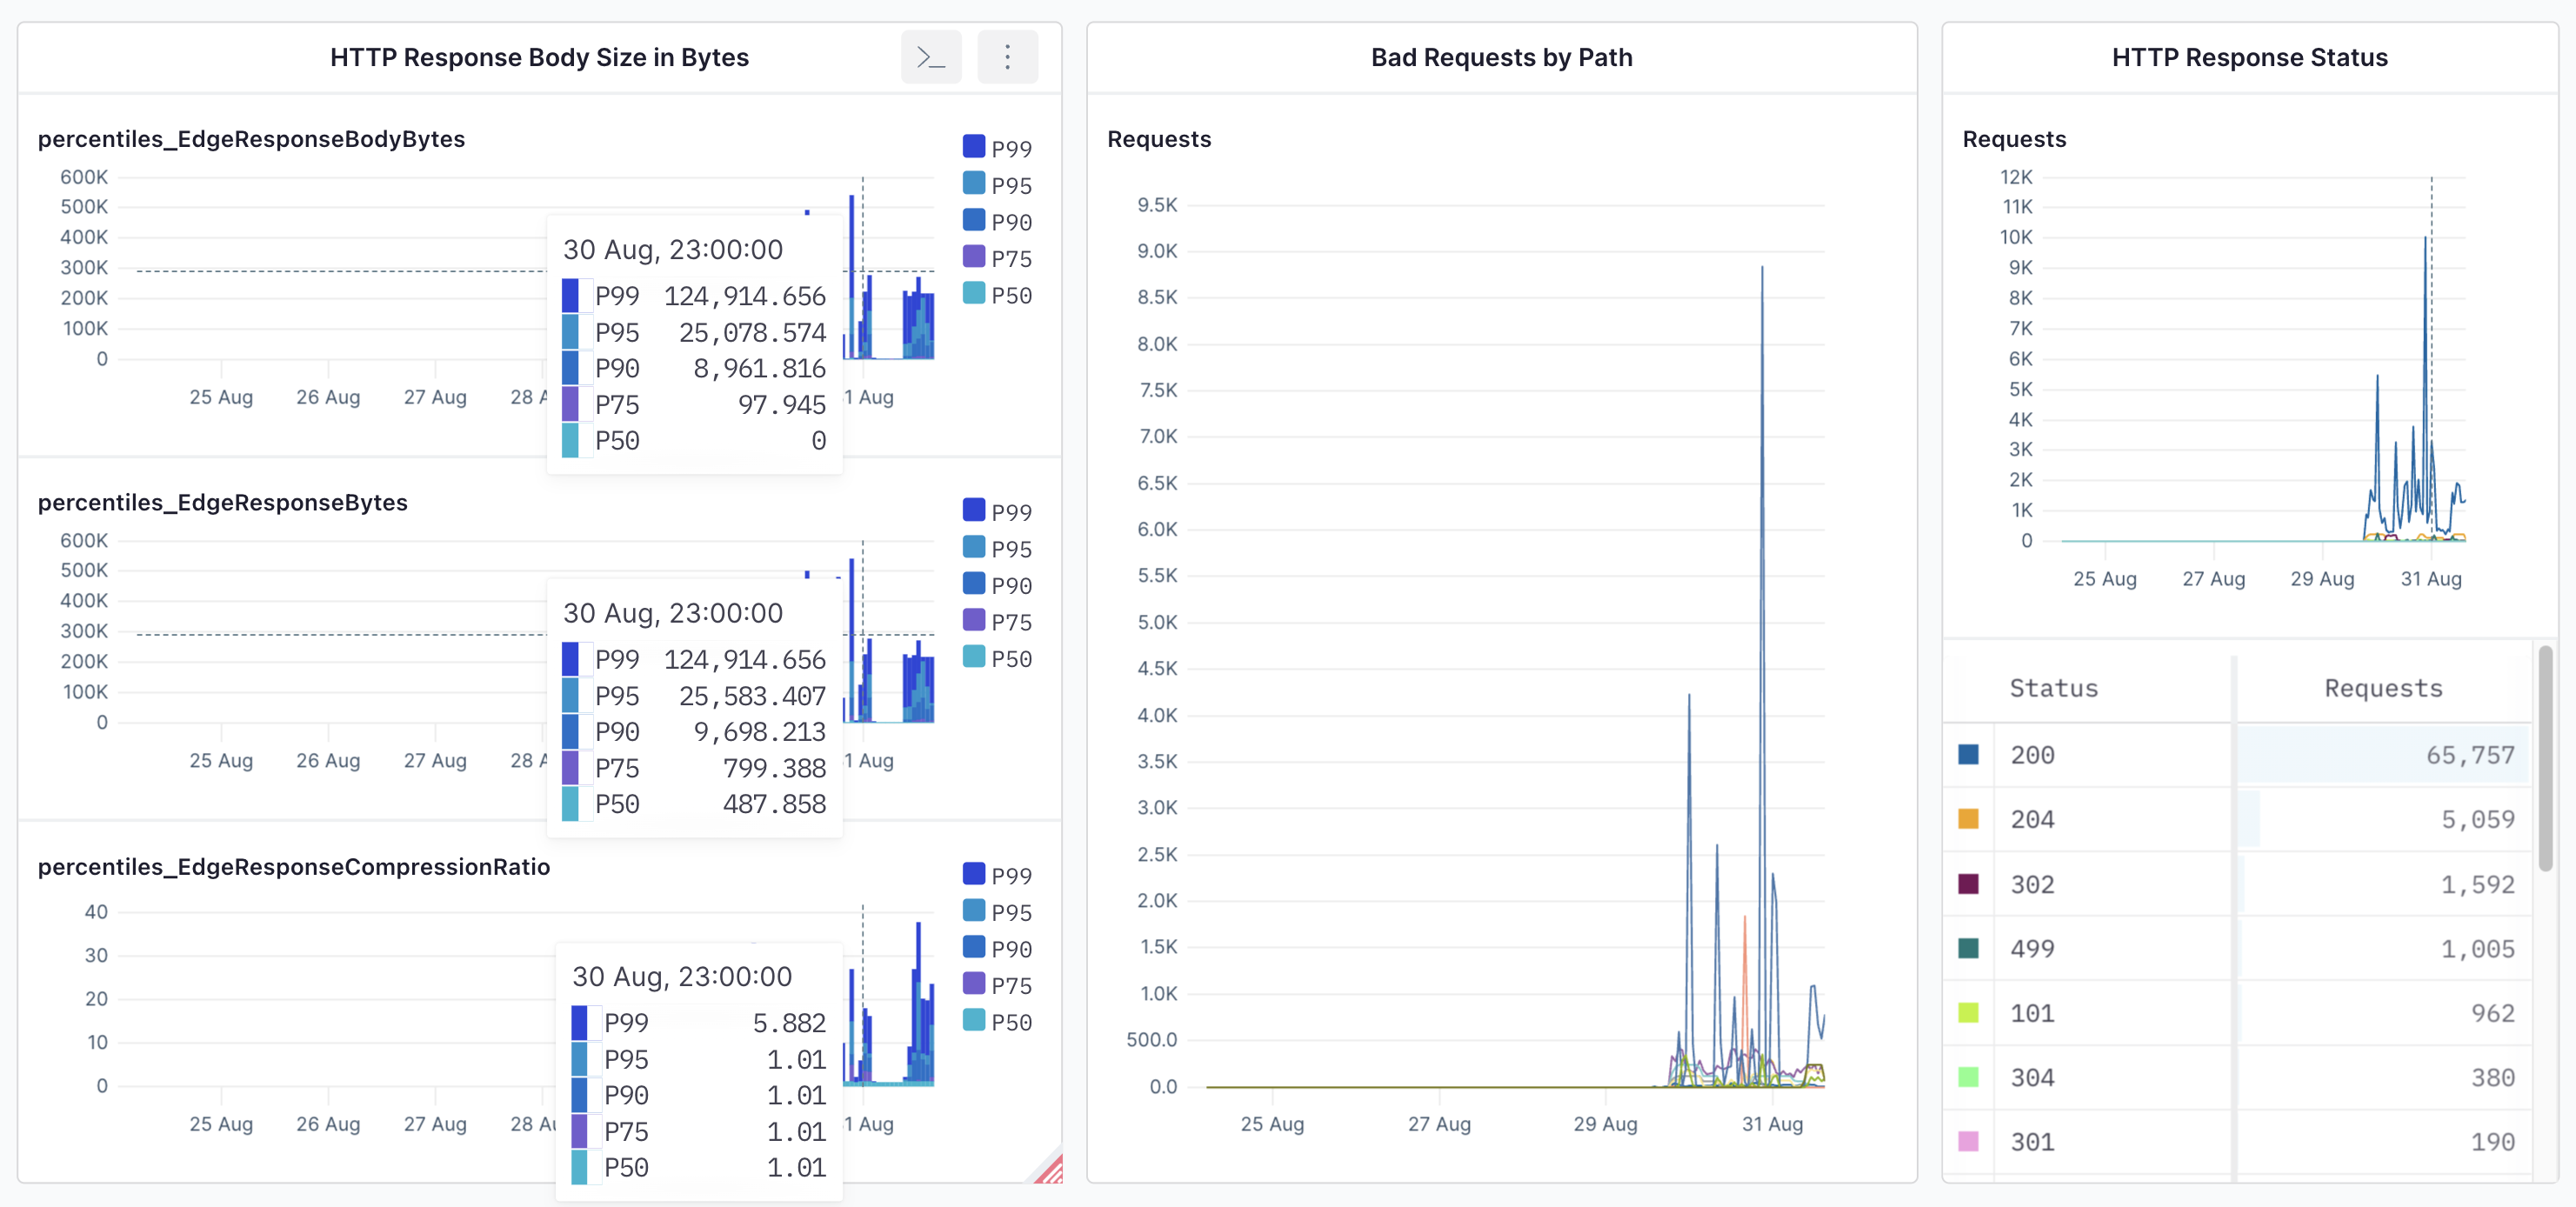
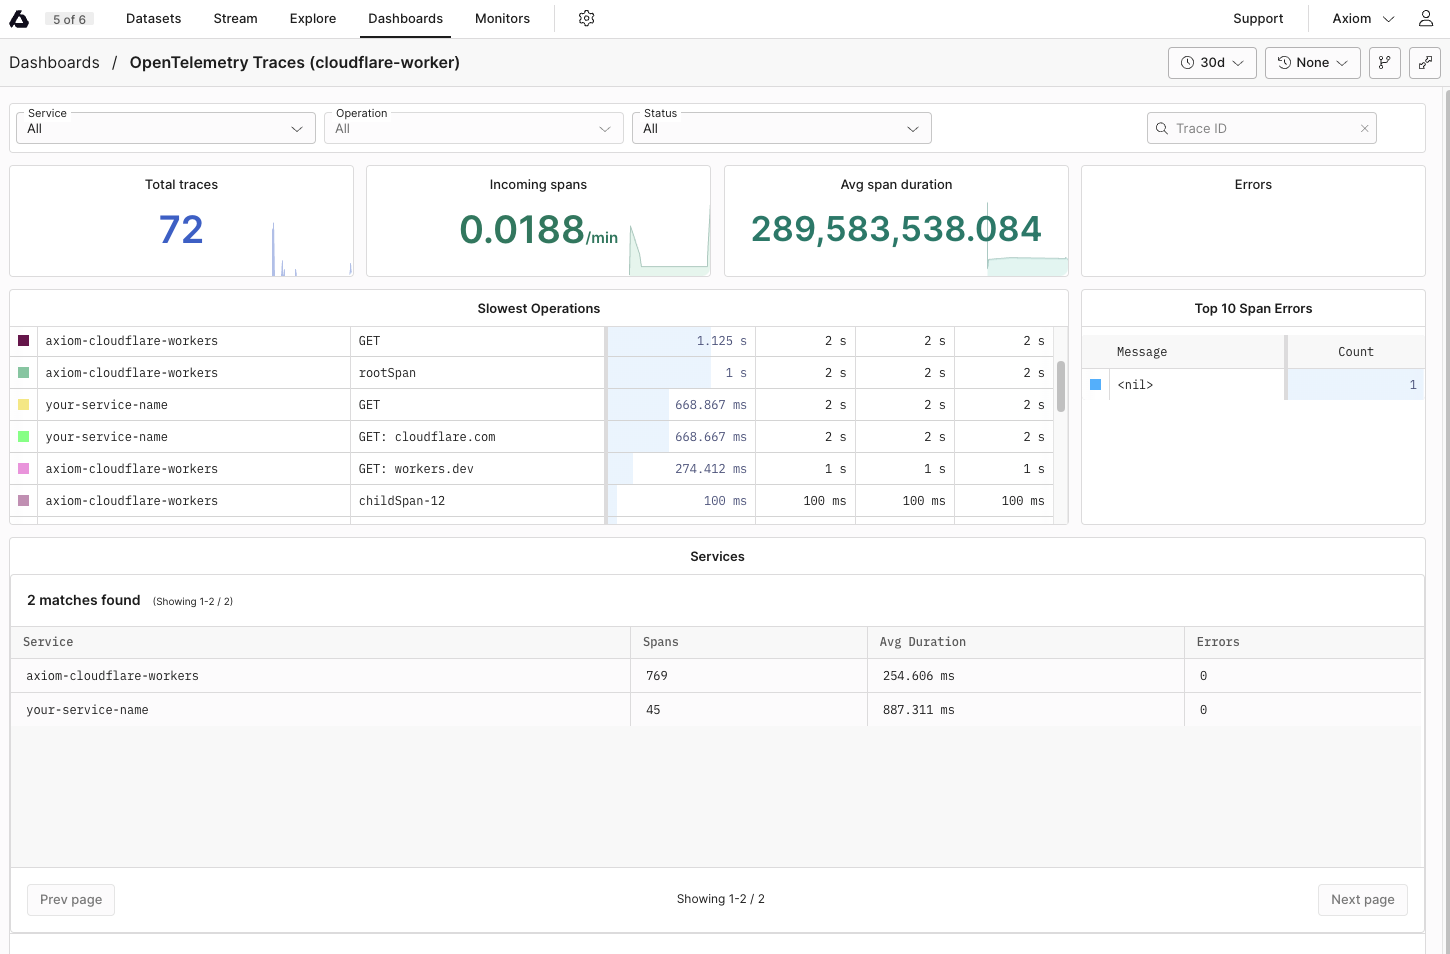
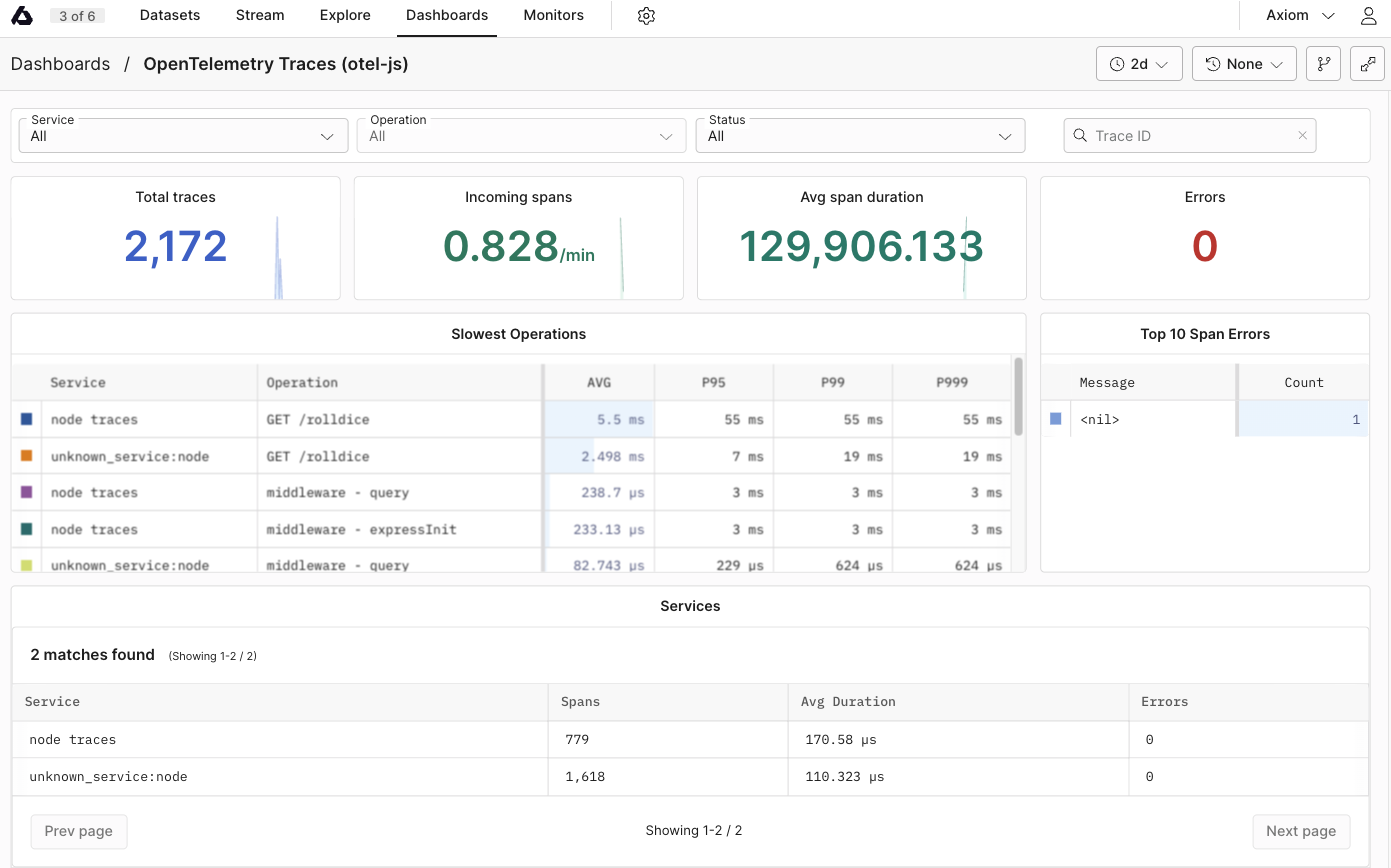
 ## Dynamic OpenTelemetry traces dashboard [#dynamic-opentelemetry-traces-dashboard]
This data can then be further viewed and analyzed in Axiom’s dashboard, offering a deeper understanding of your app’s performance and behavior.
## Dynamic OpenTelemetry traces dashboard [#dynamic-opentelemetry-traces-dashboard]
This data can then be further viewed and analyzed in Axiom’s dashboard, offering a deeper understanding of your app’s performance and behavior.
 **Working with Cloudflare Pages Functions:** Integration with OpenTelemetry is similar to Workers but uses the Cloudflare Dashboard for configuration, bypassing **`wrangler.toml`**. This simplifies setup through the Cloudflare dashboard web interface.
## Manual Instrumentation [#manual-instrumentation]
Manual instrumentation requires adding code into your Worker’s script to create and manage spans around the code blocks you want to trace.
1. Initialize Tracer:
Use the OpenTelemetry API to create a tracer instance at the beginning of your script using the **`@microlabs/otel-cf-workers`** package.
```js
import { trace } from '@opentelemetry/api';
const tracer = trace.getTracer('your-service-name');
```
2. Create start and end Spans:
Manually start spans before the operations or events you want to trace and ensure you end them afterward to complete the tracing lifecycle.
```js
const span = tracer.startSpan('operationName');
try {
// Your operation code here
} finally {
span.end();
}
```
3. Annotate Spans:
Add important metadata to spans to provide additional context. This can include setting attributes or adding events within the span.
```js
span.setAttribute('key', 'value');
span.addEvent('eventName', { 'eventAttribute': 'value' });
```
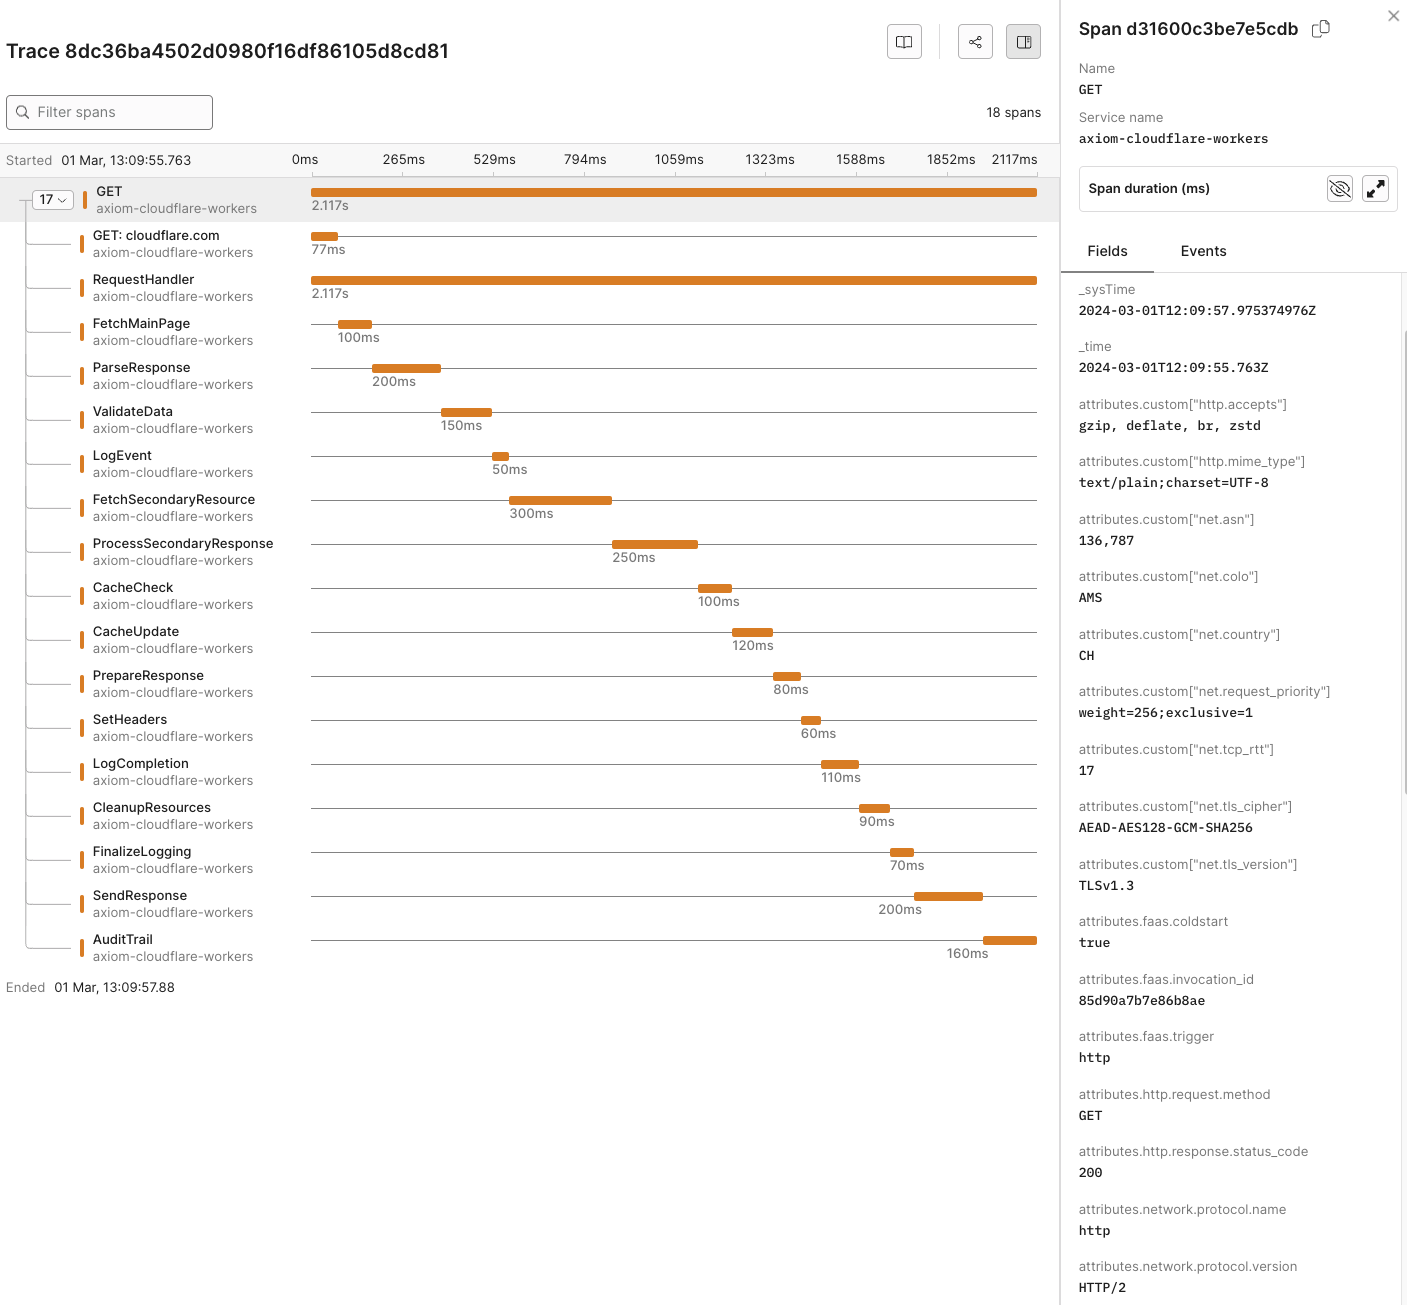
## Automatic Instrumentation [#automatic-instrumentation]
Automatic instrumentation uses the **`@microlabs/otel-cf-workers`** package to automatically trace incoming requests and outbound fetch calls without manual span management.
1. Instrument your Worker:
Wrap your Cloudflare Workers script with the `instrument` function from the **`@microlabs/otel-cf-workers`** package. This automatically instruments incoming requests and outbound fetch calls.
```js
import { instrument } from '@microlabs/otel-cf-workers';
export default instrument(yourHandler, yourConfig);
```
2. Configuration: Provide configuration details, including how to export telemetry data and service metadata to Axiom as part of the `instrument` function call.
```js
const config = (env) => ({
exporter: {
url: 'https://AXIOM_DOMAIN/v1/traces',
headers: {
'Authorization': `Bearer ${env.AXIOM_TOKEN}`,
'X-Axiom-Dataset': `${env.AXIOM_DATASET}`
},
},
service: { name: 'axiom-cloudflare-workers' },
});
```
**Working with Cloudflare Pages Functions:** Integration with OpenTelemetry is similar to Workers but uses the Cloudflare Dashboard for configuration, bypassing **`wrangler.toml`**. This simplifies setup through the Cloudflare dashboard web interface.
## Manual Instrumentation [#manual-instrumentation]
Manual instrumentation requires adding code into your Worker’s script to create and manage spans around the code blocks you want to trace.
1. Initialize Tracer:
Use the OpenTelemetry API to create a tracer instance at the beginning of your script using the **`@microlabs/otel-cf-workers`** package.
```js
import { trace } from '@opentelemetry/api';
const tracer = trace.getTracer('your-service-name');
```
2. Create start and end Spans:
Manually start spans before the operations or events you want to trace and ensure you end them afterward to complete the tracing lifecycle.
```js
const span = tracer.startSpan('operationName');
try {
// Your operation code here
} finally {
span.end();
}
```
3. Annotate Spans:
Add important metadata to spans to provide additional context. This can include setting attributes or adding events within the span.
```js
span.setAttribute('key', 'value');
span.addEvent('eventName', { 'eventAttribute': 'value' });
```
## Automatic Instrumentation [#automatic-instrumentation]
Automatic instrumentation uses the **`@microlabs/otel-cf-workers`** package to automatically trace incoming requests and outbound fetch calls without manual span management.
1. Instrument your Worker:
Wrap your Cloudflare Workers script with the `instrument` function from the **`@microlabs/otel-cf-workers`** package. This automatically instruments incoming requests and outbound fetch calls.
```js
import { instrument } from '@microlabs/otel-cf-workers';
export default instrument(yourHandler, yourConfig);
```
2. Configuration: Provide configuration details, including how to export telemetry data and service metadata to Axiom as part of the `instrument` function call.
```js
const config = (env) => ({
exporter: {
url: 'https://AXIOM_DOMAIN/v1/traces',
headers: {
'Authorization': `Bearer ${env.AXIOM_TOKEN}`,
'X-Axiom-Dataset': `${env.AXIOM_DATASET}`
},
},
service: { name: 'axiom-cloudflare-workers' },
});
```
 ## Dynamic OpenTelemetry traces dashboard [#dynamic-opentelemetry-traces-dashboard]
This data can then be further viewed and analyzed in Axiom’s dashboard, providing insights into the performance and behavior of your app.
## Dynamic OpenTelemetry traces dashboard [#dynamic-opentelemetry-traces-dashboard]
This data can then be further viewed and analyzed in Axiom’s dashboard, providing insights into the performance and behavior of your app.
 ## Send data from an existing Golang project [#send-data-from-an-existing-golang-project]
### Manual Instrumentation [#manual-instrumentation]
Manual instrumentation in Go involves managing spans within your code to track operations and events. This method offers precise control over what is instrumented and how spans are configured.
1. Initialize the tracer:
Use the OpenTelemetry API to obtain a tracer instance. This tracer will be used to start and manage spans.
```go
tracer := otel.Tracer("serviceName")
```
2. Create and manage spans:
Manually start spans before the operations you want to trace and ensure they're ended after the operations complete.
```go
ctx, span := tracer.Start(context.Background(), "operationName")
defer span.End()
// Perform the operation here
```
3. Annotate spans:
Enhance spans with additional information using attributes or events to provide more context about the traced operation.
```go
span.SetAttributes(attribute.String("key", "value"))
span.AddEvent("eventName", trace.WithAttributes(attribute.String("key", "value")))
```
### Automatic Instrumentation [#automatic-instrumentation]
Automatic instrumentation in Go uses libraries and integrations that automatically create spans for operations, simplifying the addition of observability to your app.
1. Instrumentation libraries:
Use `OpenTelemetry-contrib` libraries designed for automatic instrumentation of standard Go frameworks and libraries, such as `net/http`.
```go
import "go.opentelemetry.io/contrib/instrumentation/net/http/otelhttp"
```
2. Wrap handlers and clients:
Automatically instrument HTTP servers and clients by wrapping them with OpenTelemetry’s instrumentation. For HTTP servers, wrap your handlers with `otelhttp.NewHandler`.
```go
http.Handle("/path", otelhttp.NewHandler(handler, "operationName"))
```
3. Minimal code changes:
After setting up automatic instrumentation, no further changes are required for tracing standard operations. The instrumentation takes care of starting, managing, and ending spans.
## Reference [#reference]
### List of OpenTelemetry trace fields [#list-of-opentelemetry-trace-fields]
| Field Category | Field Name | Description |
| ---------------------------- | --------------------------------------- | ------------------------------------------------------------------- |
| **Unique Identifiers** | | |
| | \_rowid | Unique identifier for each row in the trace data. |
| | span\_id | Unique identifier for the span within the trace. |
| | trace\_id | Unique identifier for the entire trace. |
| **Timestamps** | | |
| | \_systime | System timestamp when the trace data was recorded. |
| | \_time | Timestamp when the actual event being traced occurred. |
| **HTTP Attributes** | | |
| | attributes.custom\["http.host"] | Host information where the HTTP request was sent. |
| | attributes.custom\["http.server\_name"] | Server name for the HTTP request. |
| | attributes.http.flavor | HTTP protocol version used. |
| | attributes.http.method | HTTP method used for the request. |
| | attributes.http.route | Route accessed during the HTTP request. |
| | attributes.http.scheme | Protocol scheme (HTTP/HTTPS). |
| | attributes.http.status\_code | HTTP response status code. |
| | attributes.http.target | Specific target of the HTTP request. |
| | attributes.http.user\_agent | User agent string of the client. |
| | attributes.custom.user\_agent.original | Original user agent string, providing client software and OS. |
| **Network Attributes** | | |
| | attributes.net.host.port | Port number on the host receiving the request. |
| | attributes.net.peer.port | Port number on the peer (client) side. |
| | attributes.custom\["net.peer.ip"] | IP address of the peer in the network interaction. |
| | attributes.net.sock.peer.addr | Socket peer address, indicating the IP version used. |
| | attributes.net.sock.peer.port | Socket peer port number. |
| | attributes.custom.net.protocol.version | Protocol version used in the network interaction. |
| **Operational Details** | | |
| | duration | Time taken for the operation. |
| | kind | Type of span (for example,, server, client). |
| | name | Name of the span. |
| | scope | Instrumentation scope. |
| | service.name | Name of the service generating the trace. |
| | service.version | Version of the service generating the trace. |
| **Resource Attributes** | | |
| | resource.environment | Environment where the trace was captured, for example,, production. |
| | attributes.custom.http.wrote\_bytes | Number of bytes written in the HTTP response. |
| **Telemetry SDK Attributes** | | |
| | telemetry.sdk.language | Language of the telemetry SDK (if previously not included). |
| | telemetry.sdk.name | Name of the telemetry SDK (if previously not included). |
| | telemetry.sdk.version | Version of the telemetry SDK (if previously not included). |
### List of imported libraries [#list-of-imported-libraries]
### OpenTelemetry Go SDK [#opentelemetry-go-sdk]
**`go.opentelemetry.io/otel`**
This is the core SDK for OpenTelemetry in Go. It provides the necessary tools to create and manage telemetry data (traces, metrics, and logs).
### OTLP Trace Exporter [#otlp-trace-exporter]
**`go.opentelemetry.io/otel/exporters/otlp/otlptrace/otlptracehttp`**
This package allows your app to export telemetry data over HTTP using the OpenTelemetry Protocol (OTLP). It’s important for sending data to Axiom or any other backend that supports OTLP.
### Resource and Trace Packages [#resource-and-trace-packages]
**`go.opentelemetry.io/otel/sdk/resource`** and **`go.opentelemetry.io/otel/sdk/trace`**
These packages help define the properties of your telemetry data, such as service name and version, and manage trace data within your app.
### Semantic Conventions [#semantic-conventions]
**`go.opentelemetry.io/otel/semconv/v1.24.0`**
This package provides standardized schema URLs and attributes, ensuring consistency across different OpenTelemetry implementations.
### Tracing API [#tracing-api]
**`go.opentelemetry.io/otel/trace`**
This package offers the API for tracing. It enables you to create spans, record events, and manage context propagation in your app.
### HTTP Instrumentation [#http-instrumentation]
**`go.opentelemetry.io/contrib/instrumentation/net/http/otelhttp`**
Used for instrumenting HTTP clients and servers. It automatically records data about HTTP requests and responses, which is essential for web apps.
### Propagators [#propagators]
**`go.opentelemetry.io/otel/propagation`**
This package provides the ability to propagate context and trace information across service boundaries.
---
# Send data from Java app using OpenTelemetry
Source: https://axiom.co/docs/guides/opentelemetry-java
OpenTelemetry provides a unified approach to collecting telemetry data from your Java applications. This page demonstrates how to configure OpenTelemetry in a Java app to send telemetry data to Axiom using the OpenTelemetry SDK.
## Send data from an existing Golang project [#send-data-from-an-existing-golang-project]
### Manual Instrumentation [#manual-instrumentation]
Manual instrumentation in Go involves managing spans within your code to track operations and events. This method offers precise control over what is instrumented and how spans are configured.
1. Initialize the tracer:
Use the OpenTelemetry API to obtain a tracer instance. This tracer will be used to start and manage spans.
```go
tracer := otel.Tracer("serviceName")
```
2. Create and manage spans:
Manually start spans before the operations you want to trace and ensure they're ended after the operations complete.
```go
ctx, span := tracer.Start(context.Background(), "operationName")
defer span.End()
// Perform the operation here
```
3. Annotate spans:
Enhance spans with additional information using attributes or events to provide more context about the traced operation.
```go
span.SetAttributes(attribute.String("key", "value"))
span.AddEvent("eventName", trace.WithAttributes(attribute.String("key", "value")))
```
### Automatic Instrumentation [#automatic-instrumentation]
Automatic instrumentation in Go uses libraries and integrations that automatically create spans for operations, simplifying the addition of observability to your app.
1. Instrumentation libraries:
Use `OpenTelemetry-contrib` libraries designed for automatic instrumentation of standard Go frameworks and libraries, such as `net/http`.
```go
import "go.opentelemetry.io/contrib/instrumentation/net/http/otelhttp"
```
2. Wrap handlers and clients:
Automatically instrument HTTP servers and clients by wrapping them with OpenTelemetry’s instrumentation. For HTTP servers, wrap your handlers with `otelhttp.NewHandler`.
```go
http.Handle("/path", otelhttp.NewHandler(handler, "operationName"))
```
3. Minimal code changes:
After setting up automatic instrumentation, no further changes are required for tracing standard operations. The instrumentation takes care of starting, managing, and ending spans.
## Reference [#reference]
### List of OpenTelemetry trace fields [#list-of-opentelemetry-trace-fields]
| Field Category | Field Name | Description |
| ---------------------------- | --------------------------------------- | ------------------------------------------------------------------- |
| **Unique Identifiers** | | |
| | \_rowid | Unique identifier for each row in the trace data. |
| | span\_id | Unique identifier for the span within the trace. |
| | trace\_id | Unique identifier for the entire trace. |
| **Timestamps** | | |
| | \_systime | System timestamp when the trace data was recorded. |
| | \_time | Timestamp when the actual event being traced occurred. |
| **HTTP Attributes** | | |
| | attributes.custom\["http.host"] | Host information where the HTTP request was sent. |
| | attributes.custom\["http.server\_name"] | Server name for the HTTP request. |
| | attributes.http.flavor | HTTP protocol version used. |
| | attributes.http.method | HTTP method used for the request. |
| | attributes.http.route | Route accessed during the HTTP request. |
| | attributes.http.scheme | Protocol scheme (HTTP/HTTPS). |
| | attributes.http.status\_code | HTTP response status code. |
| | attributes.http.target | Specific target of the HTTP request. |
| | attributes.http.user\_agent | User agent string of the client. |
| | attributes.custom.user\_agent.original | Original user agent string, providing client software and OS. |
| **Network Attributes** | | |
| | attributes.net.host.port | Port number on the host receiving the request. |
| | attributes.net.peer.port | Port number on the peer (client) side. |
| | attributes.custom\["net.peer.ip"] | IP address of the peer in the network interaction. |
| | attributes.net.sock.peer.addr | Socket peer address, indicating the IP version used. |
| | attributes.net.sock.peer.port | Socket peer port number. |
| | attributes.custom.net.protocol.version | Protocol version used in the network interaction. |
| **Operational Details** | | |
| | duration | Time taken for the operation. |
| | kind | Type of span (for example,, server, client). |
| | name | Name of the span. |
| | scope | Instrumentation scope. |
| | service.name | Name of the service generating the trace. |
| | service.version | Version of the service generating the trace. |
| **Resource Attributes** | | |
| | resource.environment | Environment where the trace was captured, for example,, production. |
| | attributes.custom.http.wrote\_bytes | Number of bytes written in the HTTP response. |
| **Telemetry SDK Attributes** | | |
| | telemetry.sdk.language | Language of the telemetry SDK (if previously not included). |
| | telemetry.sdk.name | Name of the telemetry SDK (if previously not included). |
| | telemetry.sdk.version | Version of the telemetry SDK (if previously not included). |
### List of imported libraries [#list-of-imported-libraries]
### OpenTelemetry Go SDK [#opentelemetry-go-sdk]
**`go.opentelemetry.io/otel`**
This is the core SDK for OpenTelemetry in Go. It provides the necessary tools to create and manage telemetry data (traces, metrics, and logs).
### OTLP Trace Exporter [#otlp-trace-exporter]
**`go.opentelemetry.io/otel/exporters/otlp/otlptrace/otlptracehttp`**
This package allows your app to export telemetry data over HTTP using the OpenTelemetry Protocol (OTLP). It’s important for sending data to Axiom or any other backend that supports OTLP.
### Resource and Trace Packages [#resource-and-trace-packages]
**`go.opentelemetry.io/otel/sdk/resource`** and **`go.opentelemetry.io/otel/sdk/trace`**
These packages help define the properties of your telemetry data, such as service name and version, and manage trace data within your app.
### Semantic Conventions [#semantic-conventions]
**`go.opentelemetry.io/otel/semconv/v1.24.0`**
This package provides standardized schema URLs and attributes, ensuring consistency across different OpenTelemetry implementations.
### Tracing API [#tracing-api]
**`go.opentelemetry.io/otel/trace`**
This package offers the API for tracing. It enables you to create spans, record events, and manage context propagation in your app.
### HTTP Instrumentation [#http-instrumentation]
**`go.opentelemetry.io/contrib/instrumentation/net/http/otelhttp`**
Used for instrumenting HTTP clients and servers. It automatically records data about HTTP requests and responses, which is essential for web apps.
### Propagators [#propagators]
**`go.opentelemetry.io/otel/propagation`**
This package provides the ability to propagate context and trace information across service boundaries.
---
# Send data from Java app using OpenTelemetry
Source: https://axiom.co/docs/guides/opentelemetry-java
OpenTelemetry provides a unified approach to collecting telemetry data from your Java applications. This page demonstrates how to configure OpenTelemetry in a Java app to send telemetry data to Axiom using the OpenTelemetry SDK.
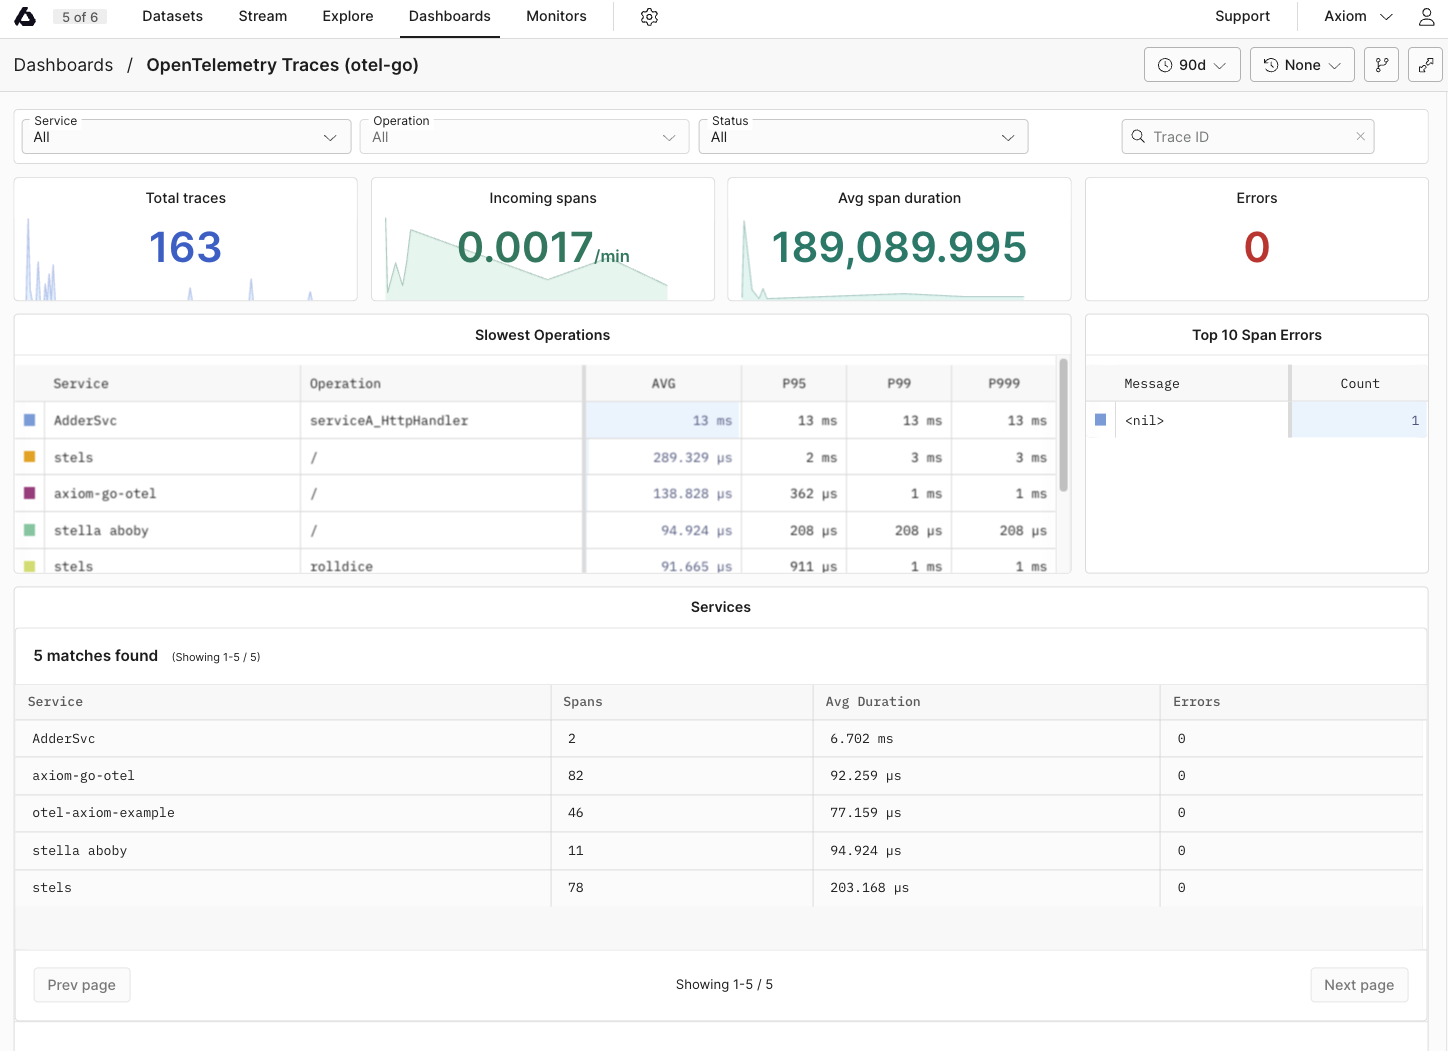
 ## Dynamic OpenTelemetry traces dashboard [#dynamic-opentelemetry-traces-dashboard]
This data can then be further viewed and analyzed in Axiom’s dashboard, providing insights into the performance and behaviour of your app.
## Dynamic OpenTelemetry traces dashboard [#dynamic-opentelemetry-traces-dashboard]
This data can then be further viewed and analyzed in Axiom’s dashboard, providing insights into the performance and behaviour of your app.
 ## Send data from an existing Node project [#send-data-from-an-existing-node-project]
### Manual Instrumentation [#manual-instrumentation]
Manual instrumentation in Node.js requires adding code to create and manage spans around the code blocks you want to trace.
1. Initialize Tracer:
Import and configure a tracer in your Node.js app. Use the tracer configured in your instrumentation setup (instrumentation.ts).
```js
// Assuming OpenTelemetry SDK is already configured
const { trace } = require('@opentelemetry/api');
const tracer = trace.getTracer('example-tracer');
```
2. Create Spans:
Wrap the code blocks that you want to trace with spans. Start and end these spans within your code.
```js
const span = tracer.startSpan('operation_name');
try {
// Your code here
span.end();
} catch (error) {
span.recordException(error);
span.end();
}
```
3. Annotate Spans:
Add metadata and logs to your spans for the trace data.
```js
span.setAttribute('key', 'value');
span.addEvent('event name', { eventKey: 'eventValue' });
```
### Automatic Instrumentation [#automatic-instrumentation]
Automatic instrumentation in Node.js simplifies adding telemetry data to your app. It uses pre-built libraries to automatically instrument common frameworks and libraries.
1. Install Instrumentation Libraries:
Use OpenTelemetry packages that automatically instrument common Node.js frameworks and libraries.
```bash
npm install @opentelemetry/auto-instrumentations-node
```
2. Instrument Application:
Configure your app to use these libraries, which will automatically generate spans for standard operations.
```js
// In your instrumentation setup (instrumentation.ts)
const { getNodeAutoInstrumentations } = require('@opentelemetry/auto-instrumentations-node');
const sdk = new NodeSDK({
// ... other configurations ...
instrumentations: [getNodeAutoInstrumentations()]
});
```
After you set them up, these libraries automatically trace relevant operations without additional code changes in your app.
## Reference [#reference]
### List of OpenTelemetry trace fields [#list-of-opentelemetry-trace-fields]
| Field Category | Field Name | Description |
| ------------------------------- | --------------------------------------- | ------------------------------------------------------------ |
| **Unique Identifiers** | | |
| | \_rowid | Unique identifier for each row in the trace data. |
| | span\_id | Unique identifier for the span within the trace. |
| | trace\_id | Unique identifier for the entire trace. |
| **Timestamps** | | |
| | \_systime | System timestamp when the trace data was recorded. |
| | \_time | Timestamp when the actual event being traced occurred. |
| **HTTP Attributes** | | |
| | attributes.custom\["http.host"] | Host information where the HTTP request was sent. |
| | attributes.custom\["http.server\_name"] | Server name for the HTTP request. |
| | attributes.http.flavor | HTTP protocol version used. |
| | attributes.http.method | HTTP method used for the request. |
| | attributes.http.route | Route accessed during the HTTP request. |
| | attributes.http.scheme | Protocol scheme (HTTP/HTTPS). |
| | attributes.http.status\_code | HTTP response status code. |
| | attributes.http.target | Specific target of the HTTP request. |
| | attributes.http.user\_agent | User agent string of the client. |
| **Network Attributes** | | |
| | attributes.net.host.port | Port number on the host receiving the request. |
| | attributes.net.peer.port | Port number on the peer (client) side. |
| | attributes.custom\["net.peer.ip"] | IP address of the peer in the network interaction. |
| **Operational Details** | | |
| | duration | Time taken for the operation. |
| | kind | Type of span (for example,, server, client). |
| | name | Name of the span. |
| | scope | Instrumentation scope. |
| | service.name | Name of the service generating the trace. |
| **Resource Process Attributes** | | |
| | resource.process.command | Command line string used to start the process. |
| | resource.process.command\_args | List of command line arguments used in starting the process. |
| | resource.process.executable.name | Name of the executable running the process. |
| | resource.process.executable.path | Path to the executable running the process. |
| | resource.process.owner | Owner of the process. |
| | resource.process.pid | Process ID. |
| | resource.process.runtime.description | Description of the runtime environment. |
| | resource.process.runtime.name | Name of the runtime environment. |
| | resource.process.runtime.version | Version of the runtime environment. |
| **Telemetry SDK Attributes** | | |
| | telemetry.sdk.language | Language of the telemetry SDK. |
| | telemetry.sdk.name | Name of the telemetry SDK. |
| | telemetry.sdk.version | Version of the telemetry SDK. |
### List of imported libraries [#list-of-imported-libraries]
The `instrumentation.ts` file imports the following libraries:
### **`@opentelemetry/sdk-node`** [#opentelemetrysdk-node]
This package is the core SDK for OpenTelemetry in Node.js. It provides the primary interface for configuring and initializing OpenTelemetry in a Node.js app. It includes functionalities for managing traces and context propagation. The SDK is designed to be extensible, allowing for custom configurations and integration with different telemetry backends like Axiom.
### **`@opentelemetry/auto-instrumentations-node`** [#opentelemetryauto-instrumentations-node]
This package offers automatic instrumentation for Node.js apps. It simplifies the process of instrumenting various common Node.js libraries and frameworks. By using this package, developers can automatically collect telemetry data (such as traces) from their apps without needing to manually instrument each library or API call. This is important for apps with complex dependencies, as it ensures comprehensive and consistent telemetry collection across the app.
### **`@opentelemetry/exporter-trace-otlp-proto`** [#opentelemetryexporter-trace-otlp-proto]
The **`@opentelemetry/exporter-trace-otlp-proto`** package provides an exporter that sends trace data using the OpenTelemetry Protocol (OTLP). OTLP is the standard protocol for transmitting telemetry data in the OpenTelemetry ecosystem. This exporter allows Node.js apps to send their collected traces to any backend that supports OTLP, such as Axiom. The use of OTLP ensures broad compatibility and a standardized way of transmitting telemetry data.
### **`@opentelemetry/sdk-trace-base`** [#opentelemetrysdk-trace-base]
Contained within this package is the **`BatchSpanProcessor`**, among other foundational elements for tracing in OpenTelemetry. The **`BatchSpanProcessor`** is a component that collects and processes spans (individual units of trace data). As the name suggests, it batches these spans before sending them to the configured exporter (in this case, the `OTLPTraceExporter`). This batching mechanism is efficient as it reduces the number of outbound requests by aggregating multiple spans into fewer batches. It helps in the performance and scalability of trace data export in an OpenTelemetry-instrumented app.
---
# OpenTelemetry using Nuxt.js
Source: https://axiom.co/docs/guides/opentelemetry-nuxtjs
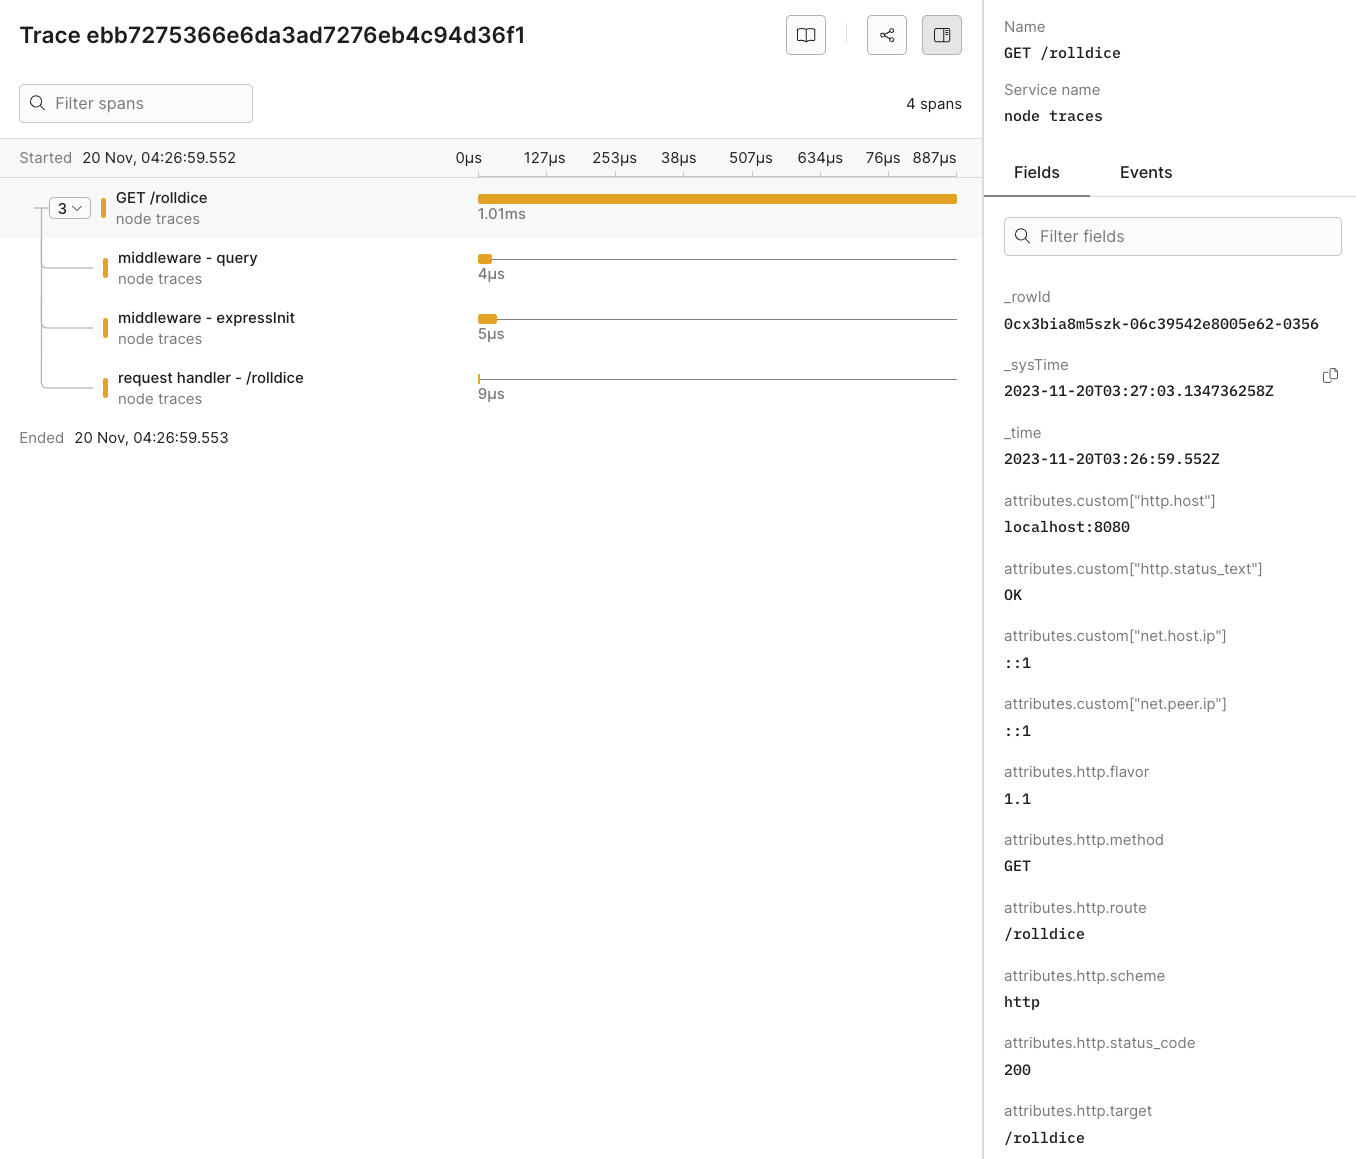
OpenTelemetry provides a [unified approach to collecting telemetry data](https://opentelemetry.io/docs/languages/js/instrumentation/) from your Nuxt.js and TypeScript apps. This page demonstrates how to configure OpenTelemetry in a Nuxt.js app to send telemetry data to Axiom using OpenTelemetry SDK.
## Send data from an existing Node project [#send-data-from-an-existing-node-project]
### Manual Instrumentation [#manual-instrumentation]
Manual instrumentation in Node.js requires adding code to create and manage spans around the code blocks you want to trace.
1. Initialize Tracer:
Import and configure a tracer in your Node.js app. Use the tracer configured in your instrumentation setup (instrumentation.ts).
```js
// Assuming OpenTelemetry SDK is already configured
const { trace } = require('@opentelemetry/api');
const tracer = trace.getTracer('example-tracer');
```
2. Create Spans:
Wrap the code blocks that you want to trace with spans. Start and end these spans within your code.
```js
const span = tracer.startSpan('operation_name');
try {
// Your code here
span.end();
} catch (error) {
span.recordException(error);
span.end();
}
```
3. Annotate Spans:
Add metadata and logs to your spans for the trace data.
```js
span.setAttribute('key', 'value');
span.addEvent('event name', { eventKey: 'eventValue' });
```
### Automatic Instrumentation [#automatic-instrumentation]
Automatic instrumentation in Node.js simplifies adding telemetry data to your app. It uses pre-built libraries to automatically instrument common frameworks and libraries.
1. Install Instrumentation Libraries:
Use OpenTelemetry packages that automatically instrument common Node.js frameworks and libraries.
```bash
npm install @opentelemetry/auto-instrumentations-node
```
2. Instrument Application:
Configure your app to use these libraries, which will automatically generate spans for standard operations.
```js
// In your instrumentation setup (instrumentation.ts)
const { getNodeAutoInstrumentations } = require('@opentelemetry/auto-instrumentations-node');
const sdk = new NodeSDK({
// ... other configurations ...
instrumentations: [getNodeAutoInstrumentations()]
});
```
After you set them up, these libraries automatically trace relevant operations without additional code changes in your app.
## Reference [#reference]
### List of OpenTelemetry trace fields [#list-of-opentelemetry-trace-fields]
| Field Category | Field Name | Description |
| ------------------------------- | --------------------------------------- | ------------------------------------------------------------ |
| **Unique Identifiers** | | |
| | \_rowid | Unique identifier for each row in the trace data. |
| | span\_id | Unique identifier for the span within the trace. |
| | trace\_id | Unique identifier for the entire trace. |
| **Timestamps** | | |
| | \_systime | System timestamp when the trace data was recorded. |
| | \_time | Timestamp when the actual event being traced occurred. |
| **HTTP Attributes** | | |
| | attributes.custom\["http.host"] | Host information where the HTTP request was sent. |
| | attributes.custom\["http.server\_name"] | Server name for the HTTP request. |
| | attributes.http.flavor | HTTP protocol version used. |
| | attributes.http.method | HTTP method used for the request. |
| | attributes.http.route | Route accessed during the HTTP request. |
| | attributes.http.scheme | Protocol scheme (HTTP/HTTPS). |
| | attributes.http.status\_code | HTTP response status code. |
| | attributes.http.target | Specific target of the HTTP request. |
| | attributes.http.user\_agent | User agent string of the client. |
| **Network Attributes** | | |
| | attributes.net.host.port | Port number on the host receiving the request. |
| | attributes.net.peer.port | Port number on the peer (client) side. |
| | attributes.custom\["net.peer.ip"] | IP address of the peer in the network interaction. |
| **Operational Details** | | |
| | duration | Time taken for the operation. |
| | kind | Type of span (for example,, server, client). |
| | name | Name of the span. |
| | scope | Instrumentation scope. |
| | service.name | Name of the service generating the trace. |
| **Resource Process Attributes** | | |
| | resource.process.command | Command line string used to start the process. |
| | resource.process.command\_args | List of command line arguments used in starting the process. |
| | resource.process.executable.name | Name of the executable running the process. |
| | resource.process.executable.path | Path to the executable running the process. |
| | resource.process.owner | Owner of the process. |
| | resource.process.pid | Process ID. |
| | resource.process.runtime.description | Description of the runtime environment. |
| | resource.process.runtime.name | Name of the runtime environment. |
| | resource.process.runtime.version | Version of the runtime environment. |
| **Telemetry SDK Attributes** | | |
| | telemetry.sdk.language | Language of the telemetry SDK. |
| | telemetry.sdk.name | Name of the telemetry SDK. |
| | telemetry.sdk.version | Version of the telemetry SDK. |
### List of imported libraries [#list-of-imported-libraries]
The `instrumentation.ts` file imports the following libraries:
### **`@opentelemetry/sdk-node`** [#opentelemetrysdk-node]
This package is the core SDK for OpenTelemetry in Node.js. It provides the primary interface for configuring and initializing OpenTelemetry in a Node.js app. It includes functionalities for managing traces and context propagation. The SDK is designed to be extensible, allowing for custom configurations and integration with different telemetry backends like Axiom.
### **`@opentelemetry/auto-instrumentations-node`** [#opentelemetryauto-instrumentations-node]
This package offers automatic instrumentation for Node.js apps. It simplifies the process of instrumenting various common Node.js libraries and frameworks. By using this package, developers can automatically collect telemetry data (such as traces) from their apps without needing to manually instrument each library or API call. This is important for apps with complex dependencies, as it ensures comprehensive and consistent telemetry collection across the app.
### **`@opentelemetry/exporter-trace-otlp-proto`** [#opentelemetryexporter-trace-otlp-proto]
The **`@opentelemetry/exporter-trace-otlp-proto`** package provides an exporter that sends trace data using the OpenTelemetry Protocol (OTLP). OTLP is the standard protocol for transmitting telemetry data in the OpenTelemetry ecosystem. This exporter allows Node.js apps to send their collected traces to any backend that supports OTLP, such as Axiom. The use of OTLP ensures broad compatibility and a standardized way of transmitting telemetry data.
### **`@opentelemetry/sdk-trace-base`** [#opentelemetrysdk-trace-base]
Contained within this package is the **`BatchSpanProcessor`**, among other foundational elements for tracing in OpenTelemetry. The **`BatchSpanProcessor`** is a component that collects and processes spans (individual units of trace data). As the name suggests, it batches these spans before sending them to the configured exporter (in this case, the `OTLPTraceExporter`). This batching mechanism is efficient as it reduces the number of outbound requests by aggregating multiple spans into fewer batches. It helps in the performance and scalability of trace data export in an OpenTelemetry-instrumented app.
---
# OpenTelemetry using Nuxt.js
Source: https://axiom.co/docs/guides/opentelemetry-nuxtjs
OpenTelemetry provides a [unified approach to collecting telemetry data](https://opentelemetry.io/docs/languages/js/instrumentation/) from your Nuxt.js and TypeScript apps. This page demonstrates how to configure OpenTelemetry in a Nuxt.js app to send telemetry data to Axiom using OpenTelemetry SDK.
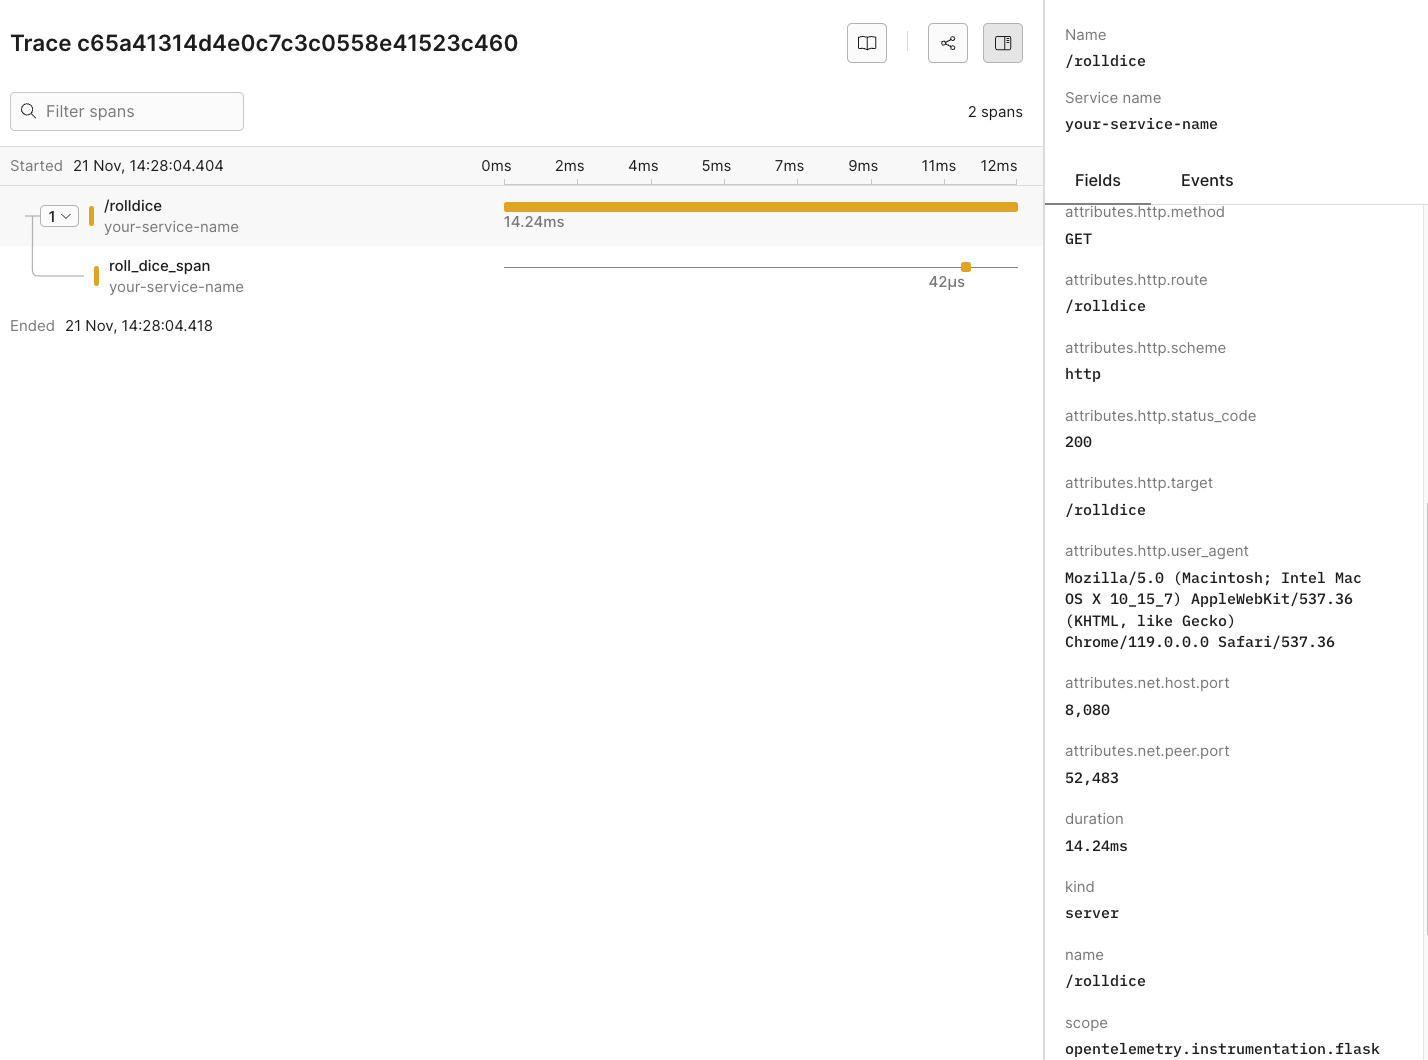 ## Dynamic OpenTelemetry traces dashboard [#dynamic-opentelemetry-traces-dashboard]
In Axiom, go the **Dashboards** tab and click **OpenTelemetry Traces (python)**. This pre-built traces dashboard provides further insights into the performance and behavior of your app.
## Dynamic OpenTelemetry traces dashboard [#dynamic-opentelemetry-traces-dashboard]
In Axiom, go the **Dashboards** tab and click **OpenTelemetry Traces (python)**. This pre-built traces dashboard provides further insights into the performance and behavior of your app.
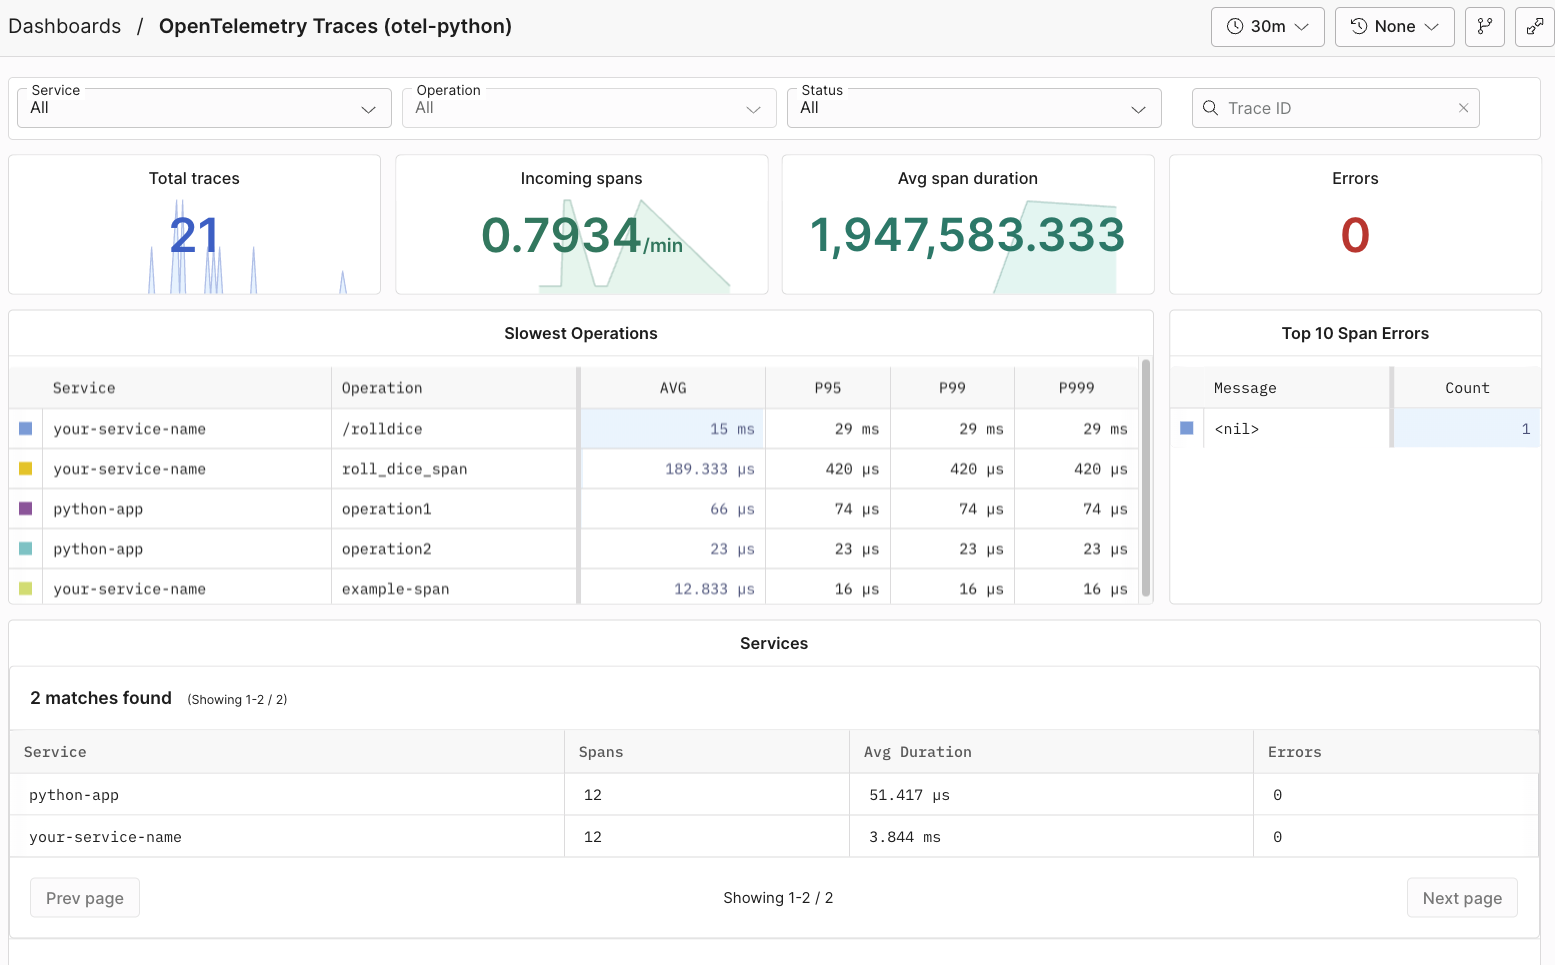 ## Send data from an existing Python project [#send-data-from-an-existing-python-project]
### Manual instrumentation [#manual-instrumentation]
Manual instrumentation in Python with OpenTelemetry involves adding code to create and manage spans around the blocks of code you want to trace. This approach allows for precise control over the trace data.
1. Import and configure a tracer at the start of your main Python file. For example, use the tracer from the `exporter.py` configuration.
```python
import exporter
tracer = exporter.service1_tracer
```
2. Enclose the code blocks in your app that you want to trace within spans. Start and end these spans in your code.
```python
with tracer.start_as_current_span("operation_name"):
```
3. Add relevant metadata and logs to your spans to enrich the trace data, providing more context for your data.
```python
with tracer.start_as_current_span("operation_name") as span:
span.set_attribute("key", "value")
```
### Automatic instrumentation [#automatic-instrumentation]
Automatic instrumentation in Python with OpenTelemetry simplifies the process of adding telemetry data to your app. It uses pre-built libraries that automatically instrument the frameworks and libraries.
1. Install the OpenTelemetry packages designed for specific frameworks like Flask or Django.
```bash
pip install opentelemetry-instrumentation-flask
```
2. Configure your app to use these libraries that automatically generate spans for standard operations.
```python
from opentelemetry.instrumentation.flask import FlaskInstrumentor
# This assumes `app` is your Flask app.
FlaskInstrumentor().instrument_app(app)
```
After you set them up, these libraries automatically trace relevant operations without additional code changes in your app.
## Reference [#reference]
### List of OpenTelemetry trace fields [#list-of-opentelemetry-trace-fields]
| Field Category | Field Name | Description |
| ------------------- | --------------------------------------- | ------------------------------------------------------ |
| Unique Identifiers | | |
| | \_rowid | Unique identifier for each row in the trace data. |
| | span\_id | Unique identifier for the span within the trace. |
| | trace\_id | Unique identifier for the entire trace. |
| Timestamps | | |
| | \_systime | System timestamp when the trace data was recorded. |
| | \_time | Timestamp when the actual event being traced occurred. |
| HTTP Attributes | | |
| | attributes.custom\["http.host"] | Host information where the HTTP request was sent. |
| | attributes.custom\["http.server\_name"] | Server name for the HTTP request. |
| | attributes.http.flavor | HTTP protocol version used. |
| | attributes.http.method | HTTP method used for the request. |
| | attributes.http.route | Route accessed during the HTTP request. |
| | attributes.http.scheme | Protocol scheme (HTTP/HTTPS). |
| | attributes.http.status\_code | HTTP response status code. |
| | attributes.http.target | Specific target of the HTTP request. |
| | attributes.http.user\_agent | User agent string of the client. |
| Network Attributes | | |
| | attributes.net.host.port | Port number on the host receiving the request. |
| | attributes.net.peer.port | Port number on the peer (client) side. |
| | attributes.custom\["net.peer.ip"] | IP address of the peer in the network interaction. |
| Operational Details | | |
| | duration | Time taken for the operation. |
| | kind | Type of span (for example,, server, client). |
| | name | Name of the span. |
| | scope | Instrumentation scope. |
| | service.name | Name of the service generating the trace. |
### List of imported libraries [#list-of-imported-libraries]
The `exporter.py` file imports the following libraries:
from opentelemetry import trace
This module creates and manages trace data in your app. It creates spans and tracers which track the execution flow and performance of your app.
from opentelemetry.sdk.trace import TracerProvider
`TracerProvider` acts as a container for the configuration of your app’s tracing behavior. It allows you to define how spans are generated and processed, essentially serving as the central point for managing trace creation and propagation in your app.
from opentelemetry.sdk.trace.export import BatchSpanProcessor
`BatchSpanProcessor` is responsible for batching spans before they're exported. This is an important aspect of efficient trace data management as it aggregates multiple spans into fewer network requests, reducing the overhead on your app’s performance and the tracing backend.
from opentelemetry.sdk.resources import Resource, SERVICE\_NAME
The `Resource` class is used to describe your app’s service attributes, such as its name, version, and environment. This contextual information is attached to the traces and helps in identifying and categorizing trace data, making it easier to filter and analyze in your monitoring setup.
from opentelemetry.exporter.otlp.proto.http.trace\_exporter import OTLPSpanExporter
The `OTLPSpanExporter` is responsible for sending your app’s trace data to a backend that supports the OTLP such as Axiom. It formats the trace data according to the OTLP standards and transmits it over HTTP, ensuring compatibility and standardization in how telemetry data is sent across different systems and services.
---
# Send OpenTelemetry data from a Ruby on Rails app to Axiom
Source: https://axiom.co/docs/guides/opentelemetry-ruby
This guide provides detailed steps on how to configure OpenTelemetry in a Ruby app to send telemetry data to Axiom using the [OpenTelemetry Ruby SDK](https://opentelemetry.io/docs/languages/ruby/).
## Send data from an existing Python project [#send-data-from-an-existing-python-project]
### Manual instrumentation [#manual-instrumentation]
Manual instrumentation in Python with OpenTelemetry involves adding code to create and manage spans around the blocks of code you want to trace. This approach allows for precise control over the trace data.
1. Import and configure a tracer at the start of your main Python file. For example, use the tracer from the `exporter.py` configuration.
```python
import exporter
tracer = exporter.service1_tracer
```
2. Enclose the code blocks in your app that you want to trace within spans. Start and end these spans in your code.
```python
with tracer.start_as_current_span("operation_name"):
```
3. Add relevant metadata and logs to your spans to enrich the trace data, providing more context for your data.
```python
with tracer.start_as_current_span("operation_name") as span:
span.set_attribute("key", "value")
```
### Automatic instrumentation [#automatic-instrumentation]
Automatic instrumentation in Python with OpenTelemetry simplifies the process of adding telemetry data to your app. It uses pre-built libraries that automatically instrument the frameworks and libraries.
1. Install the OpenTelemetry packages designed for specific frameworks like Flask or Django.
```bash
pip install opentelemetry-instrumentation-flask
```
2. Configure your app to use these libraries that automatically generate spans for standard operations.
```python
from opentelemetry.instrumentation.flask import FlaskInstrumentor
# This assumes `app` is your Flask app.
FlaskInstrumentor().instrument_app(app)
```
After you set them up, these libraries automatically trace relevant operations without additional code changes in your app.
## Reference [#reference]
### List of OpenTelemetry trace fields [#list-of-opentelemetry-trace-fields]
| Field Category | Field Name | Description |
| ------------------- | --------------------------------------- | ------------------------------------------------------ |
| Unique Identifiers | | |
| | \_rowid | Unique identifier for each row in the trace data. |
| | span\_id | Unique identifier for the span within the trace. |
| | trace\_id | Unique identifier for the entire trace. |
| Timestamps | | |
| | \_systime | System timestamp when the trace data was recorded. |
| | \_time | Timestamp when the actual event being traced occurred. |
| HTTP Attributes | | |
| | attributes.custom\["http.host"] | Host information where the HTTP request was sent. |
| | attributes.custom\["http.server\_name"] | Server name for the HTTP request. |
| | attributes.http.flavor | HTTP protocol version used. |
| | attributes.http.method | HTTP method used for the request. |
| | attributes.http.route | Route accessed during the HTTP request. |
| | attributes.http.scheme | Protocol scheme (HTTP/HTTPS). |
| | attributes.http.status\_code | HTTP response status code. |
| | attributes.http.target | Specific target of the HTTP request. |
| | attributes.http.user\_agent | User agent string of the client. |
| Network Attributes | | |
| | attributes.net.host.port | Port number on the host receiving the request. |
| | attributes.net.peer.port | Port number on the peer (client) side. |
| | attributes.custom\["net.peer.ip"] | IP address of the peer in the network interaction. |
| Operational Details | | |
| | duration | Time taken for the operation. |
| | kind | Type of span (for example,, server, client). |
| | name | Name of the span. |
| | scope | Instrumentation scope. |
| | service.name | Name of the service generating the trace. |
### List of imported libraries [#list-of-imported-libraries]
The `exporter.py` file imports the following libraries:
from opentelemetry import trace
This module creates and manages trace data in your app. It creates spans and tracers which track the execution flow and performance of your app.
from opentelemetry.sdk.trace import TracerProvider
`TracerProvider` acts as a container for the configuration of your app’s tracing behavior. It allows you to define how spans are generated and processed, essentially serving as the central point for managing trace creation and propagation in your app.
from opentelemetry.sdk.trace.export import BatchSpanProcessor
`BatchSpanProcessor` is responsible for batching spans before they're exported. This is an important aspect of efficient trace data management as it aggregates multiple spans into fewer network requests, reducing the overhead on your app’s performance and the tracing backend.
from opentelemetry.sdk.resources import Resource, SERVICE\_NAME
The `Resource` class is used to describe your app’s service attributes, such as its name, version, and environment. This contextual information is attached to the traces and helps in identifying and categorizing trace data, making it easier to filter and analyze in your monitoring setup.
from opentelemetry.exporter.otlp.proto.http.trace\_exporter import OTLPSpanExporter
The `OTLPSpanExporter` is responsible for sending your app’s trace data to a backend that supports the OTLP such as Axiom. It formats the trace data according to the OTLP standards and transmits it over HTTP, ensuring compatibility and standardization in how telemetry data is sent across different systems and services.
---
# Send OpenTelemetry data from a Ruby on Rails app to Axiom
Source: https://axiom.co/docs/guides/opentelemetry-ruby
This guide provides detailed steps on how to configure OpenTelemetry in a Ruby app to send telemetry data to Axiom using the [OpenTelemetry Ruby SDK](https://opentelemetry.io/docs/languages/ruby/).
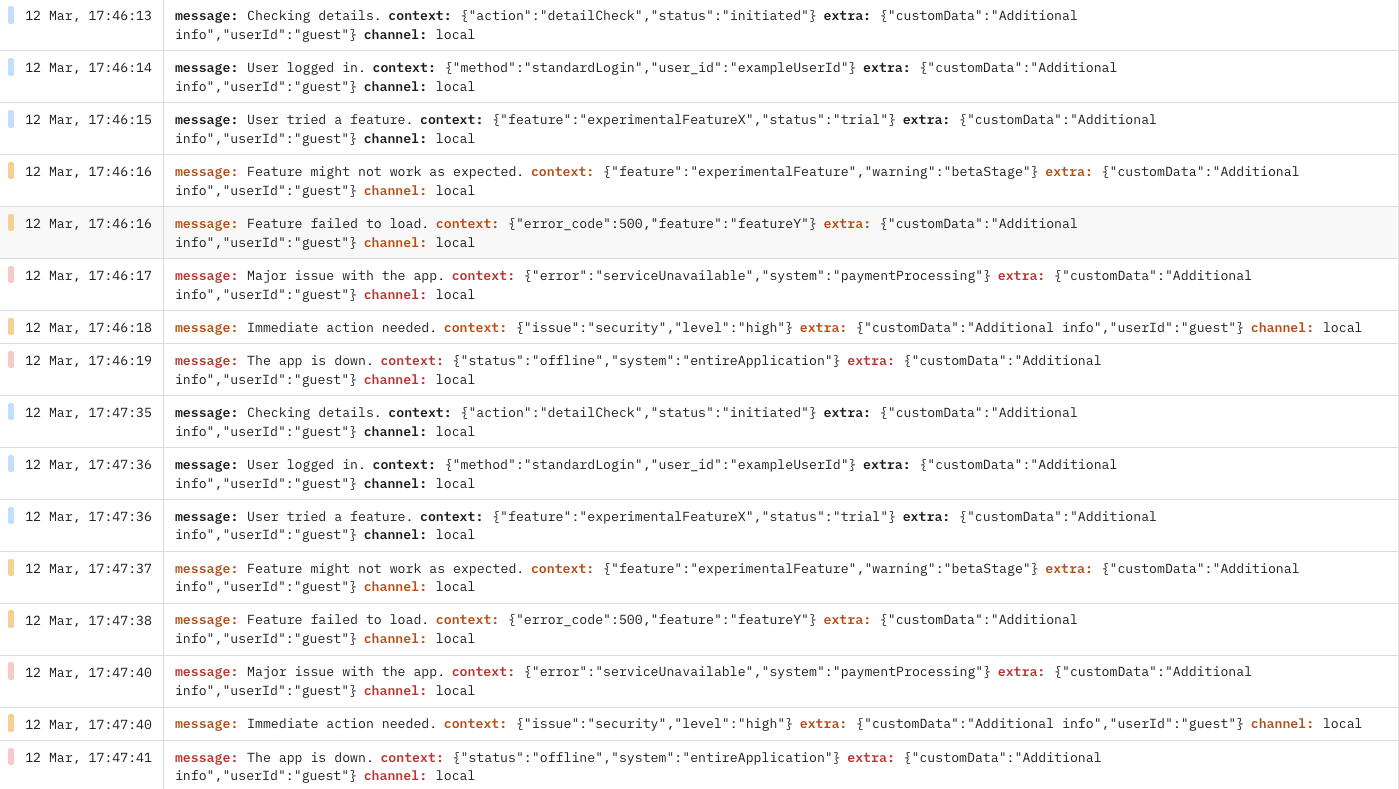 ## Conclusion [#conclusion]
This guide has introduced you to integrating Axiom for logging in Laravel apps. You’ve learned how to create a custom logger, configure log channels, and understand the significance of log levels. With this knowledge, you’re set to track errors and analyze log data effectively using Axiom.
---
# Send logs from a Ruby on Rails app using Faraday
Source: https://axiom.co/docs/guides/send-logs-from-ruby-on-rails
This guide provides step-by-step instructions on how to send logs from a Ruby on Rails app to Axiom using the Faraday library. By following this guide, you configure your Rails app to send logs to Axiom, allowing you to monitor and analyze your app logs effectively.
## Conclusion [#conclusion]
This guide has introduced you to integrating Axiom for logging in Laravel apps. You’ve learned how to create a custom logger, configure log channels, and understand the significance of log levels. With this knowledge, you’re set to track errors and analyze log data effectively using Axiom.
---
# Send logs from a Ruby on Rails app using Faraday
Source: https://axiom.co/docs/guides/send-logs-from-ruby-on-rails
This guide provides step-by-step instructions on how to send logs from a Ruby on Rails app to Axiom using the Faraday library. By following this guide, you configure your Rails app to send logs to Axiom, allowing you to monitor and analyze your app logs effectively.
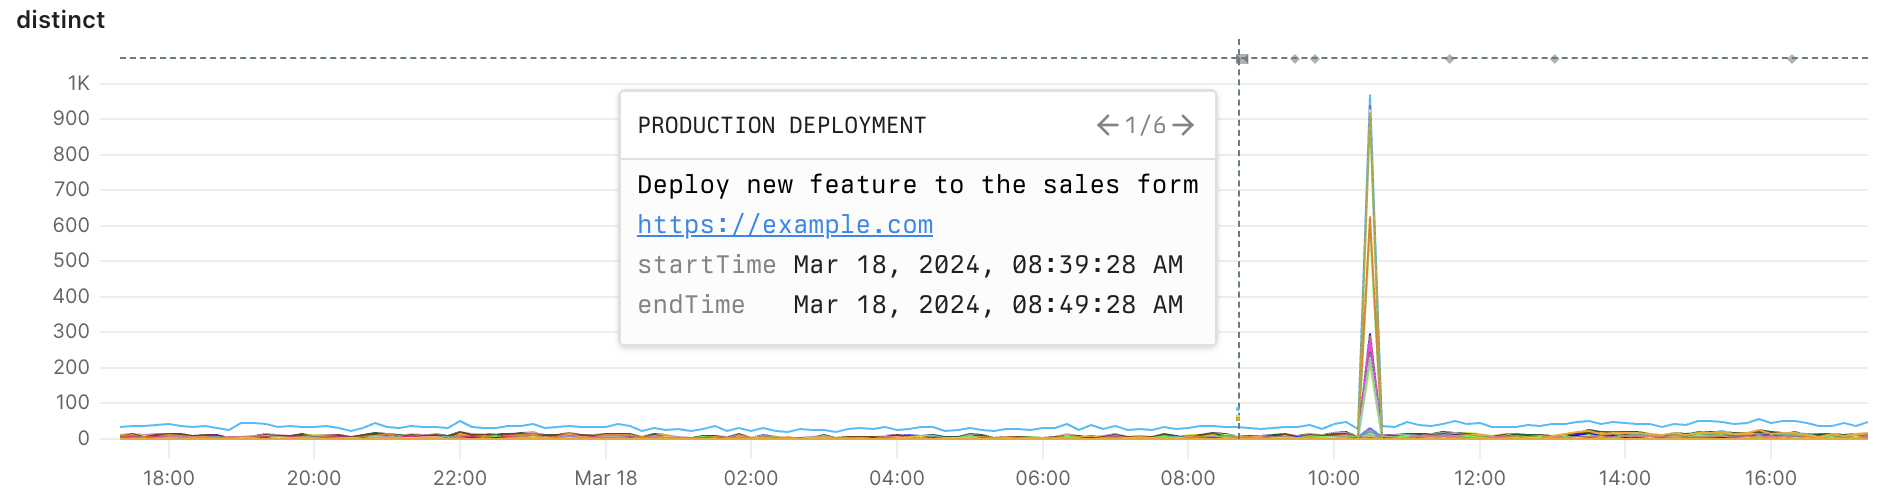 ### Inspect issue [#inspect-issue]
1. From the chart, you see that the number of errors started to rise after the deployment of a new feature to the sales form. This correlation allows you to form the hypothesis that the errors might be caused by the deployment.
2. You decide to investigate the deployment by clicking on the link associated with the annotation. The link takes you to the GitHub pull request.
3. You inspect the code changes in depth and discover the cause of the errors.
4. You quickly fix the issue in another deployment.
---
# Correlations
Source: https://axiom.co/docs/query-data/correlations
Correlations connect datasets that describe the same system from different telemetry signals. A correlation group records which logs, traces, and metrics datasets belong together.
Use correlations to move between related signals without manually copying IDs or rebuilding context in another query.
## What correlations are [#what-correlations-are]
A correlation group contains up to three datasets:
* **Logs dataset:** OpenTelemetry log records with trace context.
* **Traces dataset:** OpenTelemetry trace spans.
* **Metrics dataset:** OpenTelemetry metrics stored in MetricsDB.
Axiom uses the datasets in a correlation group to find related data during an investigation. For example, a log event that contains a trace ID links to the matching trace. A trace links back to log records from the correlated logs dataset. A span in a trace links to metrics from the correlated metrics dataset.
## Prerequisites [#prerequisites]
Before you create a correlation group, prepare the datasets that you plan to connect:
* Send logs, traces, and metrics to separate datasets.
* Use a dedicated OpenTelemetry metrics dataset for metrics.
* Ensure logs include `trace_id` and `span_id` for log-to-trace and trace-to-log navigation. This should happen by default if you use `Logger.emit` or the equivalent in your OpenTelemetry library.
* Use OpenTelemetry semantic conventions when possible
## Create a correlation group [#create-a-correlation-group]
1. In Axiom Console, go to **Datasets**.
2. Click **Correlations**.
3. Click **New correlation group**.
4. Enter a **Name**.
5. Enter a **Slug**.
6. Select one or more datasets:
* **Logs dataset**
* **Traces dataset**
* **Metrics dataset**
7. Click **Create correlation group**.
### Inspect issue [#inspect-issue]
1. From the chart, you see that the number of errors started to rise after the deployment of a new feature to the sales form. This correlation allows you to form the hypothesis that the errors might be caused by the deployment.
2. You decide to investigate the deployment by clicking on the link associated with the annotation. The link takes you to the GitHub pull request.
3. You inspect the code changes in depth and discover the cause of the errors.
4. You quickly fix the issue in another deployment.
---
# Correlations
Source: https://axiom.co/docs/query-data/correlations
Correlations connect datasets that describe the same system from different telemetry signals. A correlation group records which logs, traces, and metrics datasets belong together.
Use correlations to move between related signals without manually copying IDs or rebuilding context in another query.
## What correlations are [#what-correlations-are]
A correlation group contains up to three datasets:
* **Logs dataset:** OpenTelemetry log records with trace context.
* **Traces dataset:** OpenTelemetry trace spans.
* **Metrics dataset:** OpenTelemetry metrics stored in MetricsDB.
Axiom uses the datasets in a correlation group to find related data during an investigation. For example, a log event that contains a trace ID links to the matching trace. A trace links back to log records from the correlated logs dataset. A span in a trace links to metrics from the correlated metrics dataset.
## Prerequisites [#prerequisites]
Before you create a correlation group, prepare the datasets that you plan to connect:
* Send logs, traces, and metrics to separate datasets.
* Use a dedicated OpenTelemetry metrics dataset for metrics.
* Ensure logs include `trace_id` and `span_id` for log-to-trace and trace-to-log navigation. This should happen by default if you use `Logger.emit` or the equivalent in your OpenTelemetry library.
* Use OpenTelemetry semantic conventions when possible
## Create a correlation group [#create-a-correlation-group]
1. In Axiom Console, go to **Datasets**.
2. Click **Correlations**.
3. Click **New correlation group**.
4. Enter a **Name**.
5. Enter a **Slug**.
6. Select one or more datasets:
* **Logs dataset**
* **Traces dataset**
* **Metrics dataset**
7. Click **Create correlation group**.
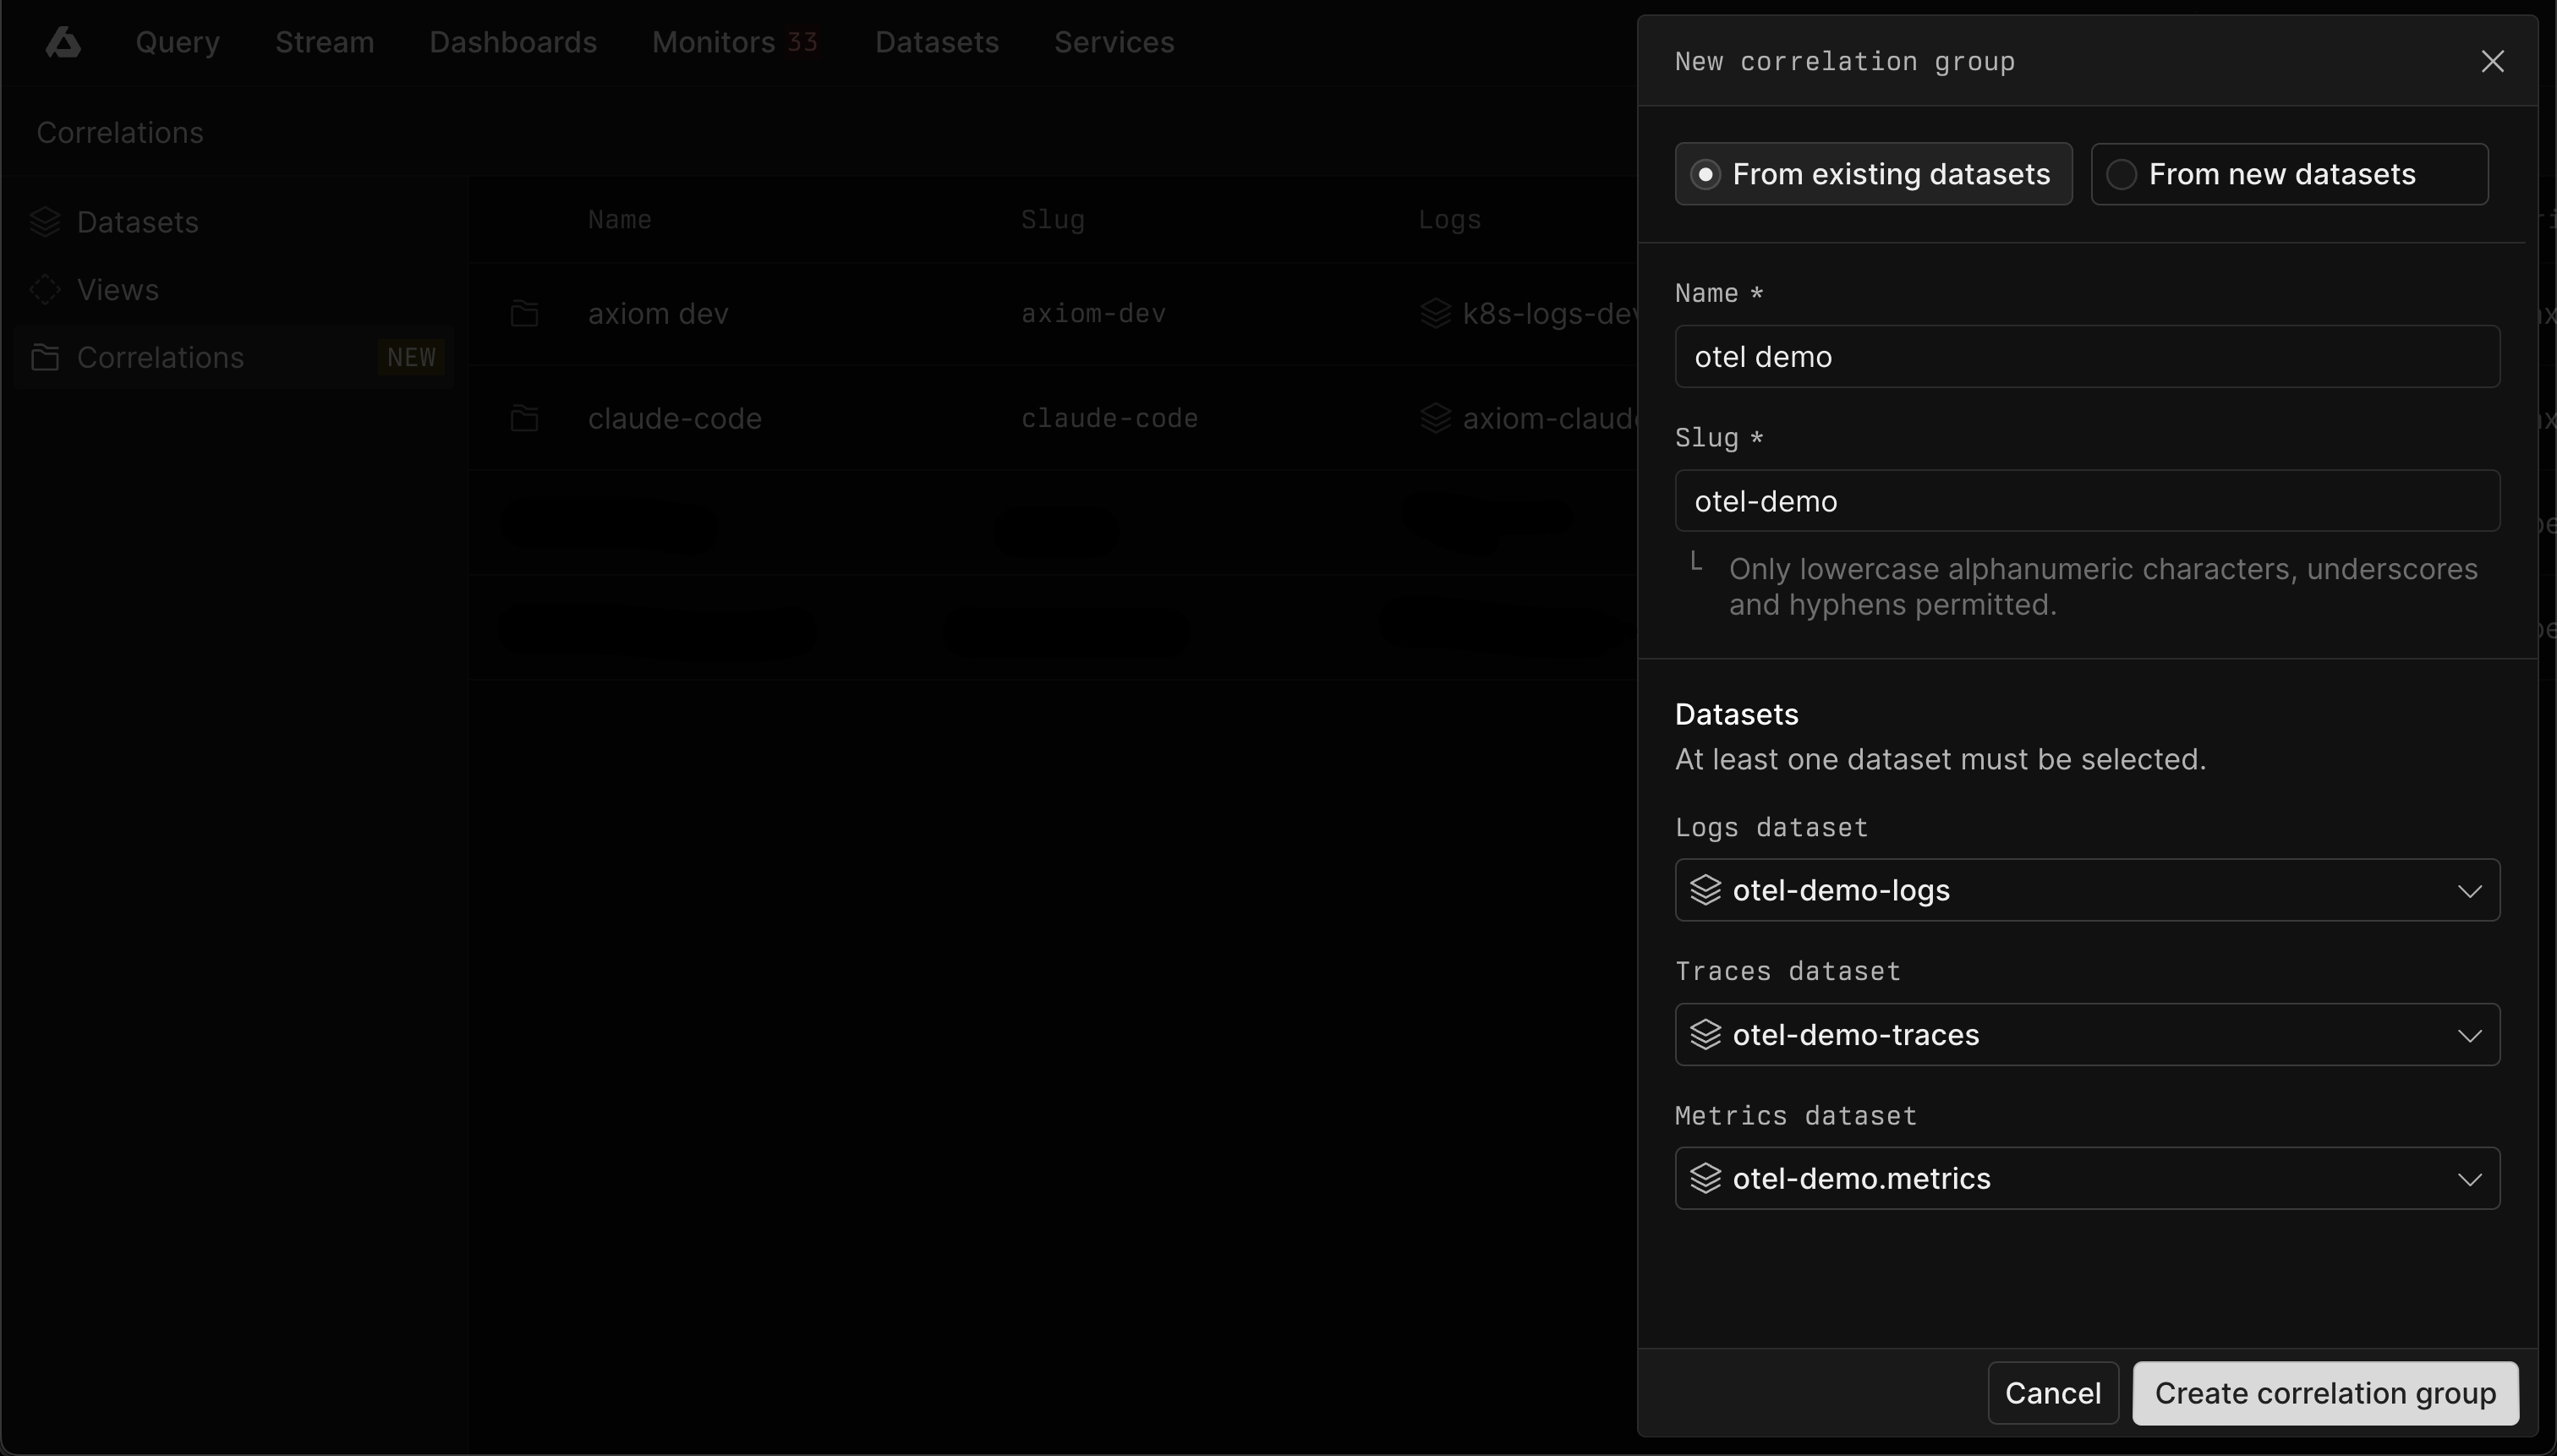 Alternatively, you can create a correlation group from new datasets. This will create logs, traces, and metrics datasets with a prefix and optional suffix of your choice, and create a correlation group that contains them.
## Use correlations [#use-correlations]
Use correlations from query results and trace details to move between telemetry signals.
Alternatively, you can create a correlation group from new datasets. This will create logs, traces, and metrics datasets with a prefix and optional suffix of your choice, and create a correlation group that contains them.
## Use correlations [#use-correlations]
Use correlations from query results and trace details to move between telemetry signals.
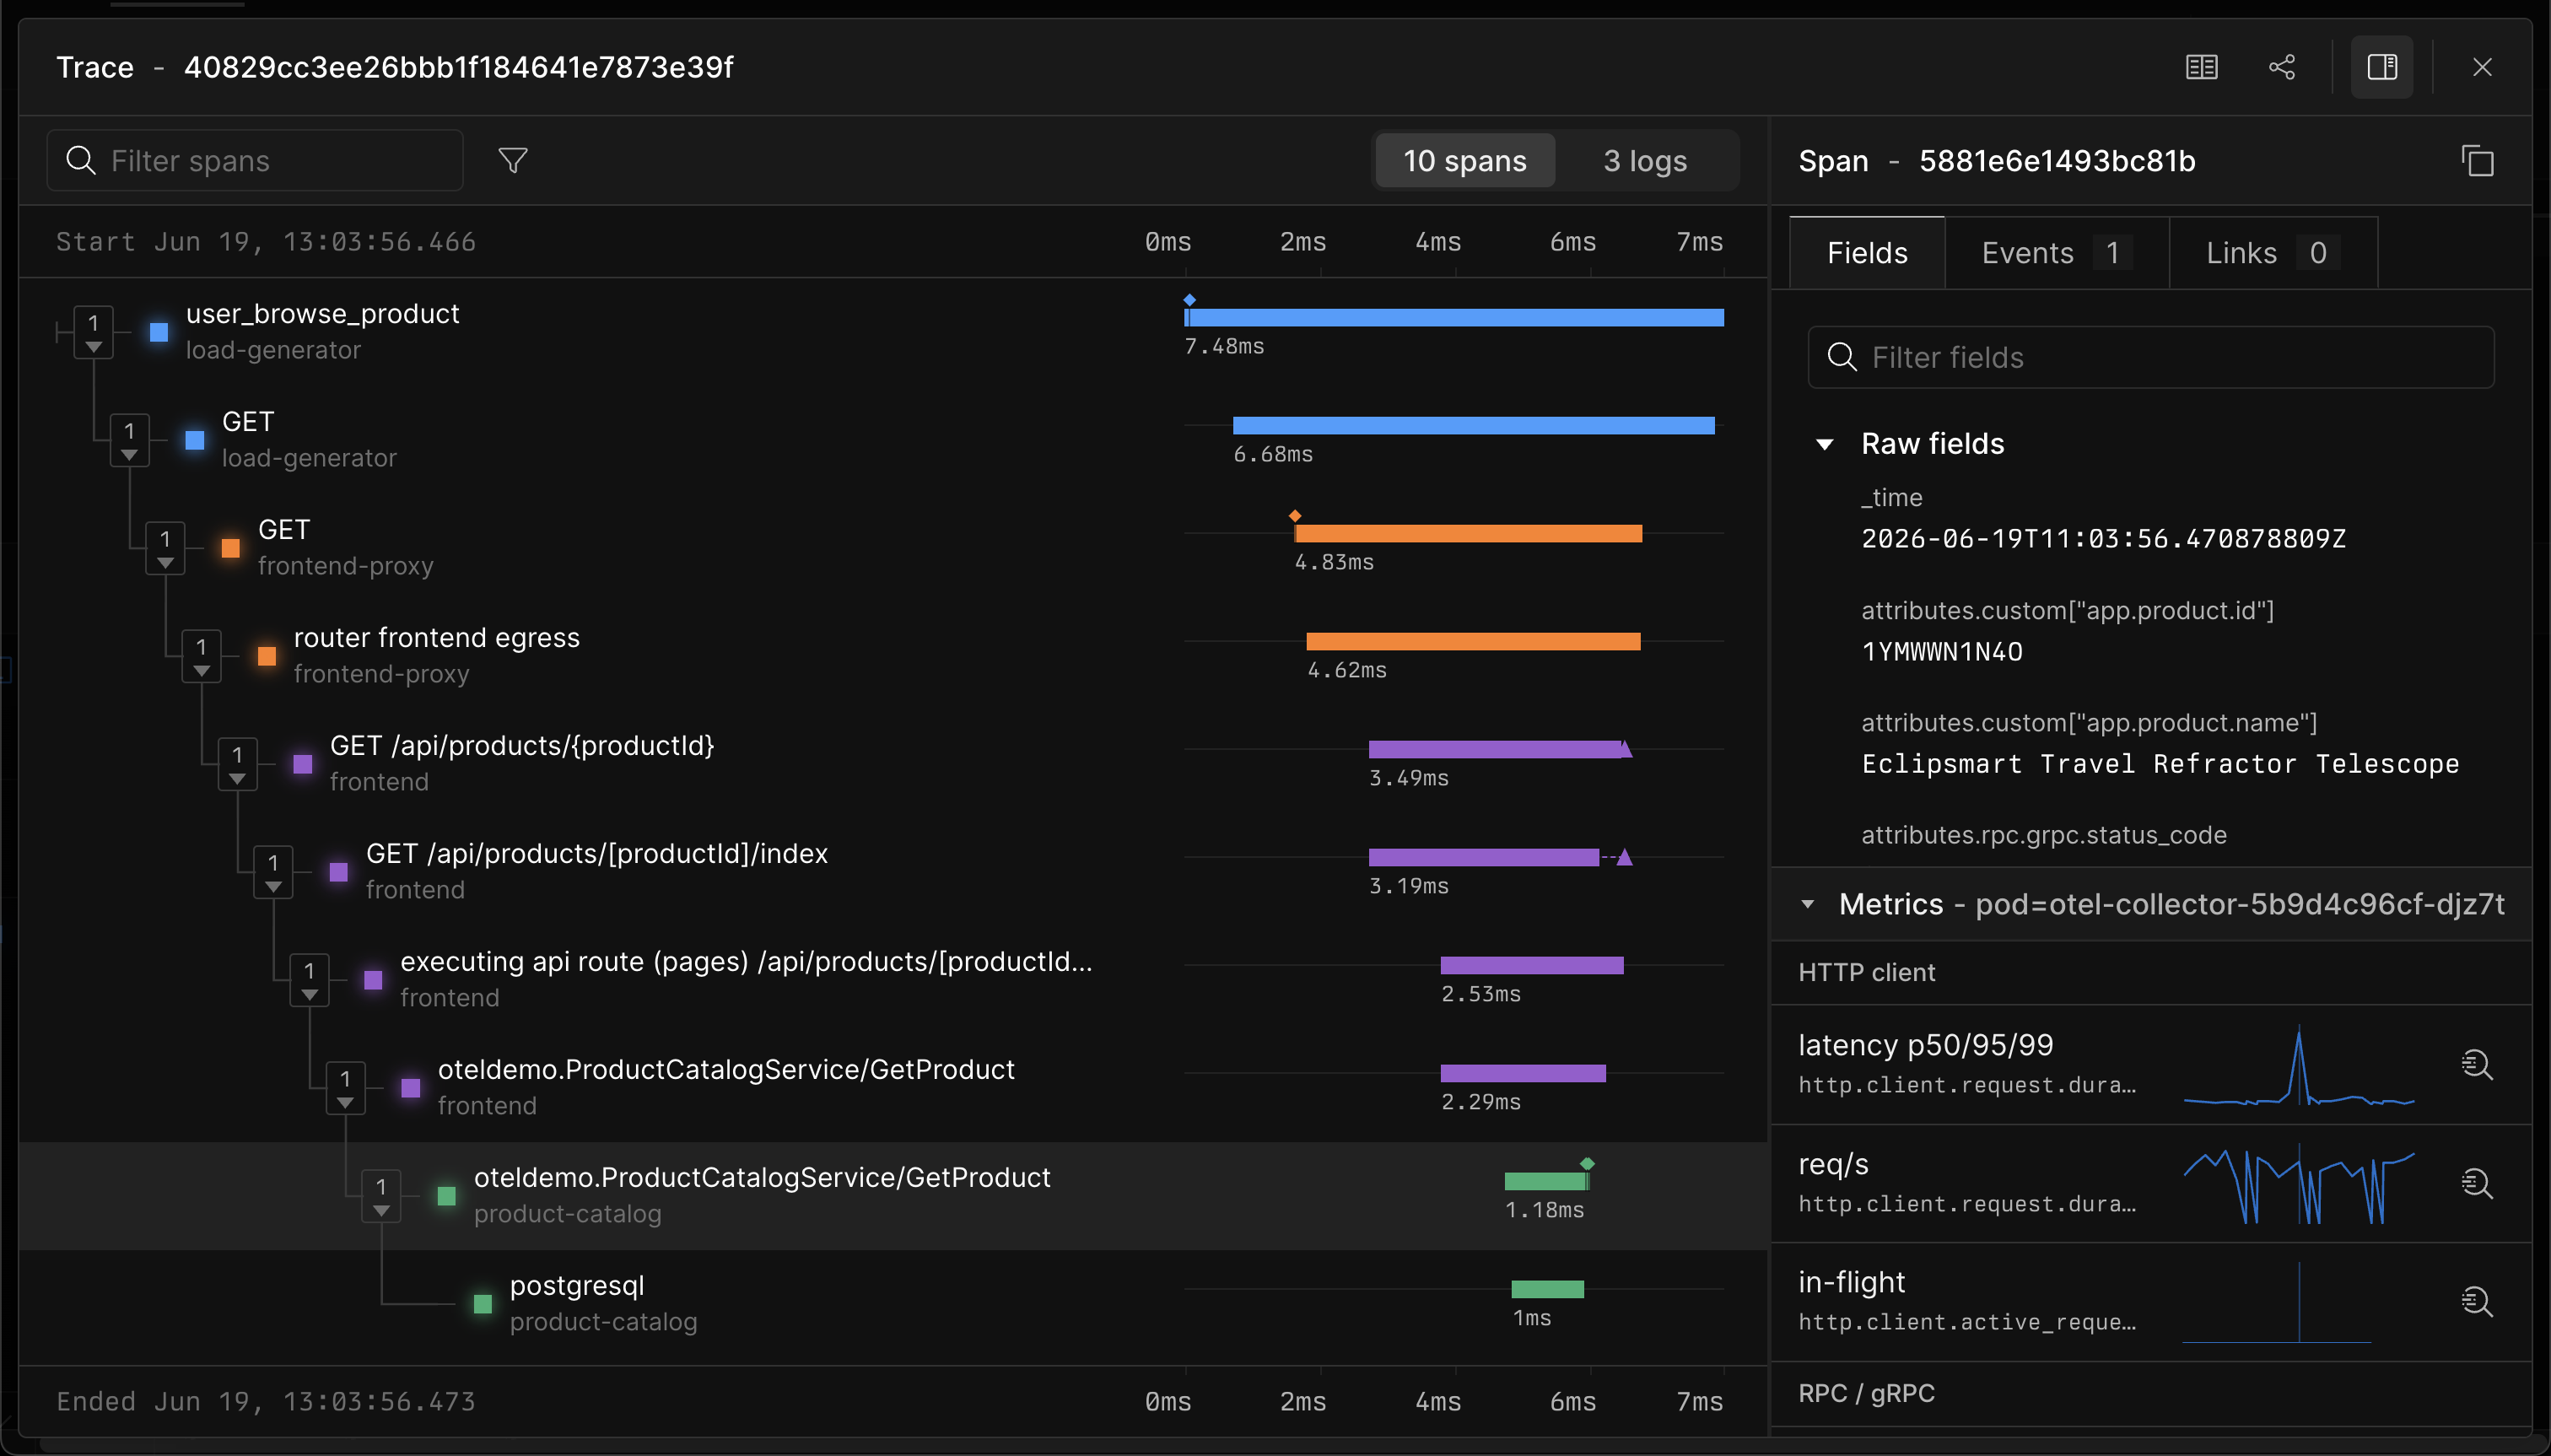 ### Go from logs to traces [#go-from-logs-to-traces]
When a log event belongs to a correlated logs dataset and contains a trace ID, Axiom links the event to the matching trace in the correlated traces dataset.
#### Query view [#query-view]
1. Run a query against a logs dataset that has correlated traces.
2. Click a log event to view details.
3. Click **View trace** to open the matching trace in the Trace view.
#### Stream tab [#stream-tab]
1. Open the stream for a logs dataset that has correlated traces.
2. Click a log event to view details.
3. Click **View trace** to open the matching trace in the Trace view.
### Go from traces to logs [#go-from-traces-to-logs]
When a trace belongs to a correlated traces dataset, Axiom queries the correlated logs dataset for log records in the trace time range.
Use this flow when a trace shows a slow or failed span and the investigation needs nearby log records from the same request.
### Go from traces to metrics [#go-from-traces-to-metrics]
When a trace belongs to a correlated traces dataset and the group has a metrics dataset, Axiom shows relevant span metrics in the span details panel.
Trace-to-metrics correlation uses OpenTelemetry semantic conventions and the metric catalog to show common runtime, process, container, and service metrics. Each metric includes an **Explore** action that opens the generated MPL query in the Query tab.
Use this flow when a span shows latency or errors and the investigation needs resource or service health around the same time.
### Go from logs to traces [#go-from-logs-to-traces]
When a log event belongs to a correlated logs dataset and contains a trace ID, Axiom links the event to the matching trace in the correlated traces dataset.
#### Query view [#query-view]
1. Run a query against a logs dataset that has correlated traces.
2. Click a log event to view details.
3. Click **View trace** to open the matching trace in the Trace view.
#### Stream tab [#stream-tab]
1. Open the stream for a logs dataset that has correlated traces.
2. Click a log event to view details.
3. Click **View trace** to open the matching trace in the Trace view.
### Go from traces to logs [#go-from-traces-to-logs]
When a trace belongs to a correlated traces dataset, Axiom queries the correlated logs dataset for log records in the trace time range.
Use this flow when a trace shows a slow or failed span and the investigation needs nearby log records from the same request.
### Go from traces to metrics [#go-from-traces-to-metrics]
When a trace belongs to a correlated traces dataset and the group has a metrics dataset, Axiom shows relevant span metrics in the span details panel.
Trace-to-metrics correlation uses OpenTelemetry semantic conventions and the metric catalog to show common runtime, process, container, and service metrics. Each metric includes an **Explore** action that opens the generated MPL query in the Query tab.
Use this flow when a span shows latency or errors and the investigation needs resource or service health around the same time.
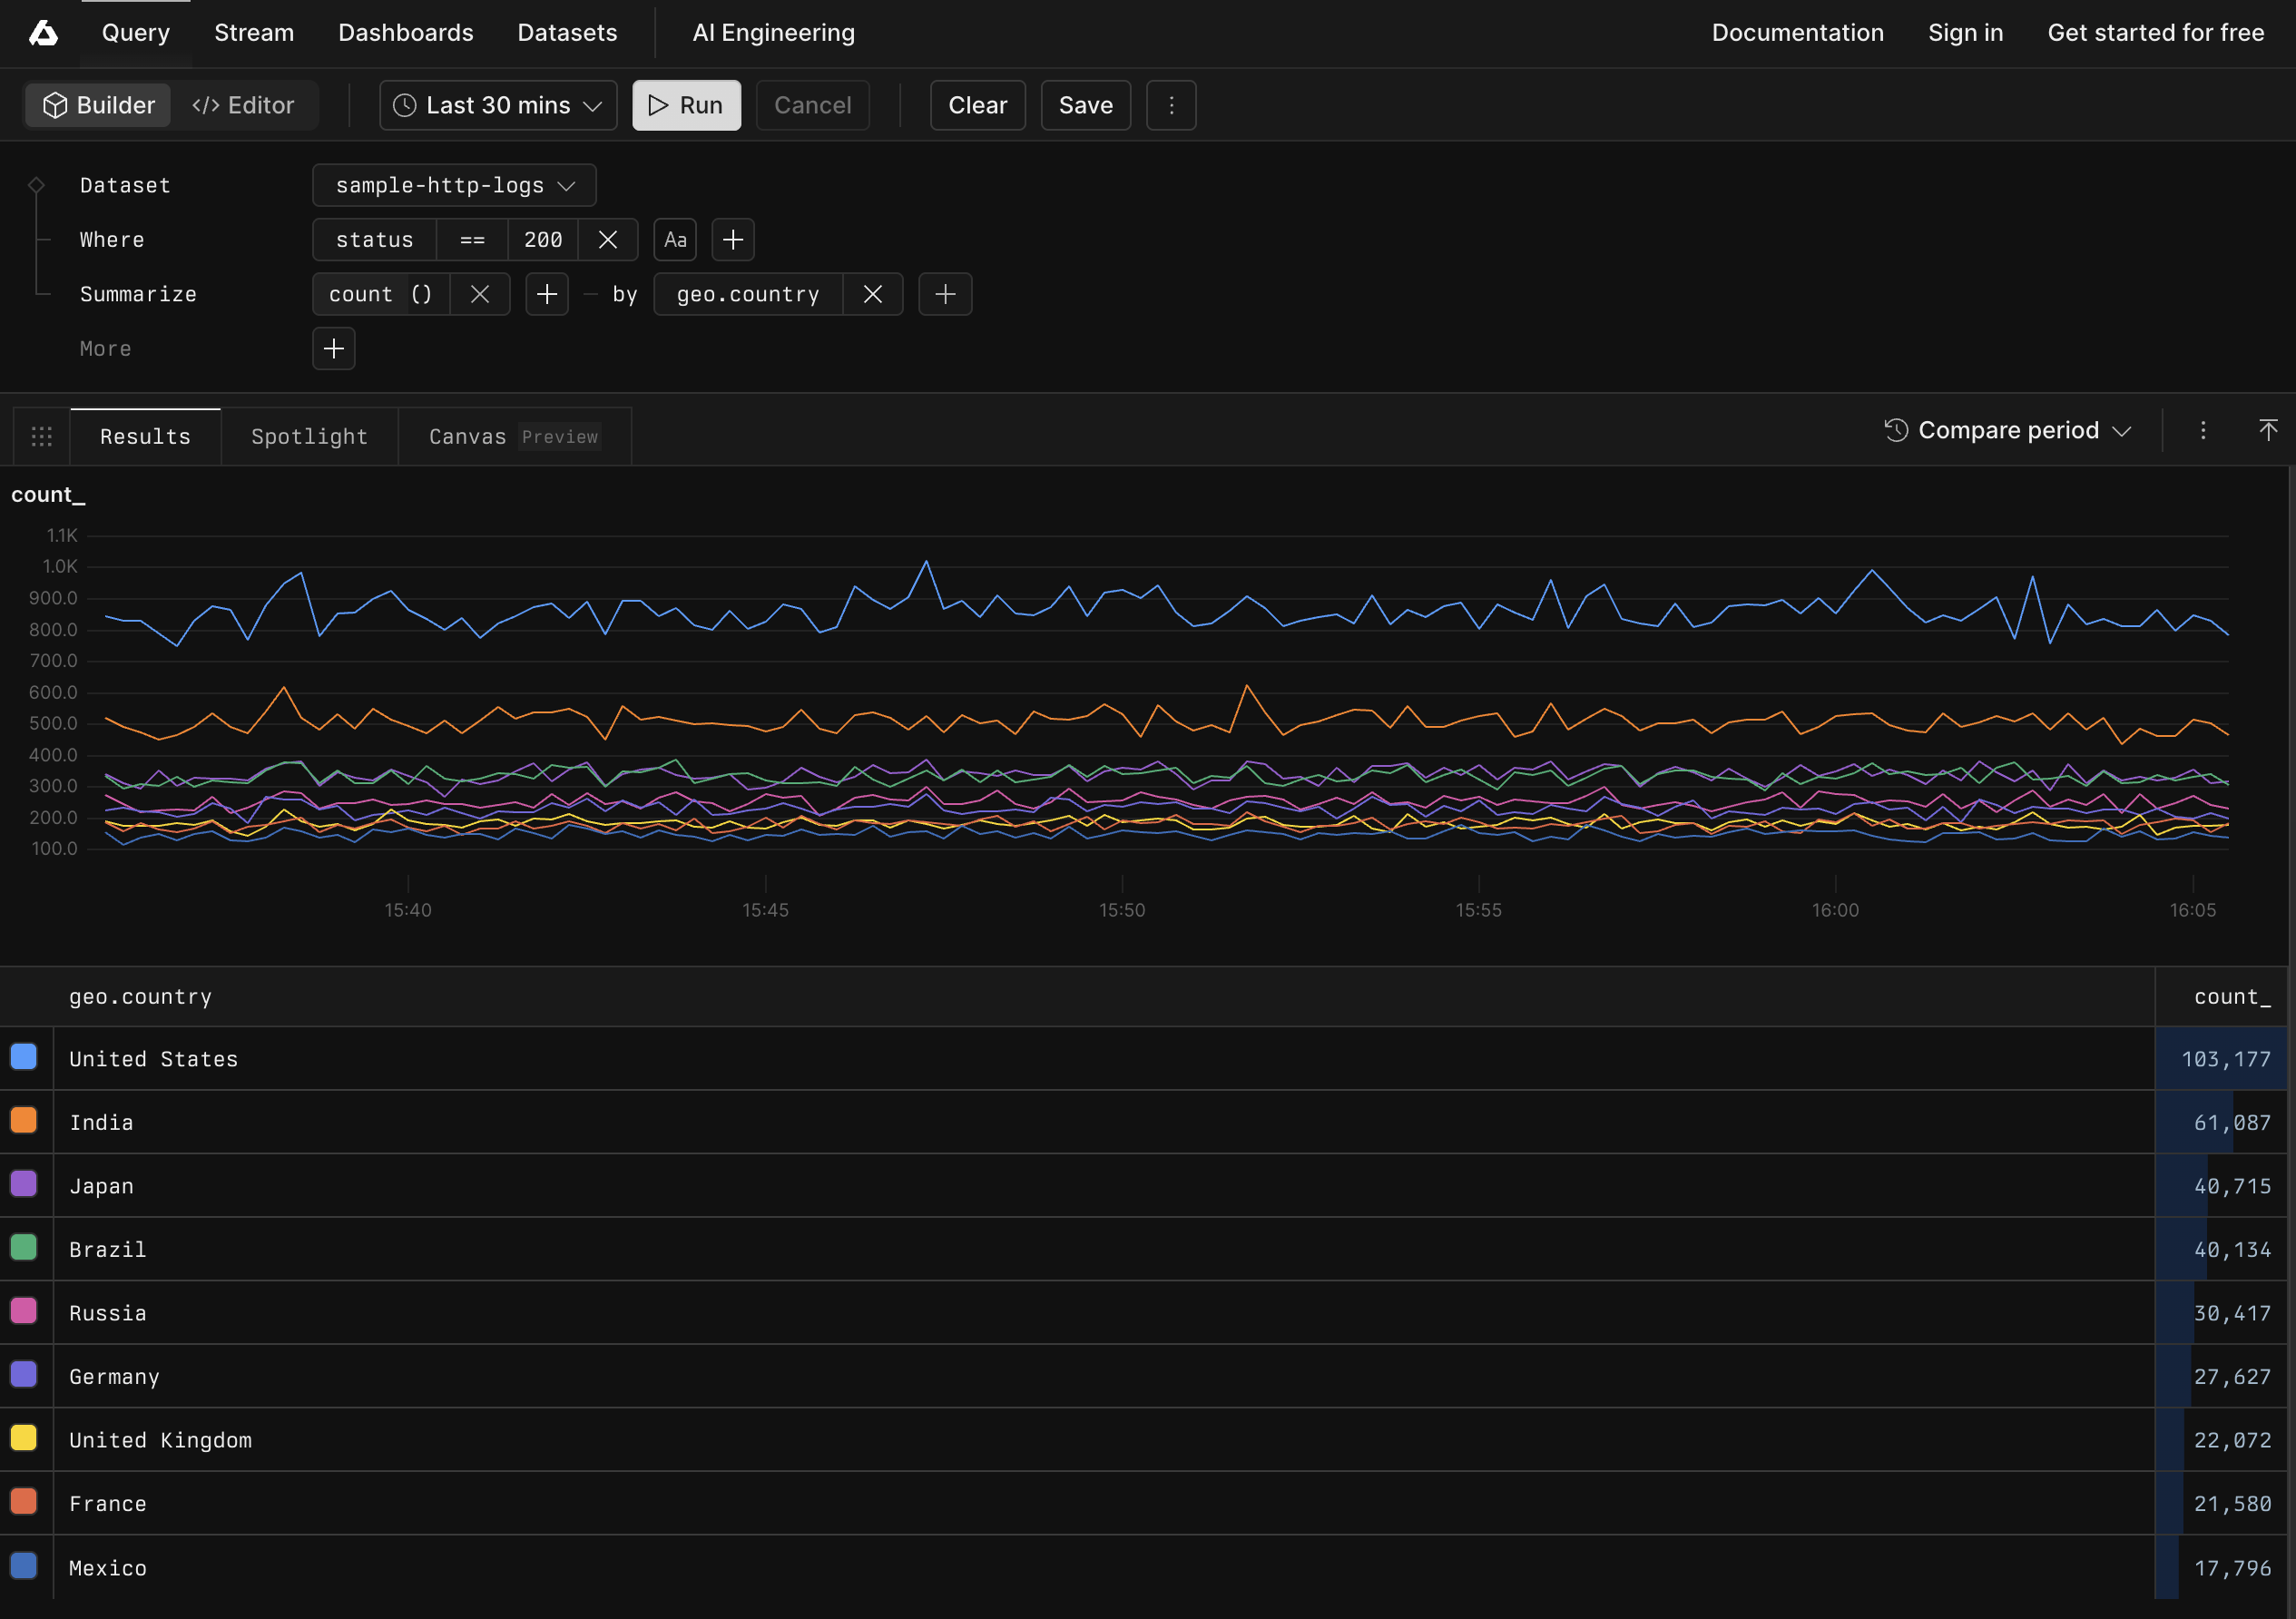 This example queries the `sample-http-logs` dataset to find all events where the HTTP status code is 200 and groups the results by county.
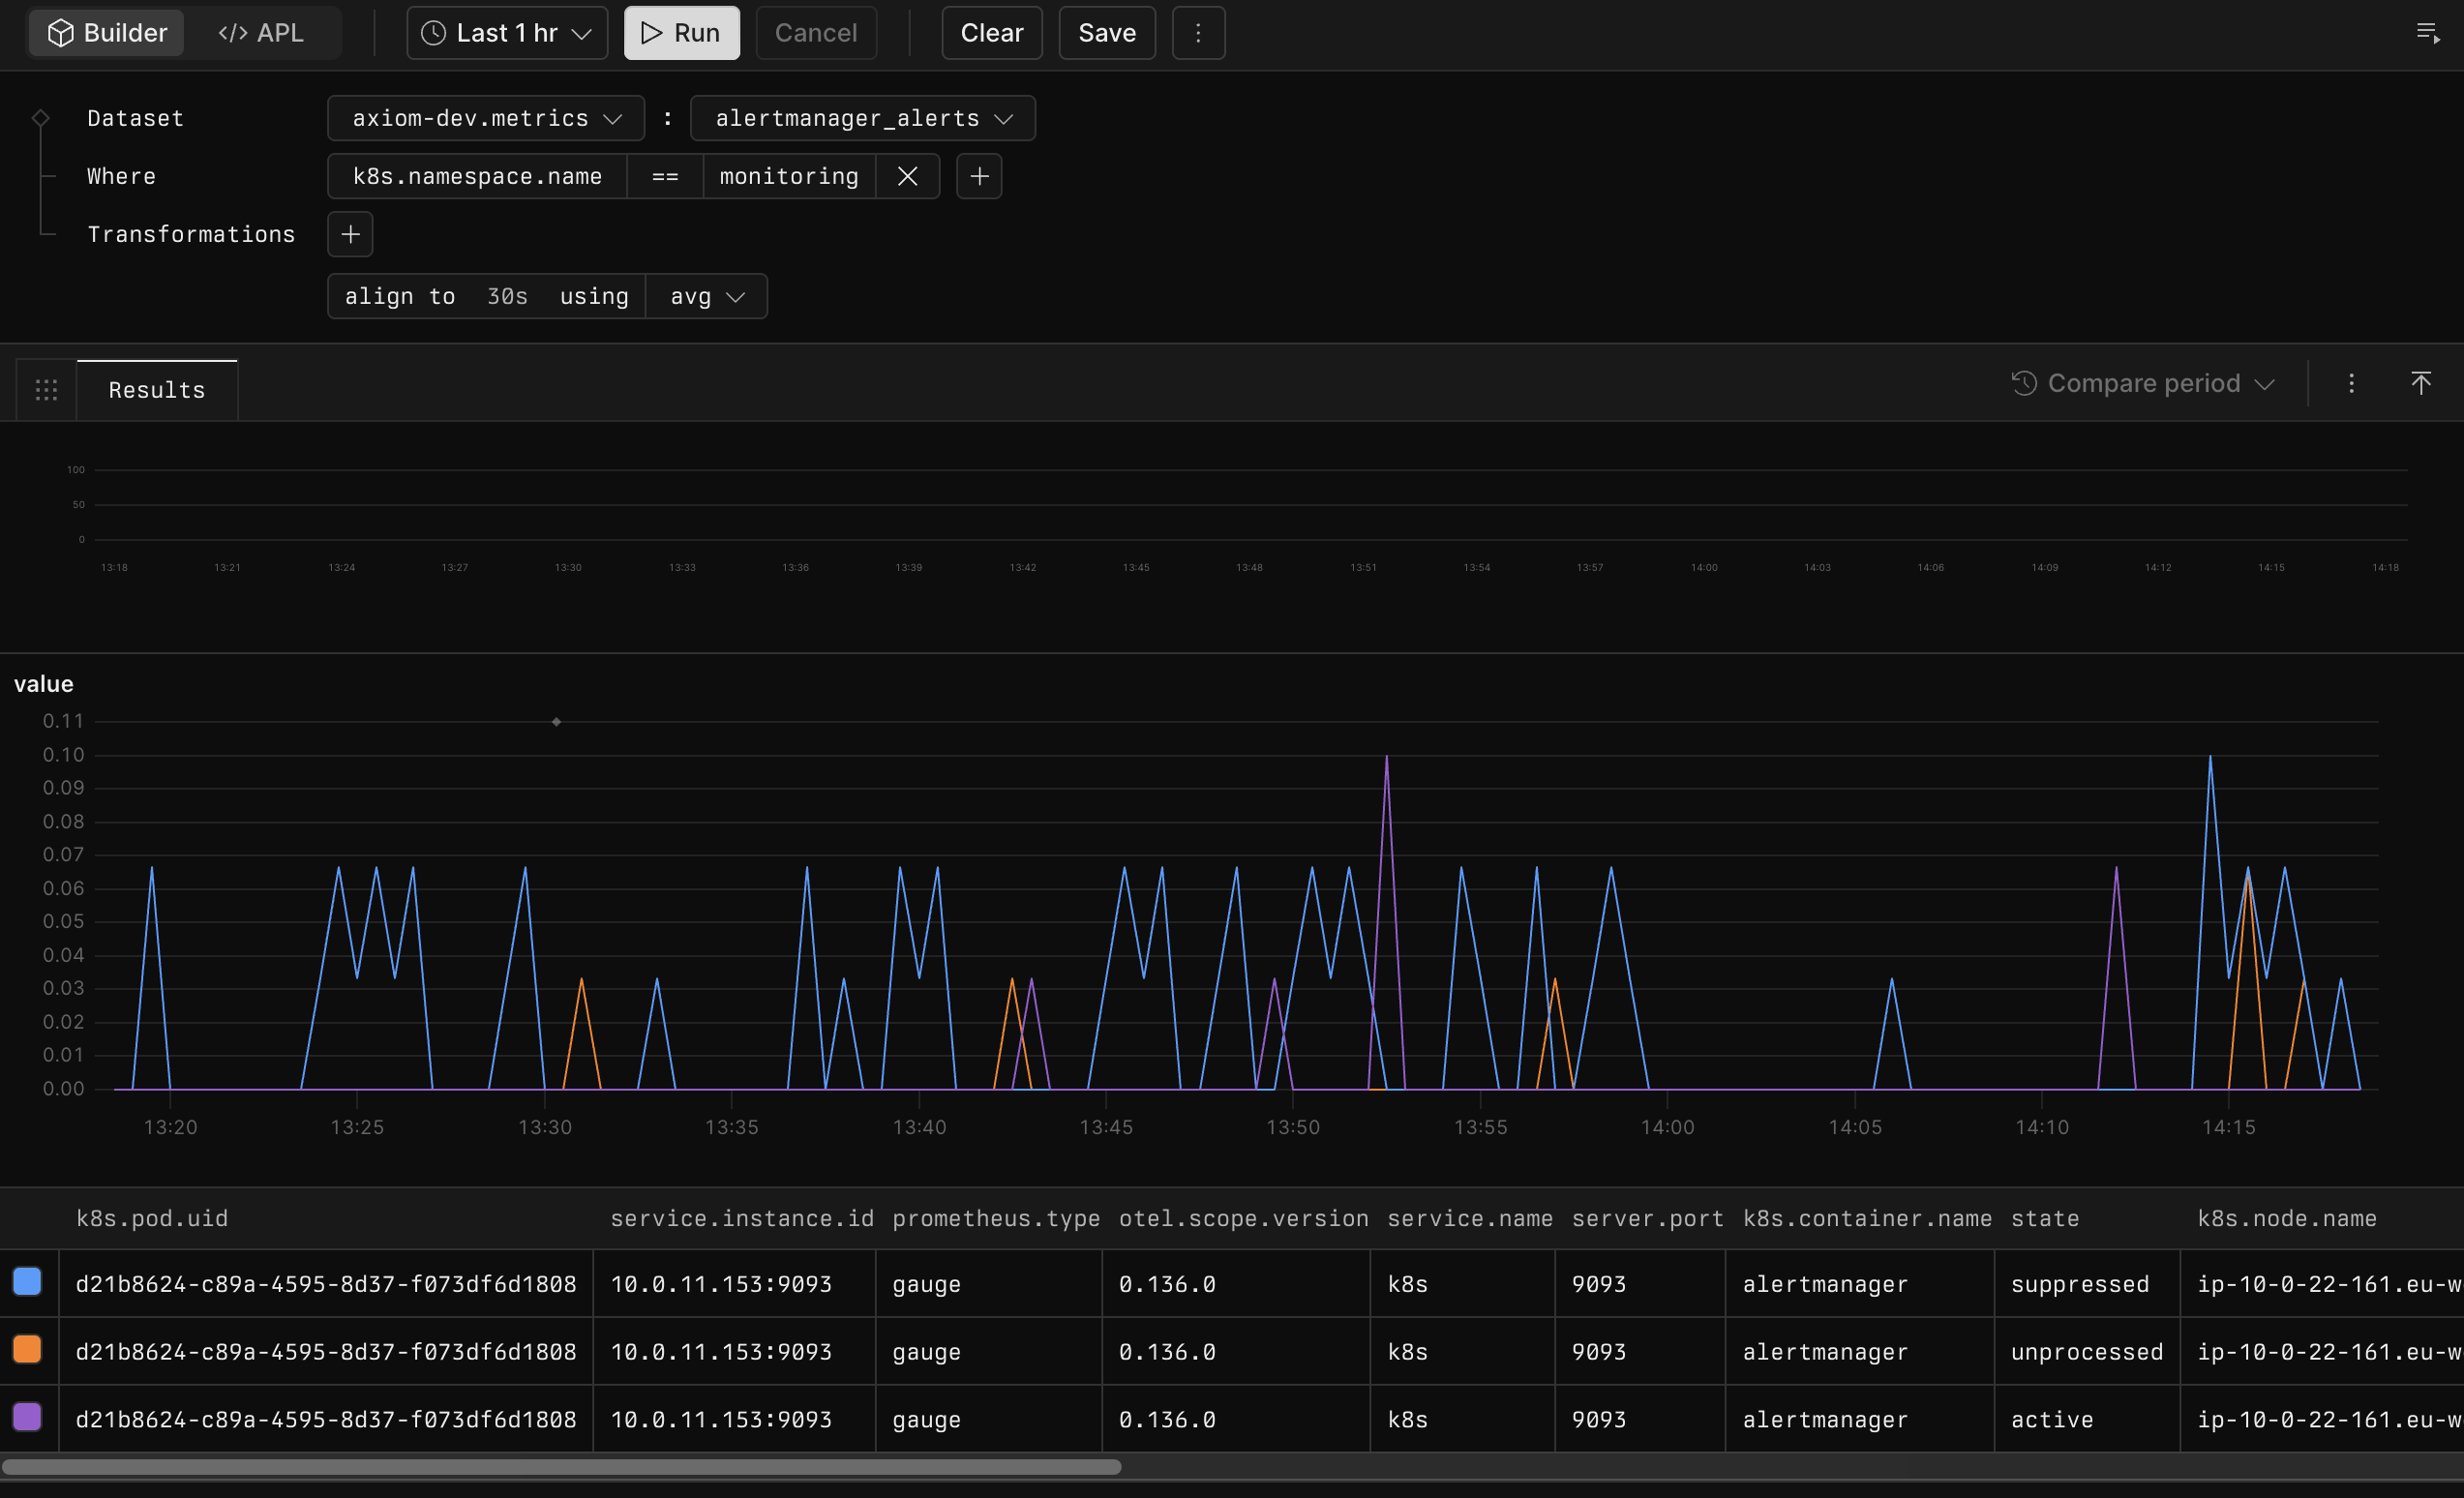 This example queries the `axiom-dev.metrics` dataset’s `alertmanager_alerts` metric one hour before the current time. It filters results to events where `k8s.namespace.name` is `monitoring` and aggregates events over 30-second time windows into their average value.
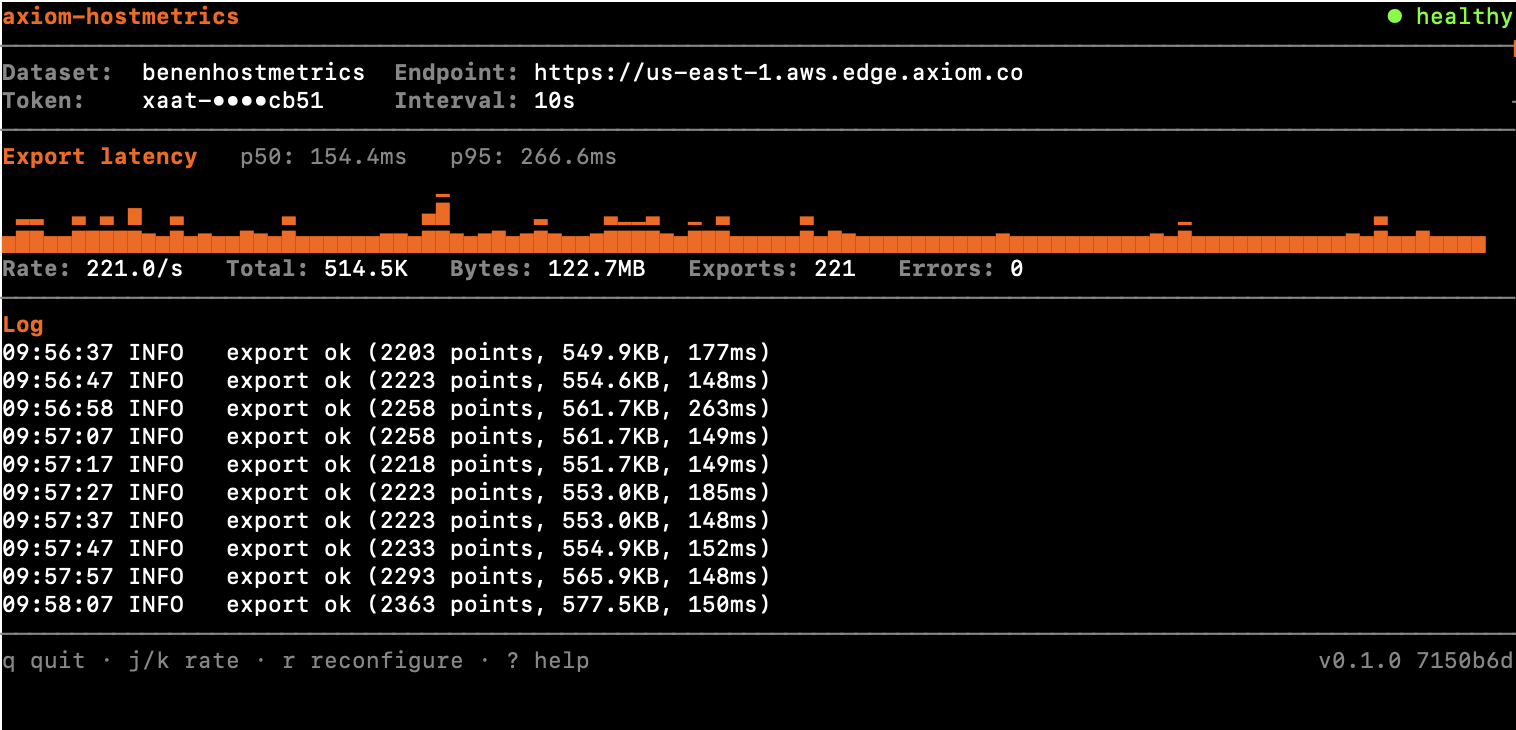 ## Query metrics [#query-metrics]
You can query metric data in one of the following ways:
* **Builder**: A visual interface for building queries step by step. For more information, see [Query data using Builder](/query-data/explore).
* **MPL**: A text-based query language (Metrics Processing Language) for writing expressive queries directly. For more information, see [Query metrics using MPL](/mpl/introduction) and [Sample queries](/mpl/sample-queries).
## Migrate PromQL queries [#migrate-promql-queries]
You can translate your existing PromQL queries to MPL with minimal changes. MPL also offers features not available in PromQL, such as native support for non-string tag types and custom transformation pipelines.
For more information, see [Migrate PromQL queries to Axiom](/mpl/migrate-metrics).
## Dashboards and monitors [#dashboards-and-monitors]
You can use OTel metrics in dashboards and monitors the same way you use other data types.
* Build visualizations using metrics queries.
* Set alerts on derived metrics such as error rate or latency percentiles.
* Combine multiple signals in a single panel.
For more information, see [Dashboards](/dashboards/overview) and [Monitors](/monitor-data/monitors).
## Query metrics [#query-metrics]
You can query metric data in one of the following ways:
* **Builder**: A visual interface for building queries step by step. For more information, see [Query data using Builder](/query-data/explore).
* **MPL**: A text-based query language (Metrics Processing Language) for writing expressive queries directly. For more information, see [Query metrics using MPL](/mpl/introduction) and [Sample queries](/mpl/sample-queries).
## Migrate PromQL queries [#migrate-promql-queries]
You can translate your existing PromQL queries to MPL with minimal changes. MPL also offers features not available in PromQL, such as native support for non-string tag types and custom transformation pipelines.
For more information, see [Migrate PromQL queries to Axiom](/mpl/migrate-metrics).
## Dashboards and monitors [#dashboards-and-monitors]
You can use OTel metrics in dashboards and monitors the same way you use other data types.
* Build visualizations using metrics queries.
* Set alerts on derived metrics such as error rate or latency percentiles.
* Combine multiple signals in a single panel.
For more information, see [Dashboards](/dashboards/overview) and [Monitors](/monitor-data/monitors).
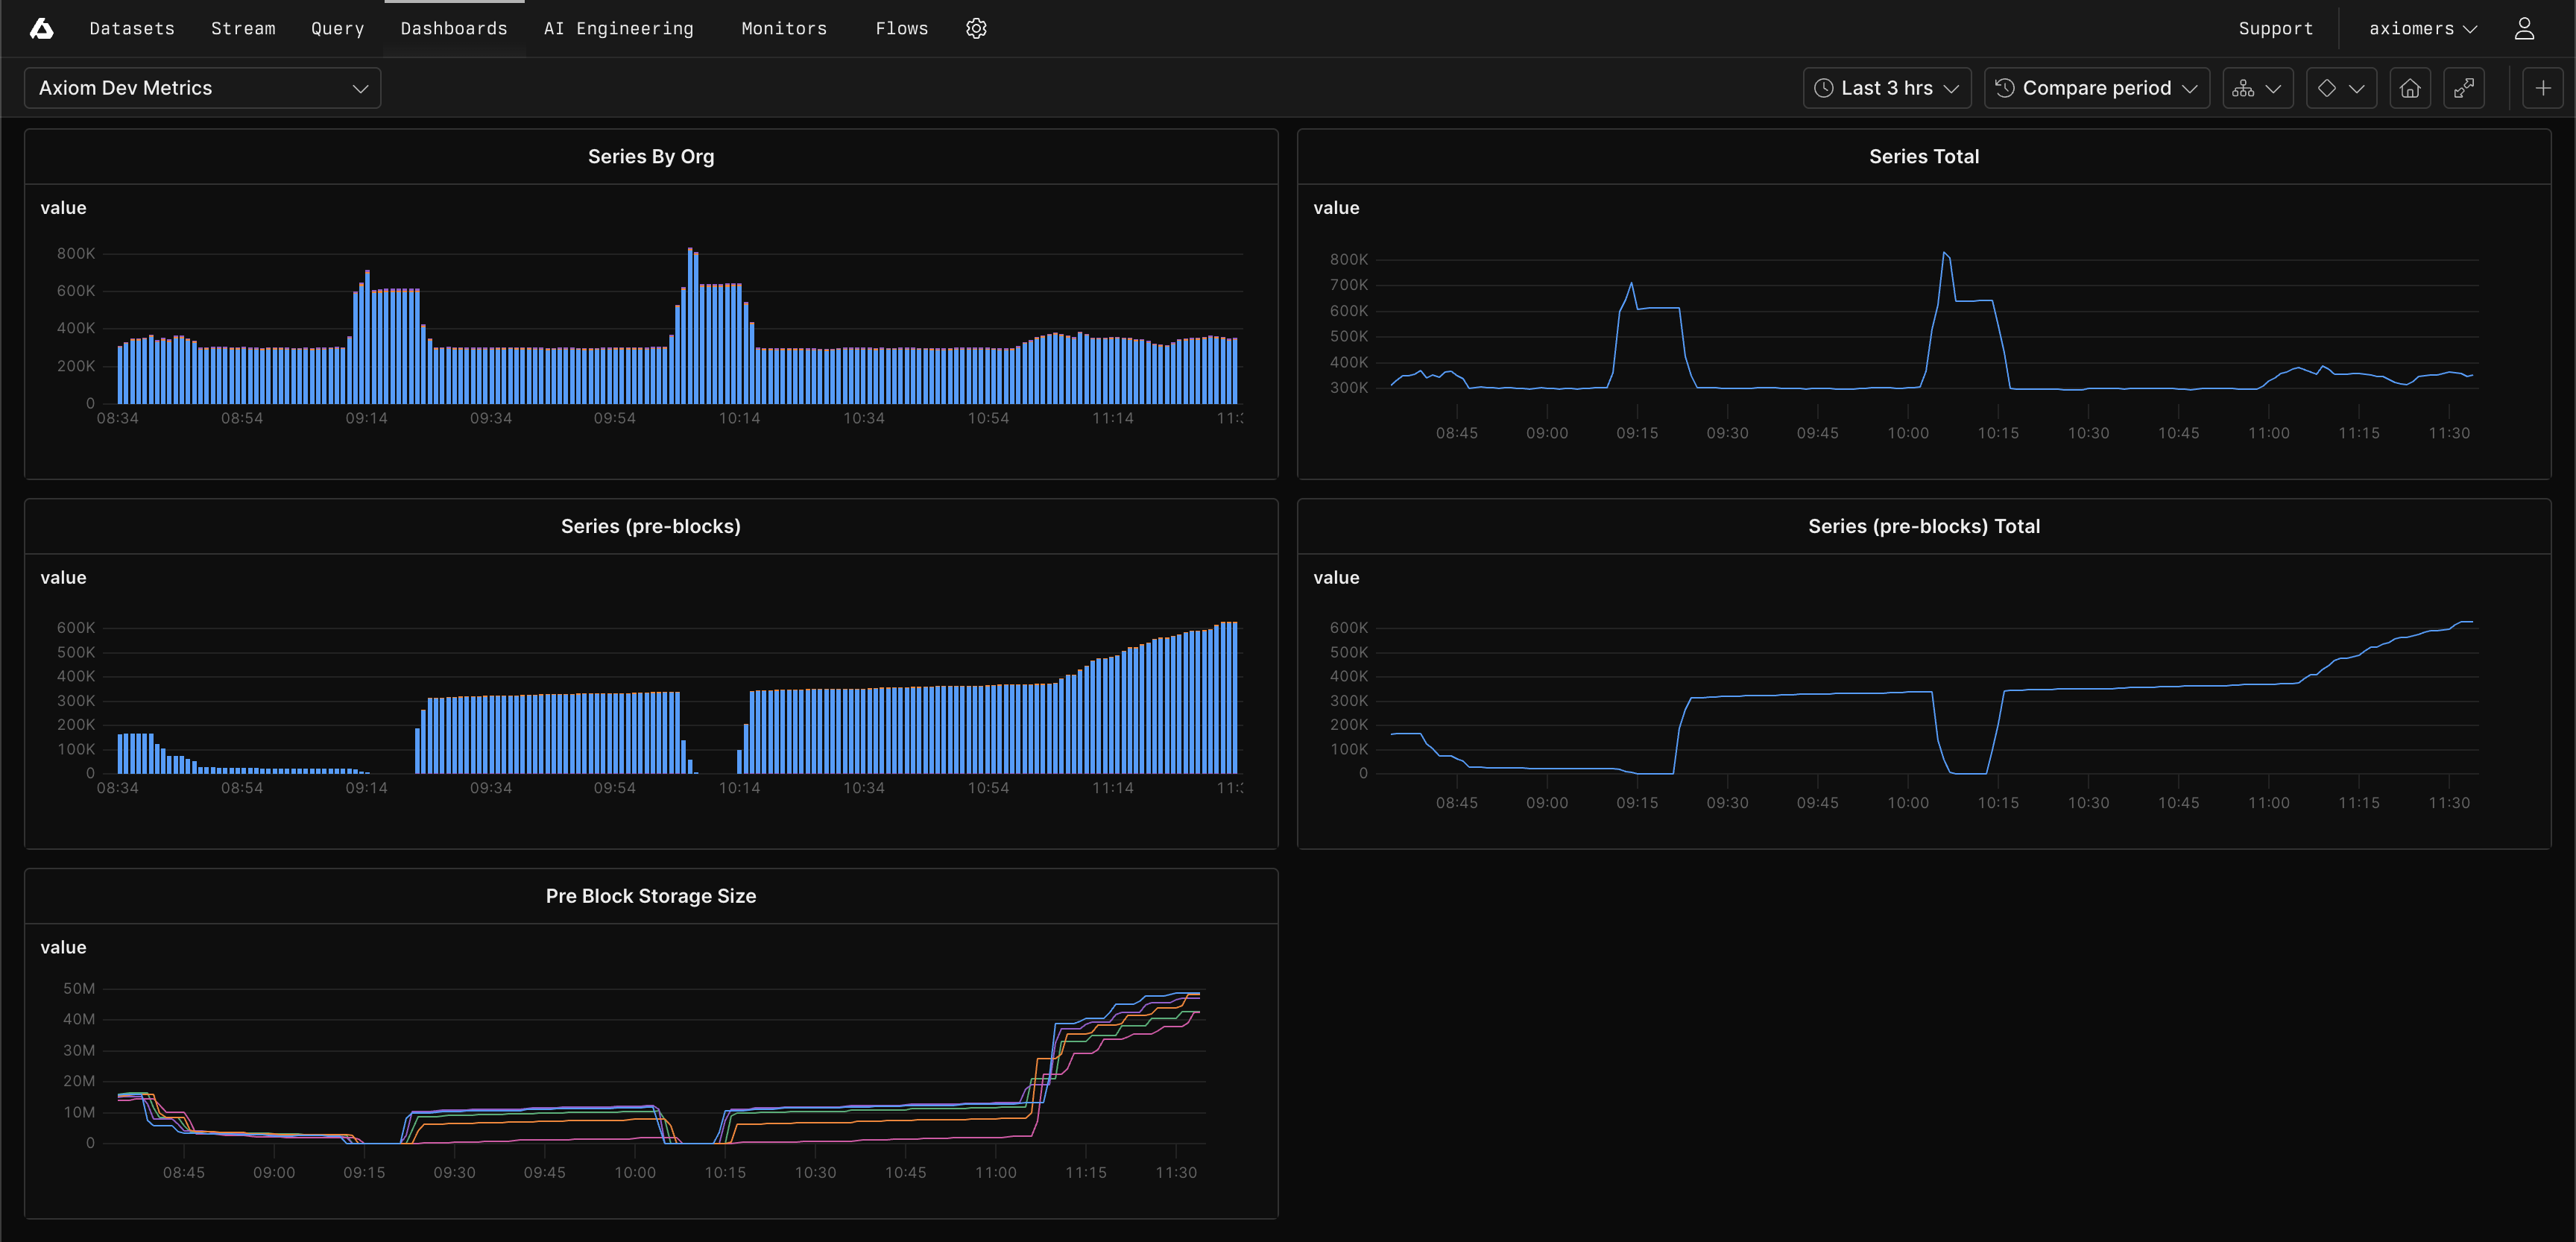 ## Design choices and constraints [#design-choices-and-constraints]
MetricsDB makes intentional architectural trade-offs to optimize for the most common metrics use cases while maintaining exceptional performance at scale.
### Query scope [#query-scope]
You can query one dataset per query.
### Supported data types [#supported-data-types]
MetricsDB focuses on the core OpenTelemetry metric types that cover the vast majority of observability scenarios.
Axiom supports the following OpenTelemetry metric types:
* **Gauge**: Point-in-time measurements. For example, CPU usage or temperature.
* **Histogram**: Distribution of values with configurable buckets. For example, request latency.
* **Sum**: Sum of values. For example, request count.
* **Summary**: Summary of values. For example, request latency.
Axiom doesn’t currently support the following data types:
* Exponential histograms
* `bytes`, `kvlist`, and `array` tag value types
* Exemplar, baggage, and context data
* Nanosecond-precision timestamps
### Data model optimizations [#data-model-optimizations]
MetricsDB applies the following transformations to improve query performance and reduce storage costs:
* **Timestamp precision**: Truncate nanosecond timestamps to second precision. MetricsDB is built for use cases where second-level granularity is sufficient, and this optimization significantly improves compression ratios and query speed.
* **Unified tag namespace**: Flatten resource, scope, and metric tags into a single namespace. This simplification makes queries more straightforward and enables faster dimensional filtering. You don’t need to remember which tags came from which scope.
* **Unit normalization**: Convert the `unit` attribute to `otel.metric.unit` for consistent handling across all metric types.
* **Histogram handling**: Assume equal-width histograms and don’t preserve histogram metadata. This trade-off supports the most common histogram analysis patterns (percentiles, distribution visualization) while reducing storage requirements.
These design choices reflect real-world metrics usage patterns. If your use case requires capabilities not currently supported, [contact Axiom](https://axiom.co/contact) to discuss your requirements. Your feedback helps shape MetricsDB’s evolution.
---
# Query using Editor
Source: https://axiom.co/docs/query-data/query-editor
Query your data using the text-based query editor in Console:
1. Click the Query tab.
2. Click **Editor** in the top left.
3. Write your query in the editor.
4. Click **Run**.
The Editor of the Query tab accepts both APL (Axiom Processing Language) and MPL (Metrics Processing Language) queries and automatically detects the query language you use:
* APL is a data processing language that supports filtering, extending, and summarizing data. For more information, see [Introduction to APL](/apl/introduction).
* MPL is a metric-focused query language that combines the simplicity of APL with the expressive power of PromQL. It enables effective querying, transformation, and aggregation of metric data, supporting diverse observability use cases. For more information, see [Introduction to MPL](/mpl/introduction).
## Generate query using natural language [#generate-query-using-natural-language]
Instead of writing the query yourself, you can use Axiom AI to generate a query for you. Explain what you want to infer from your data in your own words and Axiom AI generates the valid APL query.
## Design choices and constraints [#design-choices-and-constraints]
MetricsDB makes intentional architectural trade-offs to optimize for the most common metrics use cases while maintaining exceptional performance at scale.
### Query scope [#query-scope]
You can query one dataset per query.
### Supported data types [#supported-data-types]
MetricsDB focuses on the core OpenTelemetry metric types that cover the vast majority of observability scenarios.
Axiom supports the following OpenTelemetry metric types:
* **Gauge**: Point-in-time measurements. For example, CPU usage or temperature.
* **Histogram**: Distribution of values with configurable buckets. For example, request latency.
* **Sum**: Sum of values. For example, request count.
* **Summary**: Summary of values. For example, request latency.
Axiom doesn’t currently support the following data types:
* Exponential histograms
* `bytes`, `kvlist`, and `array` tag value types
* Exemplar, baggage, and context data
* Nanosecond-precision timestamps
### Data model optimizations [#data-model-optimizations]
MetricsDB applies the following transformations to improve query performance and reduce storage costs:
* **Timestamp precision**: Truncate nanosecond timestamps to second precision. MetricsDB is built for use cases where second-level granularity is sufficient, and this optimization significantly improves compression ratios and query speed.
* **Unified tag namespace**: Flatten resource, scope, and metric tags into a single namespace. This simplification makes queries more straightforward and enables faster dimensional filtering. You don’t need to remember which tags came from which scope.
* **Unit normalization**: Convert the `unit` attribute to `otel.metric.unit` for consistent handling across all metric types.
* **Histogram handling**: Assume equal-width histograms and don’t preserve histogram metadata. This trade-off supports the most common histogram analysis patterns (percentiles, distribution visualization) while reducing storage requirements.
These design choices reflect real-world metrics usage patterns. If your use case requires capabilities not currently supported, [contact Axiom](https://axiom.co/contact) to discuss your requirements. Your feedback helps shape MetricsDB’s evolution.
---
# Query using Editor
Source: https://axiom.co/docs/query-data/query-editor
Query your data using the text-based query editor in Console:
1. Click the Query tab.
2. Click **Editor** in the top left.
3. Write your query in the editor.
4. Click **Run**.
The Editor of the Query tab accepts both APL (Axiom Processing Language) and MPL (Metrics Processing Language) queries and automatically detects the query language you use:
* APL is a data processing language that supports filtering, extending, and summarizing data. For more information, see [Introduction to APL](/apl/introduction).
* MPL is a metric-focused query language that combines the simplicity of APL with the expressive power of PromQL. It enables effective querying, transformation, and aggregation of metric data, supporting diverse observability use cases. For more information, see [Introduction to MPL](/mpl/introduction).
## Generate query using natural language [#generate-query-using-natural-language]
Instead of writing the query yourself, you can use Axiom AI to generate a query for you. Explain what you want to infer from your data in your own words and Axiom AI generates the valid APL query.
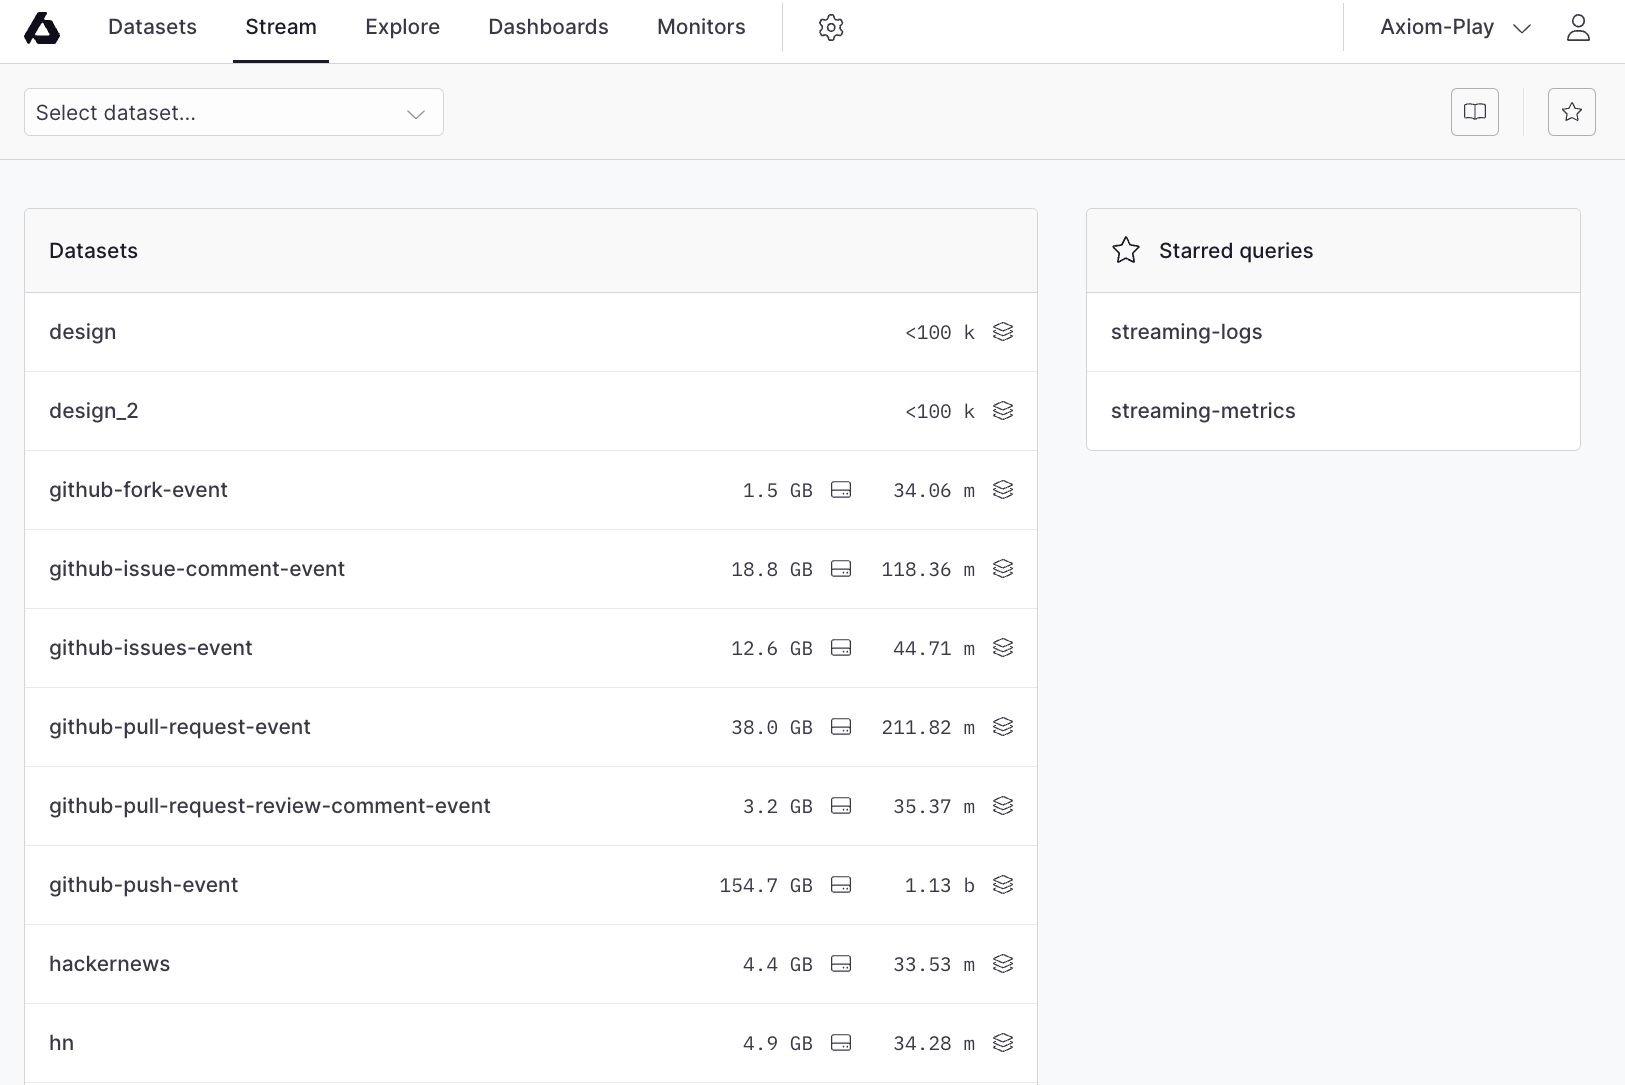 Select a dataset from the list of datasets to continue.
## Event stream [#event-stream]
Upon selecting a dataset, you are immediately taken to the live event stream for that dataset:
Select a dataset from the list of datasets to continue.
## Event stream [#event-stream]
Upon selecting a dataset, you are immediately taken to the live event stream for that dataset:
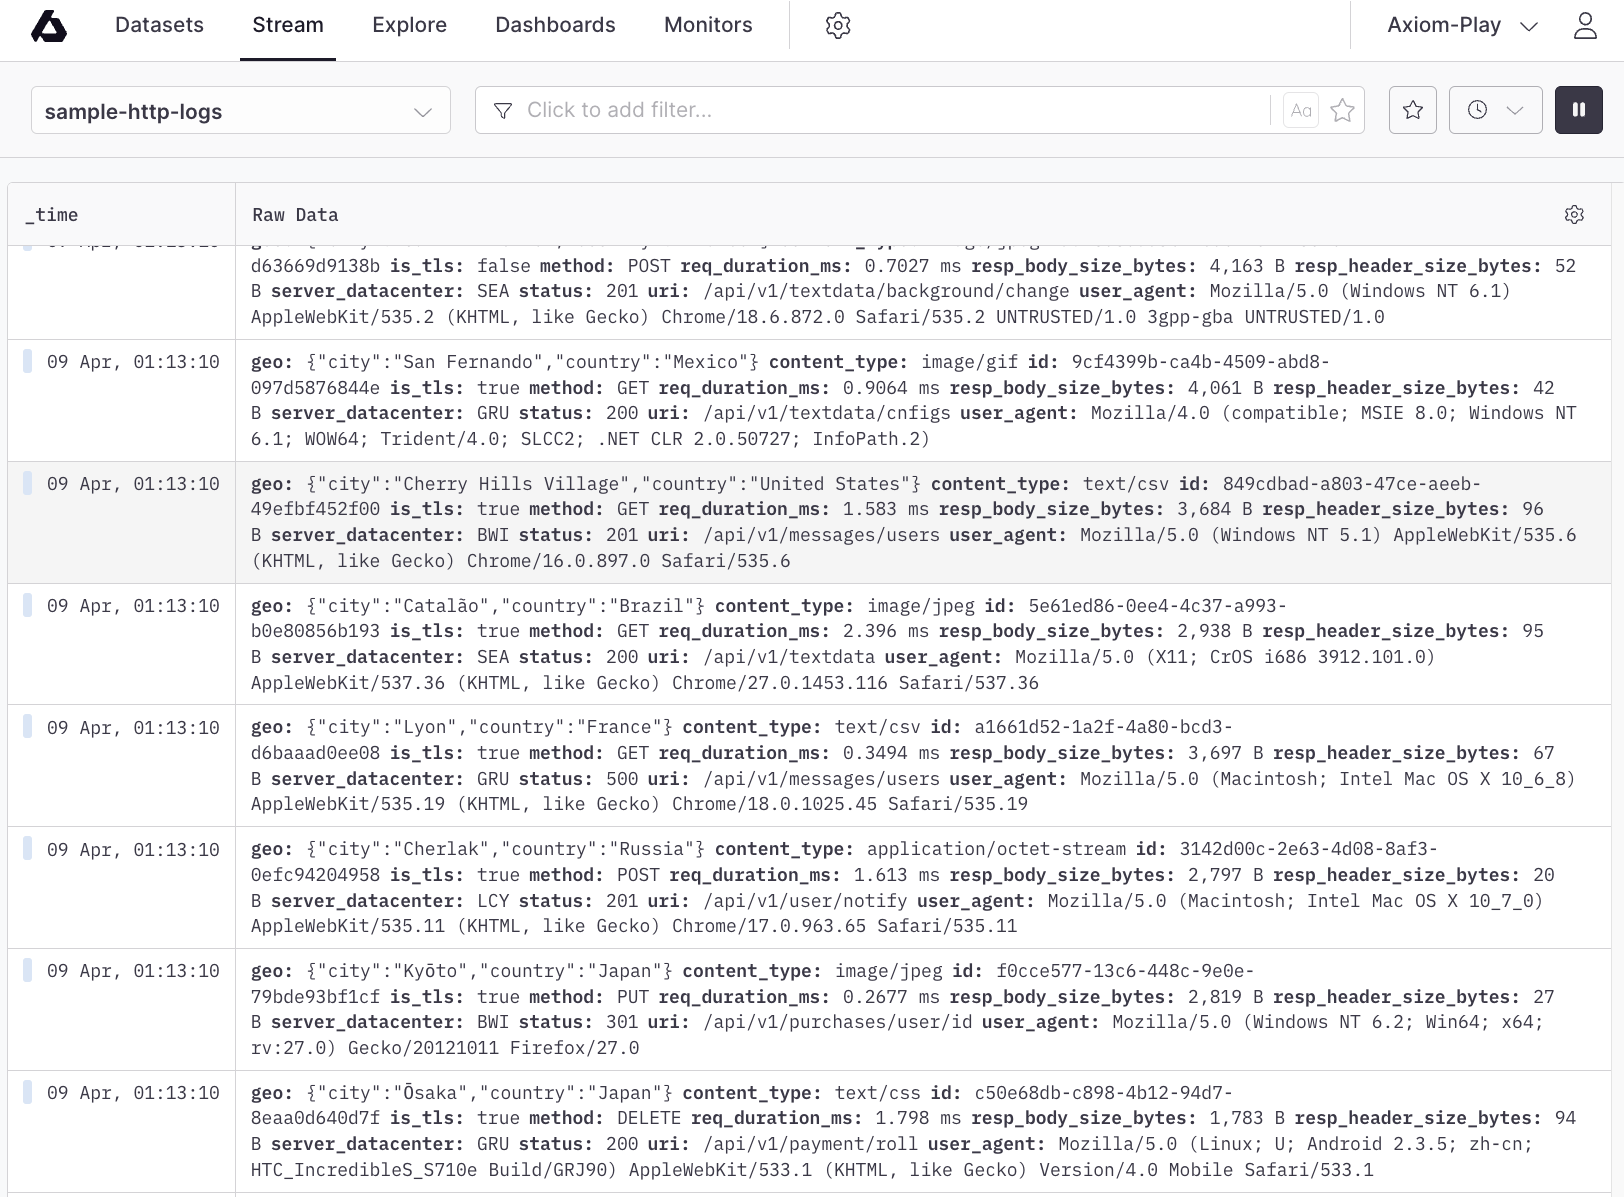 You can click an event to be taken to the event details slide-out:
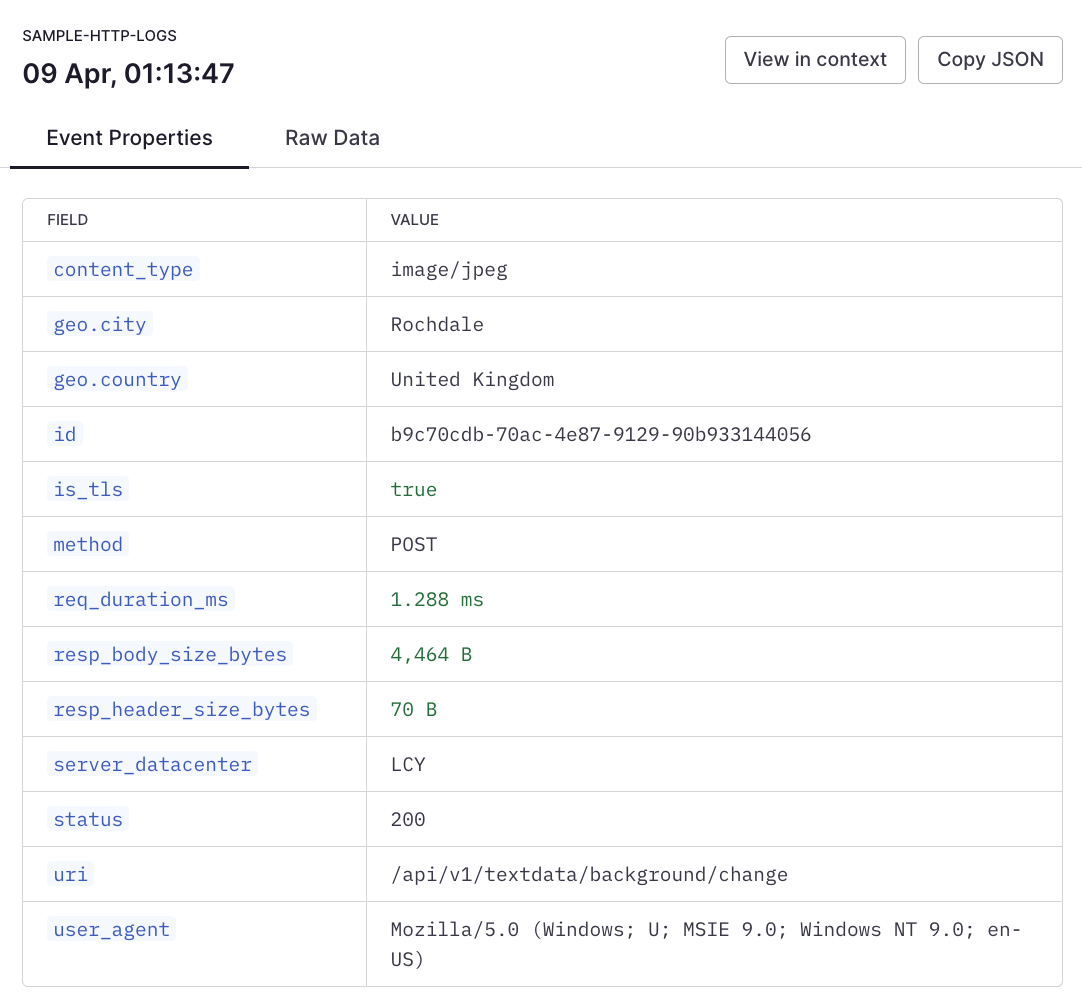 On this slide-out, you can copy individual field values, or copy the entire event as JSON.
You can view and copy the raw data:
On this slide-out, you can copy individual field values, or copy the entire event as JSON.
You can view and copy the raw data:
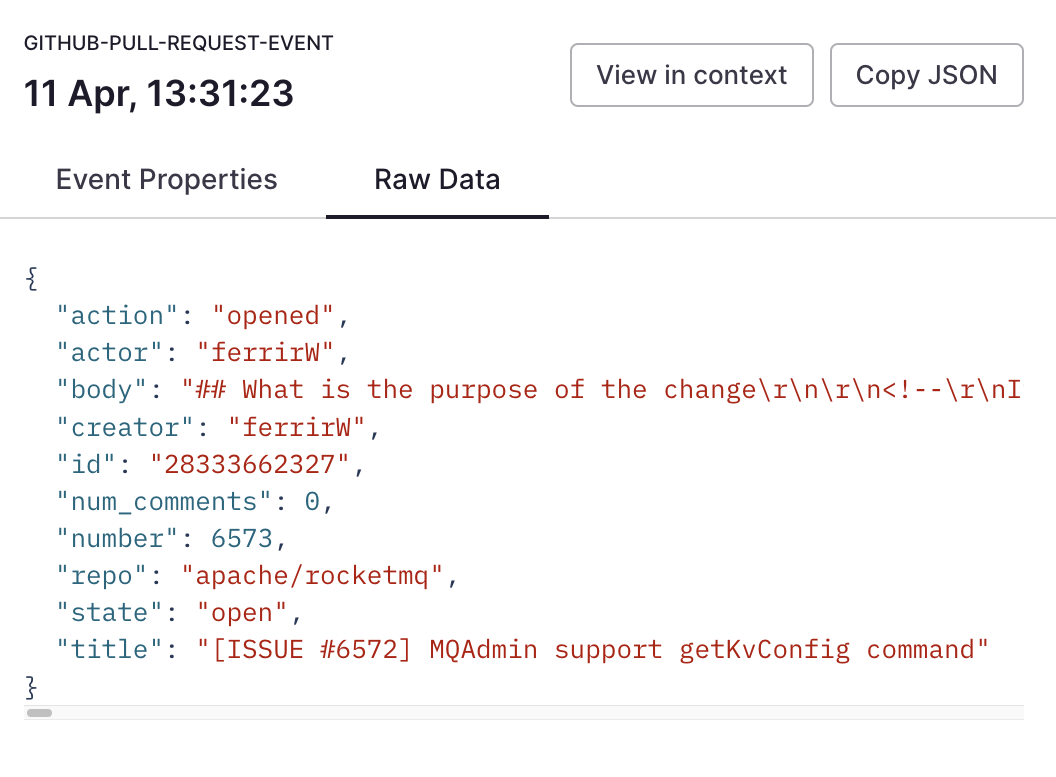 ## Filter data [#filter-data]
The Stream tab provides access to a powerful filter builder right on the toolbar:
## Filter data [#filter-data]
The Stream tab provides access to a powerful filter builder right on the toolbar:
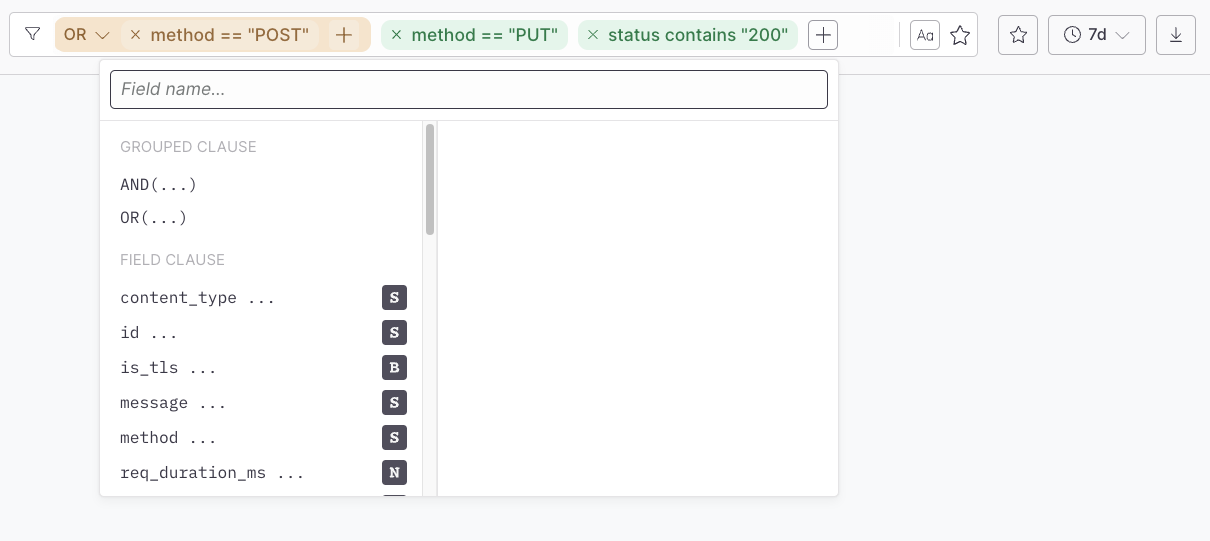 For more information, see the [filters documentation](/dashboard-elements/create#filters).
## Time range selection [#time-range-selection]
The stream has two time modes:
* Live stream (default)
* Time range
Live stream continuously checks for new events and presents them in the stream.
Time range only shows events that fall between a specific start and end date. This can be useful when investigating an issue. The time range menu has some options to quickly choose some time ranges, or you can input a specific range for your search.
When you are ready to return to live streaming, click this button:
For more information, see the [filters documentation](/dashboard-elements/create#filters).
## Time range selection [#time-range-selection]
The stream has two time modes:
* Live stream (default)
* Time range
Live stream continuously checks for new events and presents them in the stream.
Time range only shows events that fall between a specific start and end date. This can be useful when investigating an issue. The time range menu has some options to quickly choose some time ranges, or you can input a specific range for your search.
When you are ready to return to live streaming, click this button:
 Click the button again to pause the stream.
## View settings [#view-settings]
The Stream tab is customizable via the view settings menu:
Click the button again to pause the stream.
## View settings [#view-settings]
The Stream tab is customizable via the view settings menu:
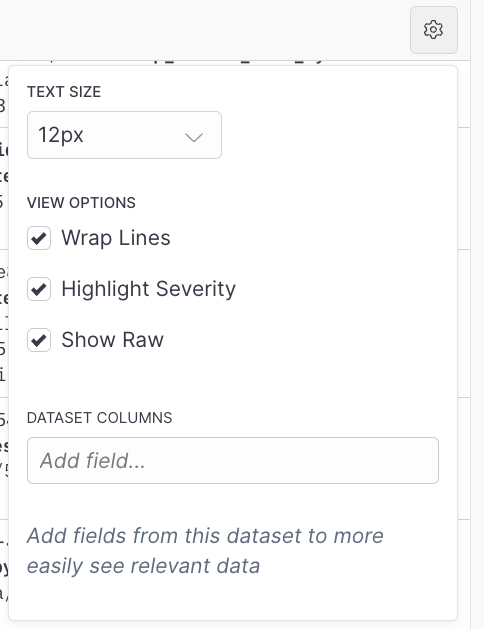 Options include:
* Text size used in the stream
* Wrap lines
* Highlight severity (this is automatically extracted from the event)
* Show the raw event details
* Fields to display in their own column
## Saved queries [#saved-queries]
The saved queries slide-out is activated via the toolbar:
Options include:
* Text size used in the stream
* Wrap lines
* Highlight severity (this is automatically extracted from the event)
* Show the raw event details
* Fields to display in their own column
## Saved queries [#saved-queries]
The saved queries slide-out is activated via the toolbar:
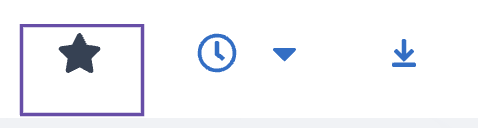 For more information, see [Saved queries](/query-data/datasets#saved-queries).
## Highlight severity [#highlight-severity]
The Stream tab allows you to easily detect warnings and errors in your logs by highlighting the severity of log entries in different colors.
To highlight the severity of log entries:
1. Specify the log level in the data you send to Axiom. For more information, see [Requirements for log level fields](/reference/limits#requirements-for-log-level-fields).
2. In the Stream tab, click
For more information, see [Saved queries](/query-data/datasets#saved-queries).
## Highlight severity [#highlight-severity]
The Stream tab allows you to easily detect warnings and errors in your logs by highlighting the severity of log entries in different colors.
To highlight the severity of log entries:
1. Specify the log level in the data you send to Axiom. For more information, see [Requirements for log level fields](/reference/limits#requirements-for-log-level-fields).
2. In the Stream tab, click 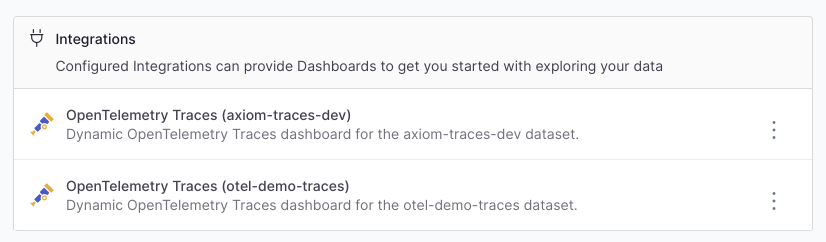
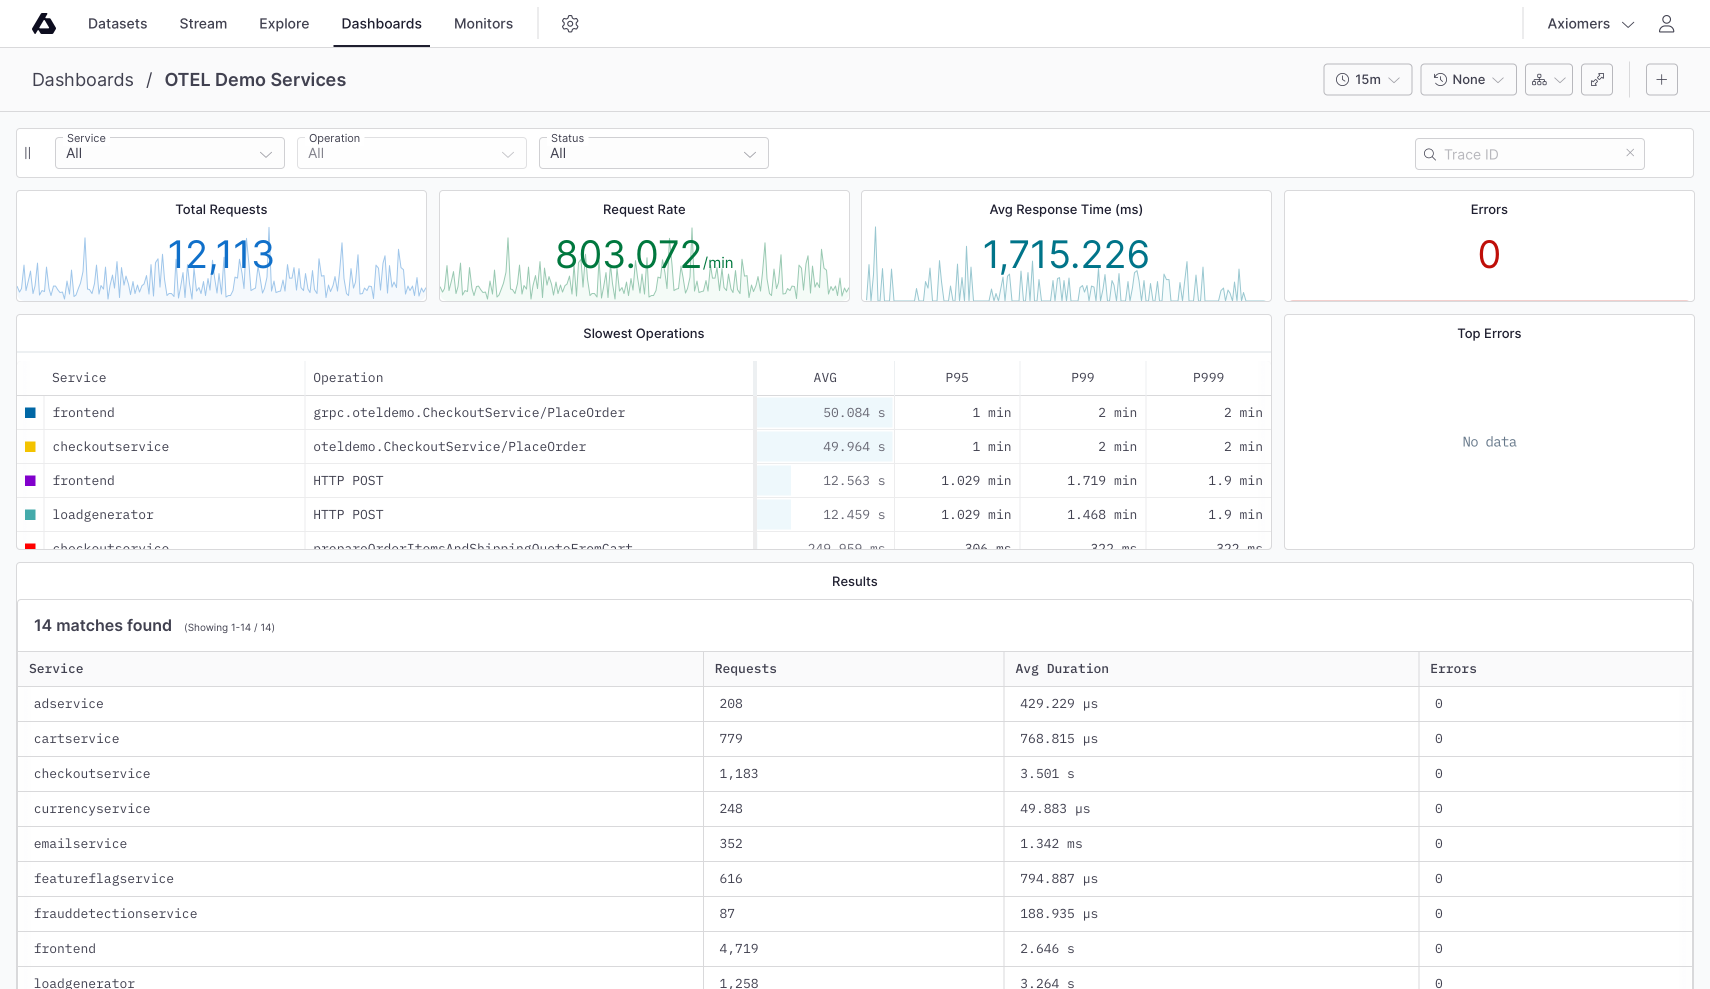 ### Navigate the app [#navigate-the-app]
* Use the **Filter Bar** at the top of the app to narrow the charts to a specific service or operation.
* Use the **Search Input** to find a trace ID in the selected time period.
* Use the **Slowest Operations** chart to identify performance issues across services and traces.
* Use the **Top Errors** list to quickly identify the worst-offending causes of errors.
* Use the **Results** table to get an overview and navigate between services, operations, and traces.
### View a trace [#view-a-trace]
Click a trace ID in the results table to show the waterfall view. This view allows you to see that span in the context of the entire trace from start to finish.
### Navigate the app [#navigate-the-app]
* Use the **Filter Bar** at the top of the app to narrow the charts to a specific service or operation.
* Use the **Search Input** to find a trace ID in the selected time period.
* Use the **Slowest Operations** chart to identify performance issues across services and traces.
* Use the **Top Errors** list to quickly identify the worst-offending causes of errors.
* Use the **Results** table to get an overview and navigate between services, operations, and traces.
### View a trace [#view-a-trace]
Click a trace ID in the results table to show the waterfall view. This view allows you to see that span in the context of the entire trace from start to finish.
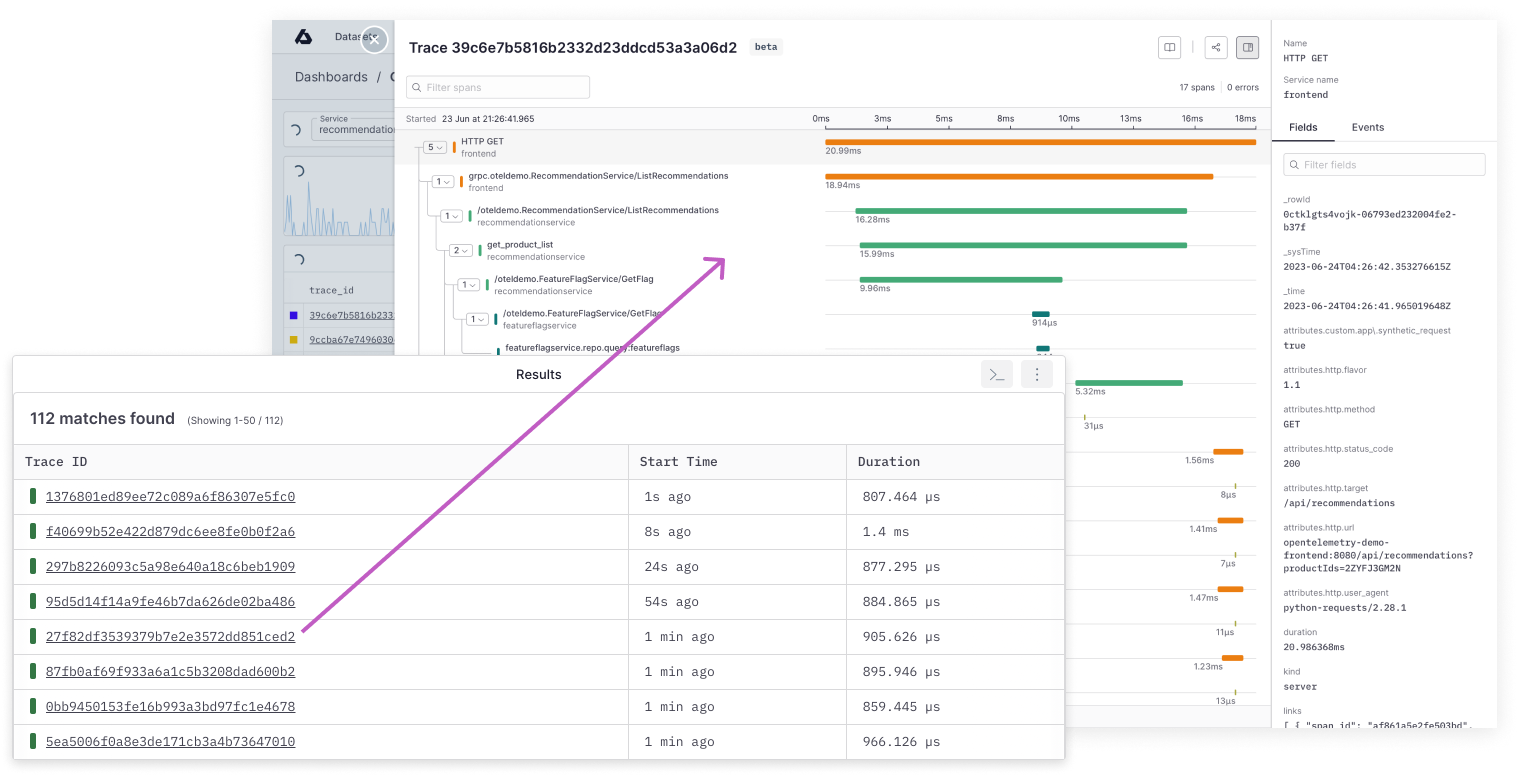 ### Customize the app [#customize-the-app]
To customize the app, use the fork button to create an editable duplicate for you and your team.
## Query traces [#query-traces]
In Axiom, trace events are just like any other events inside datasets. This means they’re directly queryable in the UI. While this is can be a powerful experience, it’s important to note some important details to consider before querying:
* Directly aggregating upon the `duration` field produces aggregate values across every span in the dataset. This is usually not the desired outcome when you want to inspect a service’s performance or robustness.
* For request, rate, and duration aggregations, it’s best to only include the root span using `isnull(parent_span_id)`.
## Waterfall view of traces [#waterfall-view-of-traces]
To see how spans in a trace are related to each other, explore the trace in a waterfall view. In this view, each span in the trace is correlated with its parent and child spans.
### Traces in OpenTelemetry Traces dashboard [#traces-in-opentelemetry-traces-dashboard]
To explore spans within a trace using the OpenTelemetry Traces app, follow these steps:
1. Click the `Dashboards` tab.
2. Click `OpenTelemetry Traces`.
3. In the `Slowest Operations` chart, click the service that contains the trace.
4. In the list of trace IDs, click the trace you want to explore.
5. Explore how spans within the trace are related to each other in the waterfall view. To reveal additional options such as collapsing and expanding child spans, right-click a span.
### Customize the app [#customize-the-app]
To customize the app, use the fork button to create an editable duplicate for you and your team.
## Query traces [#query-traces]
In Axiom, trace events are just like any other events inside datasets. This means they’re directly queryable in the UI. While this is can be a powerful experience, it’s important to note some important details to consider before querying:
* Directly aggregating upon the `duration` field produces aggregate values across every span in the dataset. This is usually not the desired outcome when you want to inspect a service’s performance or robustness.
* For request, rate, and duration aggregations, it’s best to only include the root span using `isnull(parent_span_id)`.
## Waterfall view of traces [#waterfall-view-of-traces]
To see how spans in a trace are related to each other, explore the trace in a waterfall view. In this view, each span in the trace is correlated with its parent and child spans.
### Traces in OpenTelemetry Traces dashboard [#traces-in-opentelemetry-traces-dashboard]
To explore spans within a trace using the OpenTelemetry Traces app, follow these steps:
1. Click the `Dashboards` tab.
2. Click `OpenTelemetry Traces`.
3. In the `Slowest Operations` chart, click the service that contains the trace.
4. In the list of trace IDs, click the trace you want to explore.
5. Explore how spans within the trace are related to each other in the waterfall view. To reveal additional options such as collapsing and expanding child spans, right-click a span.
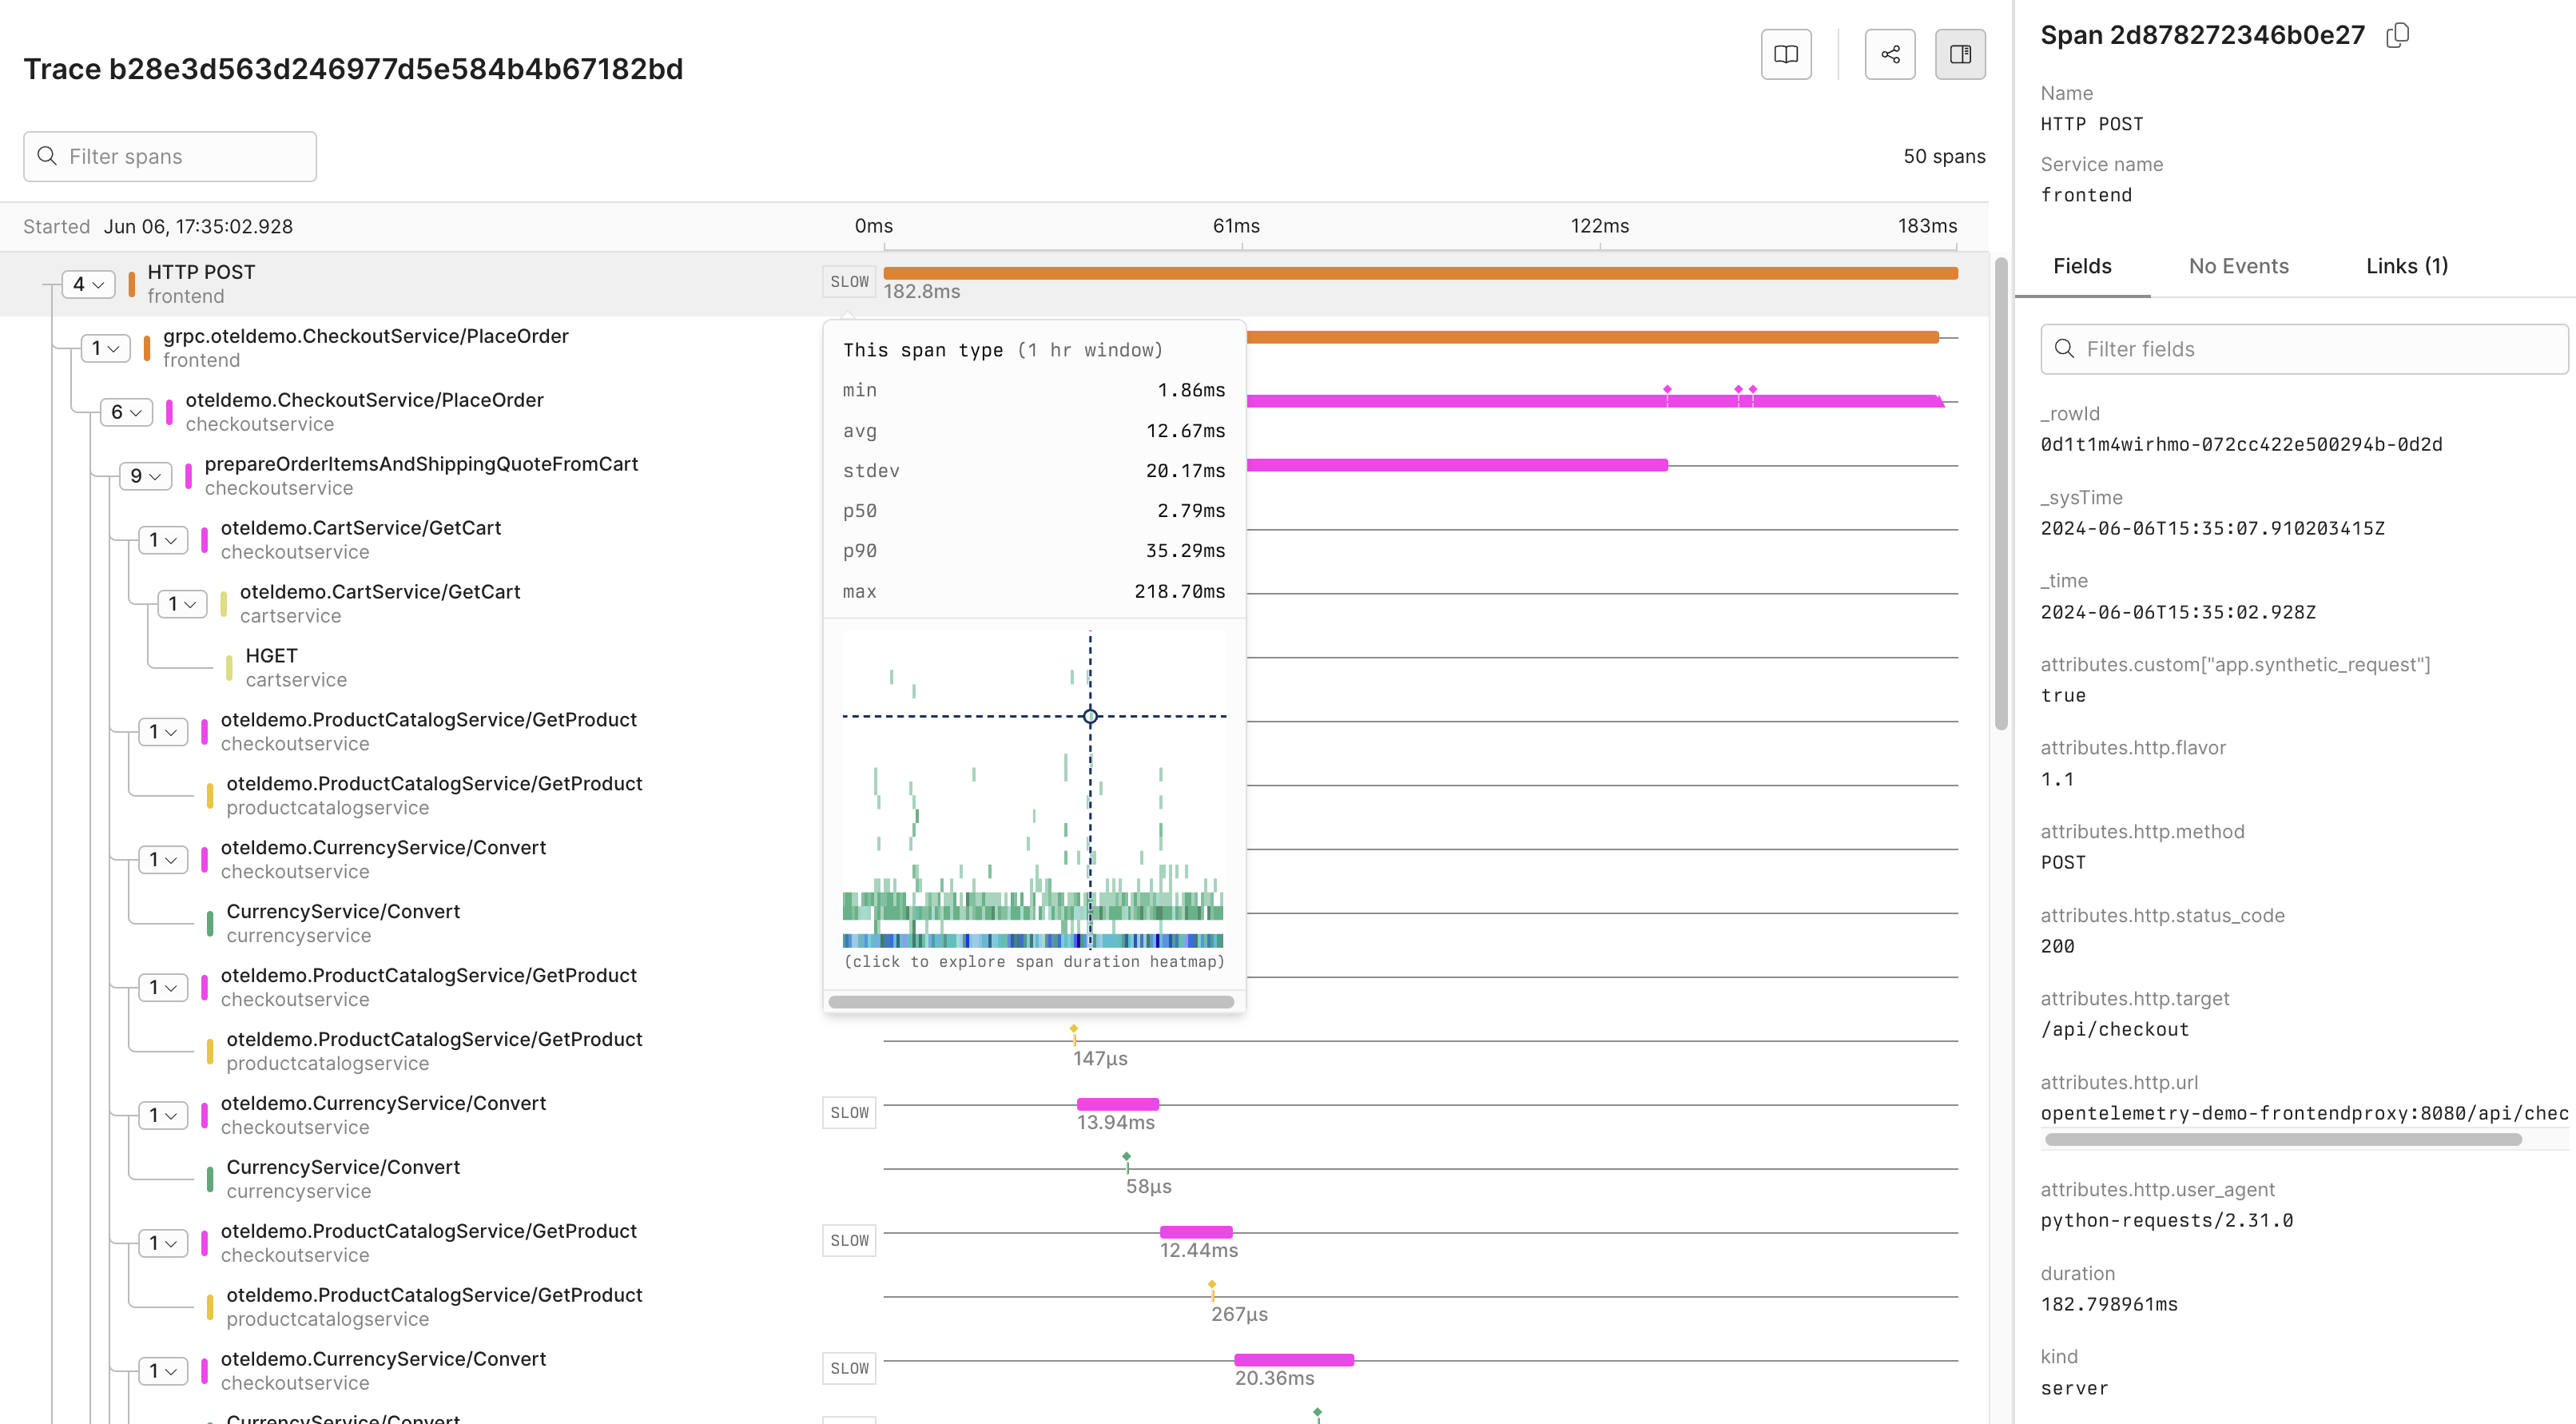 To try out this example, go to the Axiom Playground.
[Run in Playground](https://play.axiom.co/axiom-play-qf1k/dashboards/otel.traces.otel-demo-traces)
### Traces in Query tab [#traces-in-query-tab]
To access the waterfall view from the Query tab, follow these steps:
1. Ensure the dataset you work with has trace data.
2. Click the Query tab.
3. Run a query that returns the `_time` and `trace_id` fields. For example, the following query returns the number of spans in each trace:
```kusto
['otel-demo-traces']
| summarize count() by trace_id
```
4. In the list of trace IDs, click the trace you want to explore. To reveal additional options such as copying the trace ID, right-click a trace.
5. Explore how spans within the trace are related to each other in the waterfall view. To reveal additional options such as collapsing and expanding child spans, right-click a span. Event names are displayed on the timeline for each span.
To try out this example, go to the Axiom Playground.
[Run in Playground](https://play.axiom.co/axiom-play-qf1k/query?initForm=%7B%22apl%22%3A%22%5B'otel-demo-traces'%5D%5Cn%7C%20summarize%20count\(\)%20by%20trace_id%22%7D)
To try out this example, go to the Axiom Playground.
[Run in Playground](https://play.axiom.co/axiom-play-qf1k/dashboards/otel.traces.otel-demo-traces)
### Traces in Query tab [#traces-in-query-tab]
To access the waterfall view from the Query tab, follow these steps:
1. Ensure the dataset you work with has trace data.
2. Click the Query tab.
3. Run a query that returns the `_time` and `trace_id` fields. For example, the following query returns the number of spans in each trace:
```kusto
['otel-demo-traces']
| summarize count() by trace_id
```
4. In the list of trace IDs, click the trace you want to explore. To reveal additional options such as copying the trace ID, right-click a trace.
5. Explore how spans within the trace are related to each other in the waterfall view. To reveal additional options such as collapsing and expanding child spans, right-click a span. Event names are displayed on the timeline for each span.
To try out this example, go to the Axiom Playground.
[Run in Playground](https://play.axiom.co/axiom-play-qf1k/query?initForm=%7B%22apl%22%3A%22%5B'otel-demo-traces'%5D%5Cn%7C%20summarize%20count\(\)%20by%20trace_id%22%7D)
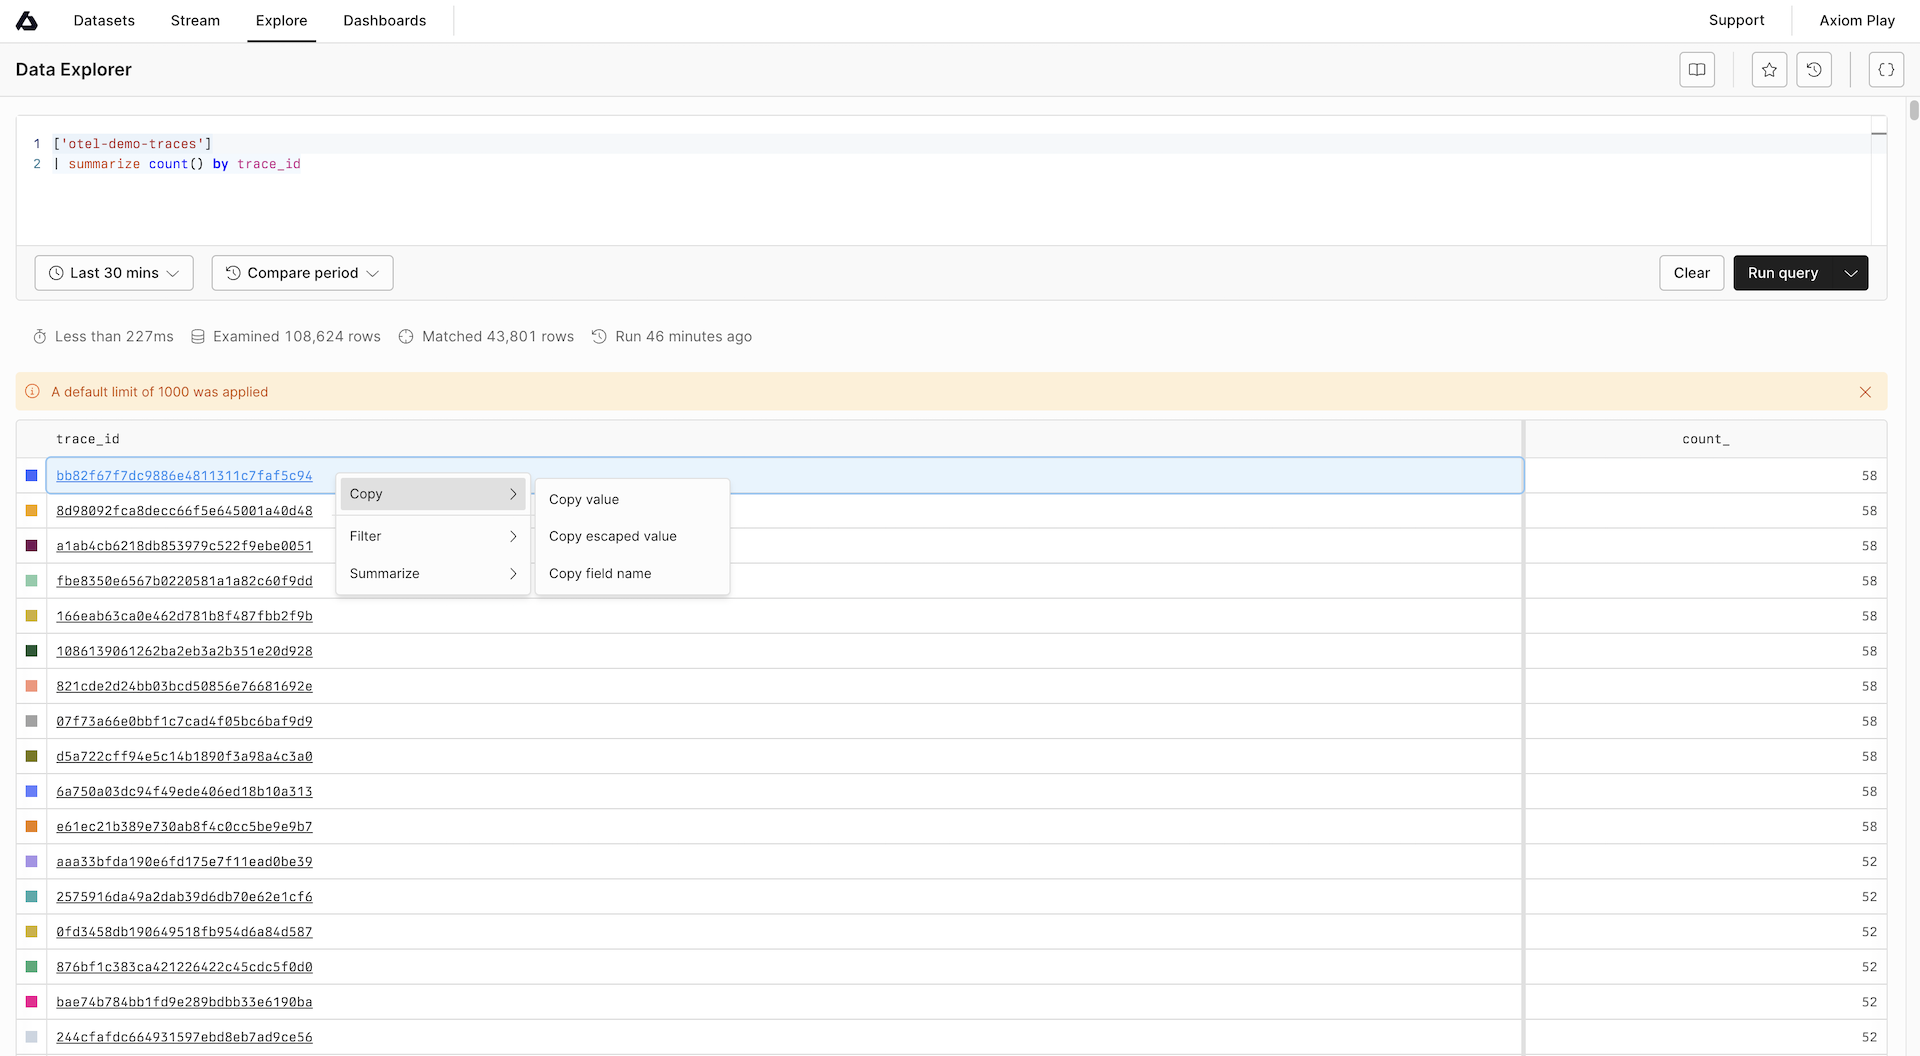 ### Customize waterfall view [#customize-waterfall-view]
To toggle the display of the span details on the right, click
### Customize waterfall view [#customize-waterfall-view]
To toggle the display of the span details on the right, click `not ("us-east-1" contains "us")`
Use parenthesis because the operator `not` has precedence over the operator `contains`.
`myArray[1:5] == [2, 3, 4] myArray[3:] == [4, 5] myArray[:4] == [1, 2, 3] myArray[:] == myArray`
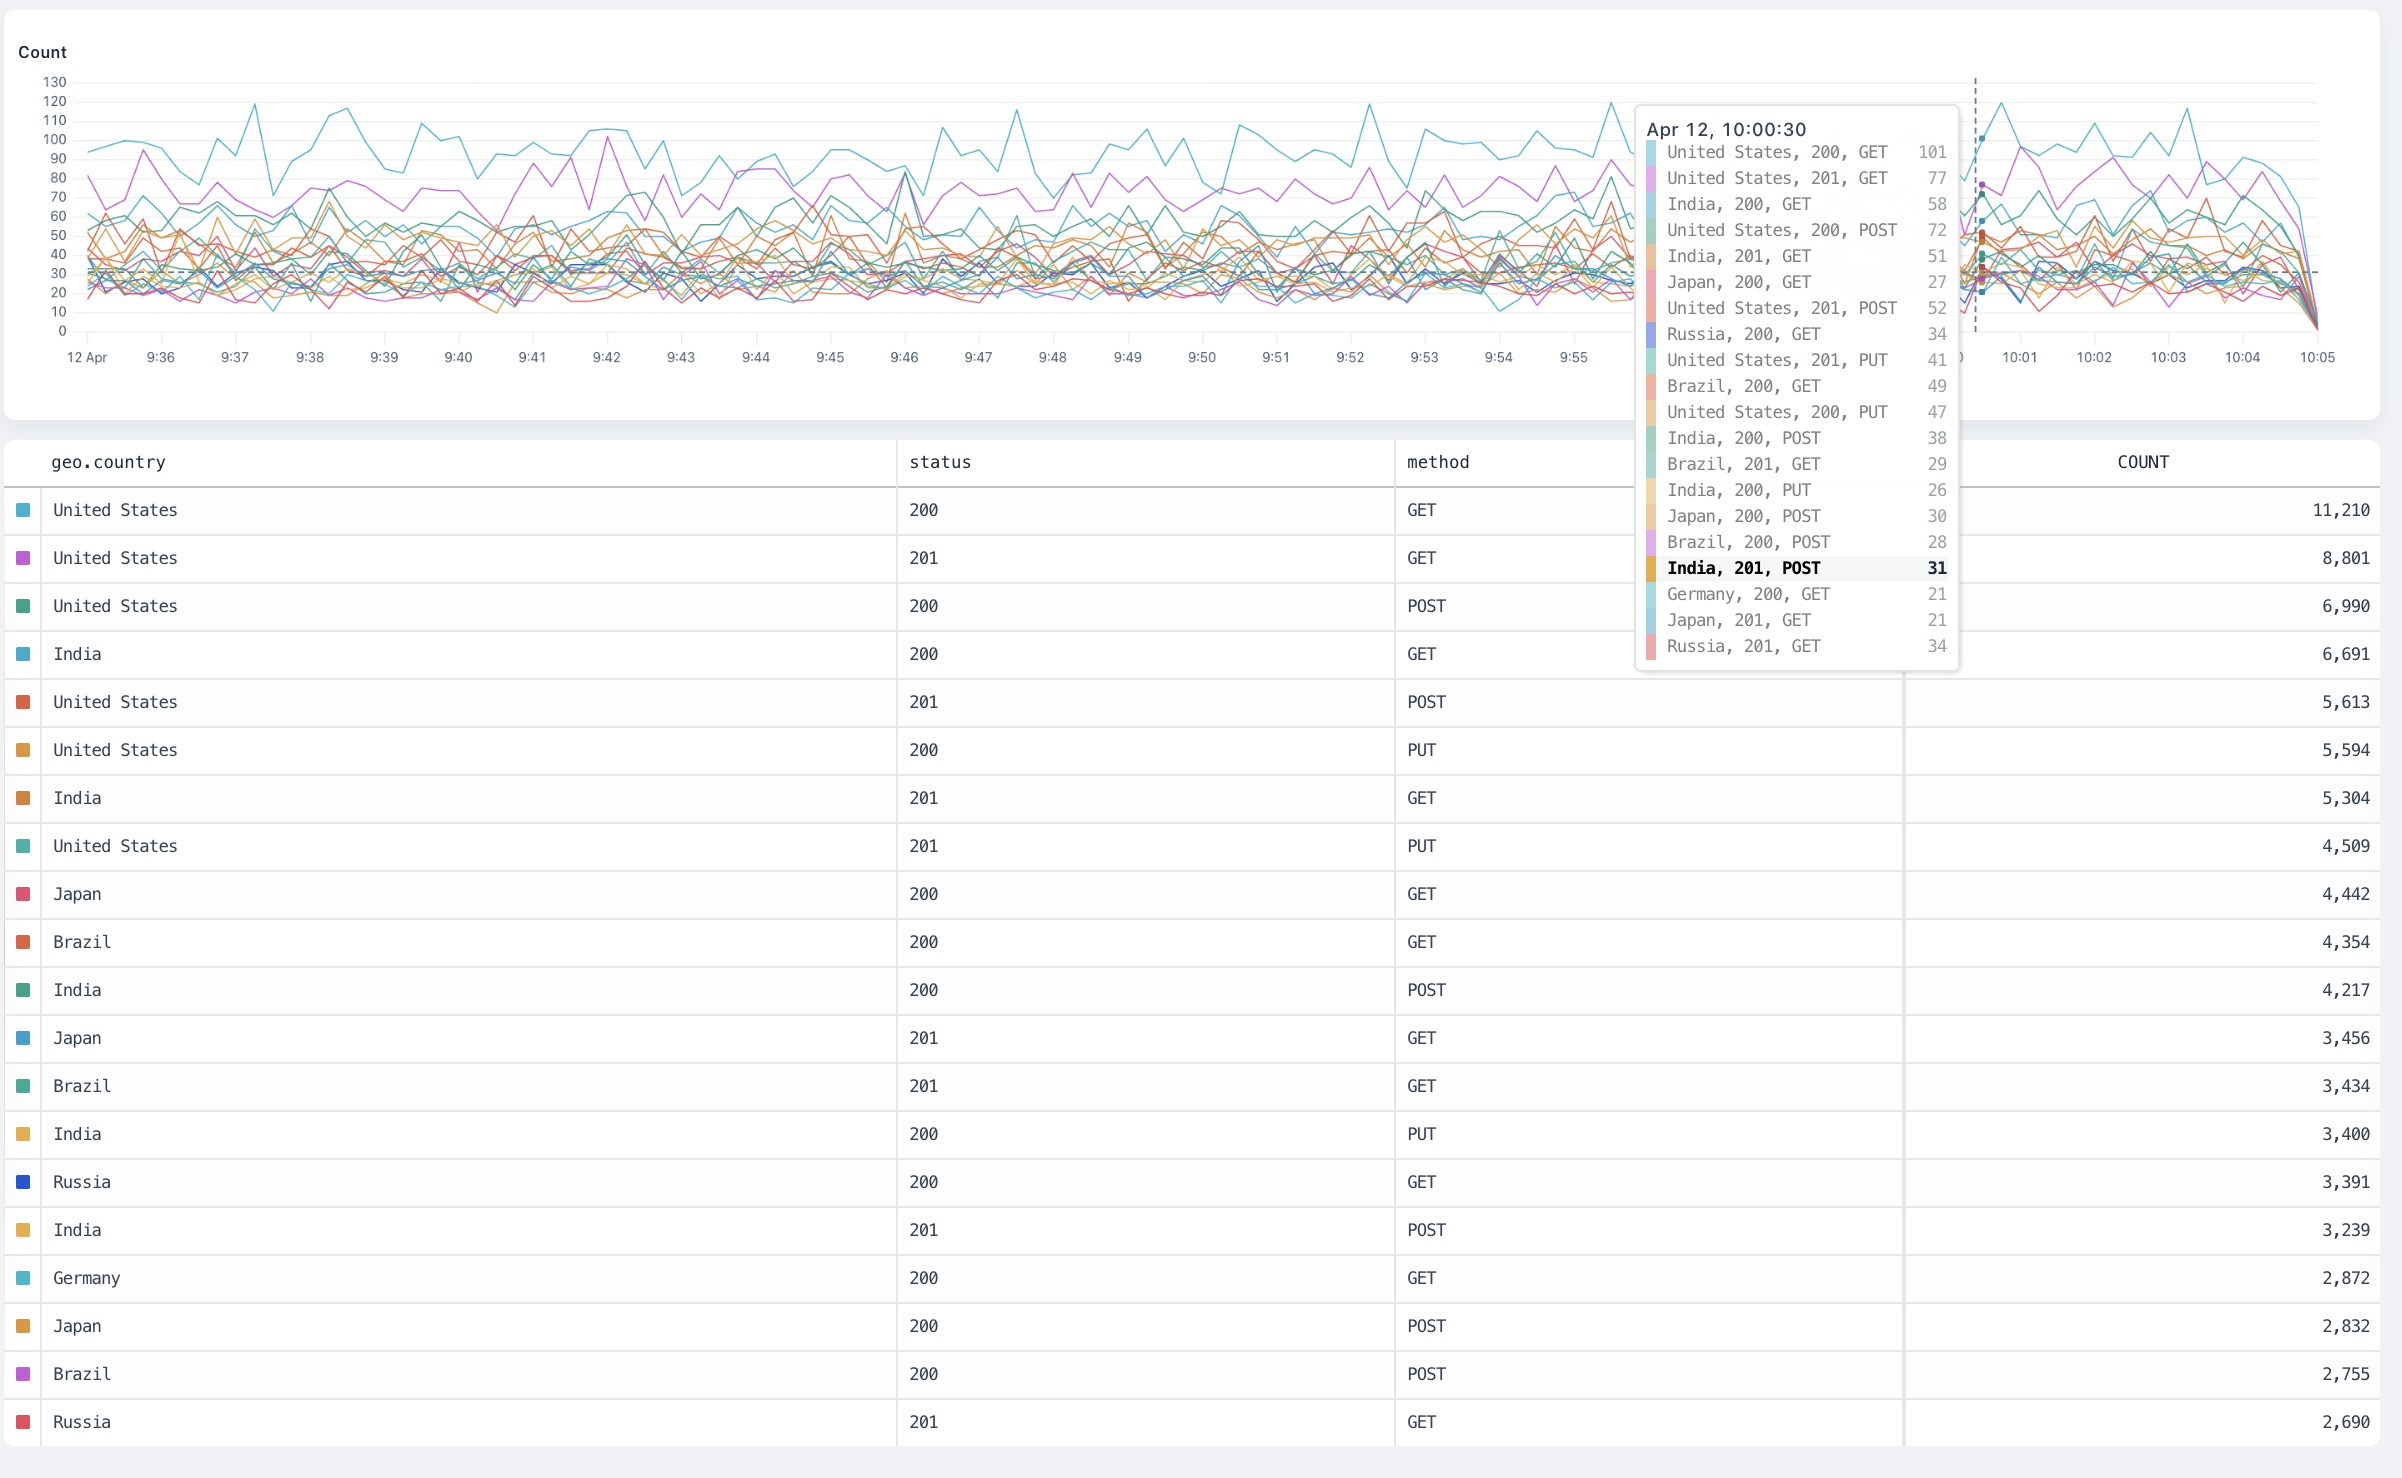 ## `distinct` [#distinct]
The `distinct` visualization counts each distinct occurrence of the distinct field inside the dataset and produce a time series chart.
#### Arguments [#arguments-1]
`field: any` is the field to aggregate.
#### Group-By Behaviour [#group-by-behaviour-1]
The visualization produces a separate result for each group plotted on a time series chart.
## `distinct` [#distinct]
The `distinct` visualization counts each distinct occurrence of the distinct field inside the dataset and produce a time series chart.
#### Arguments [#arguments-1]
`field: any` is the field to aggregate.
#### Group-By Behaviour [#group-by-behaviour-1]
The visualization produces a separate result for each group plotted on a time series chart.
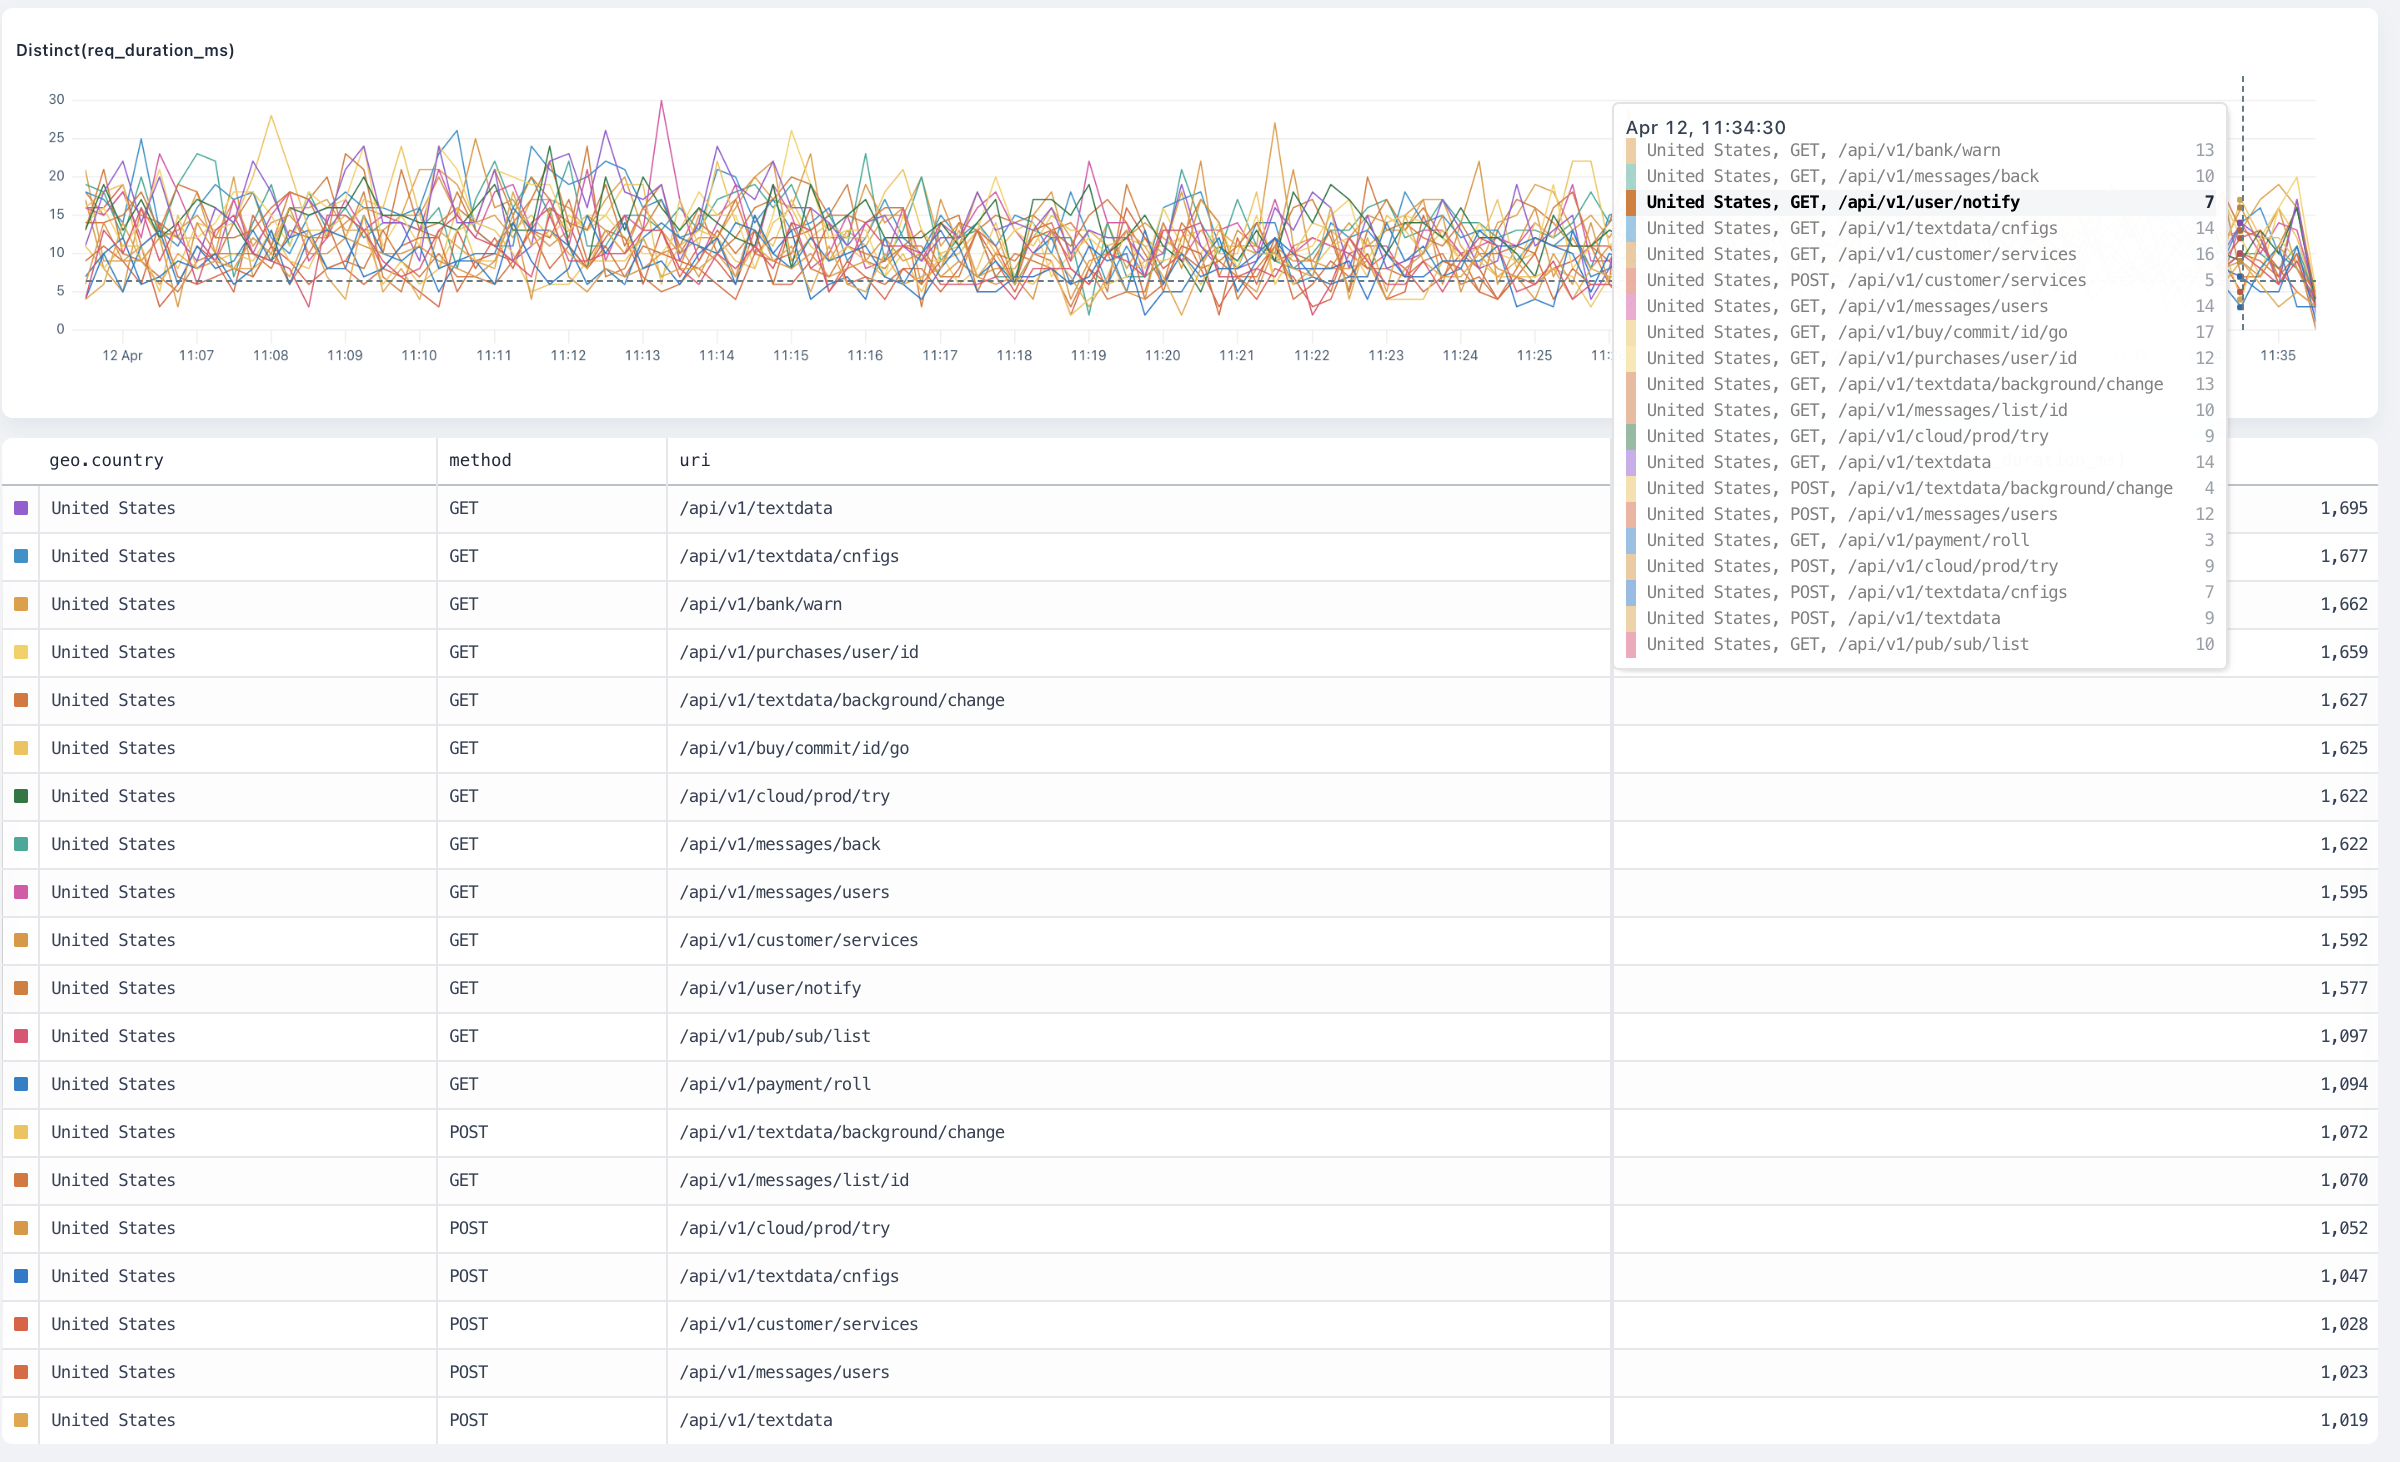 ## `avg` [#avg]
The `avg` visualization averages the values of the field inside the dataset and produces a time series chart.
#### Arguments [#arguments-2]
`field: number` is the number field to average.
#### Group-by behaviour [#group-by-behaviour-2]
The visualization produces a separate result for each group plotted on a time series chart.
## `avg` [#avg]
The `avg` visualization averages the values of the field inside the dataset and produces a time series chart.
#### Arguments [#arguments-2]
`field: number` is the number field to average.
#### Group-by behaviour [#group-by-behaviour-2]
The visualization produces a separate result for each group plotted on a time series chart.
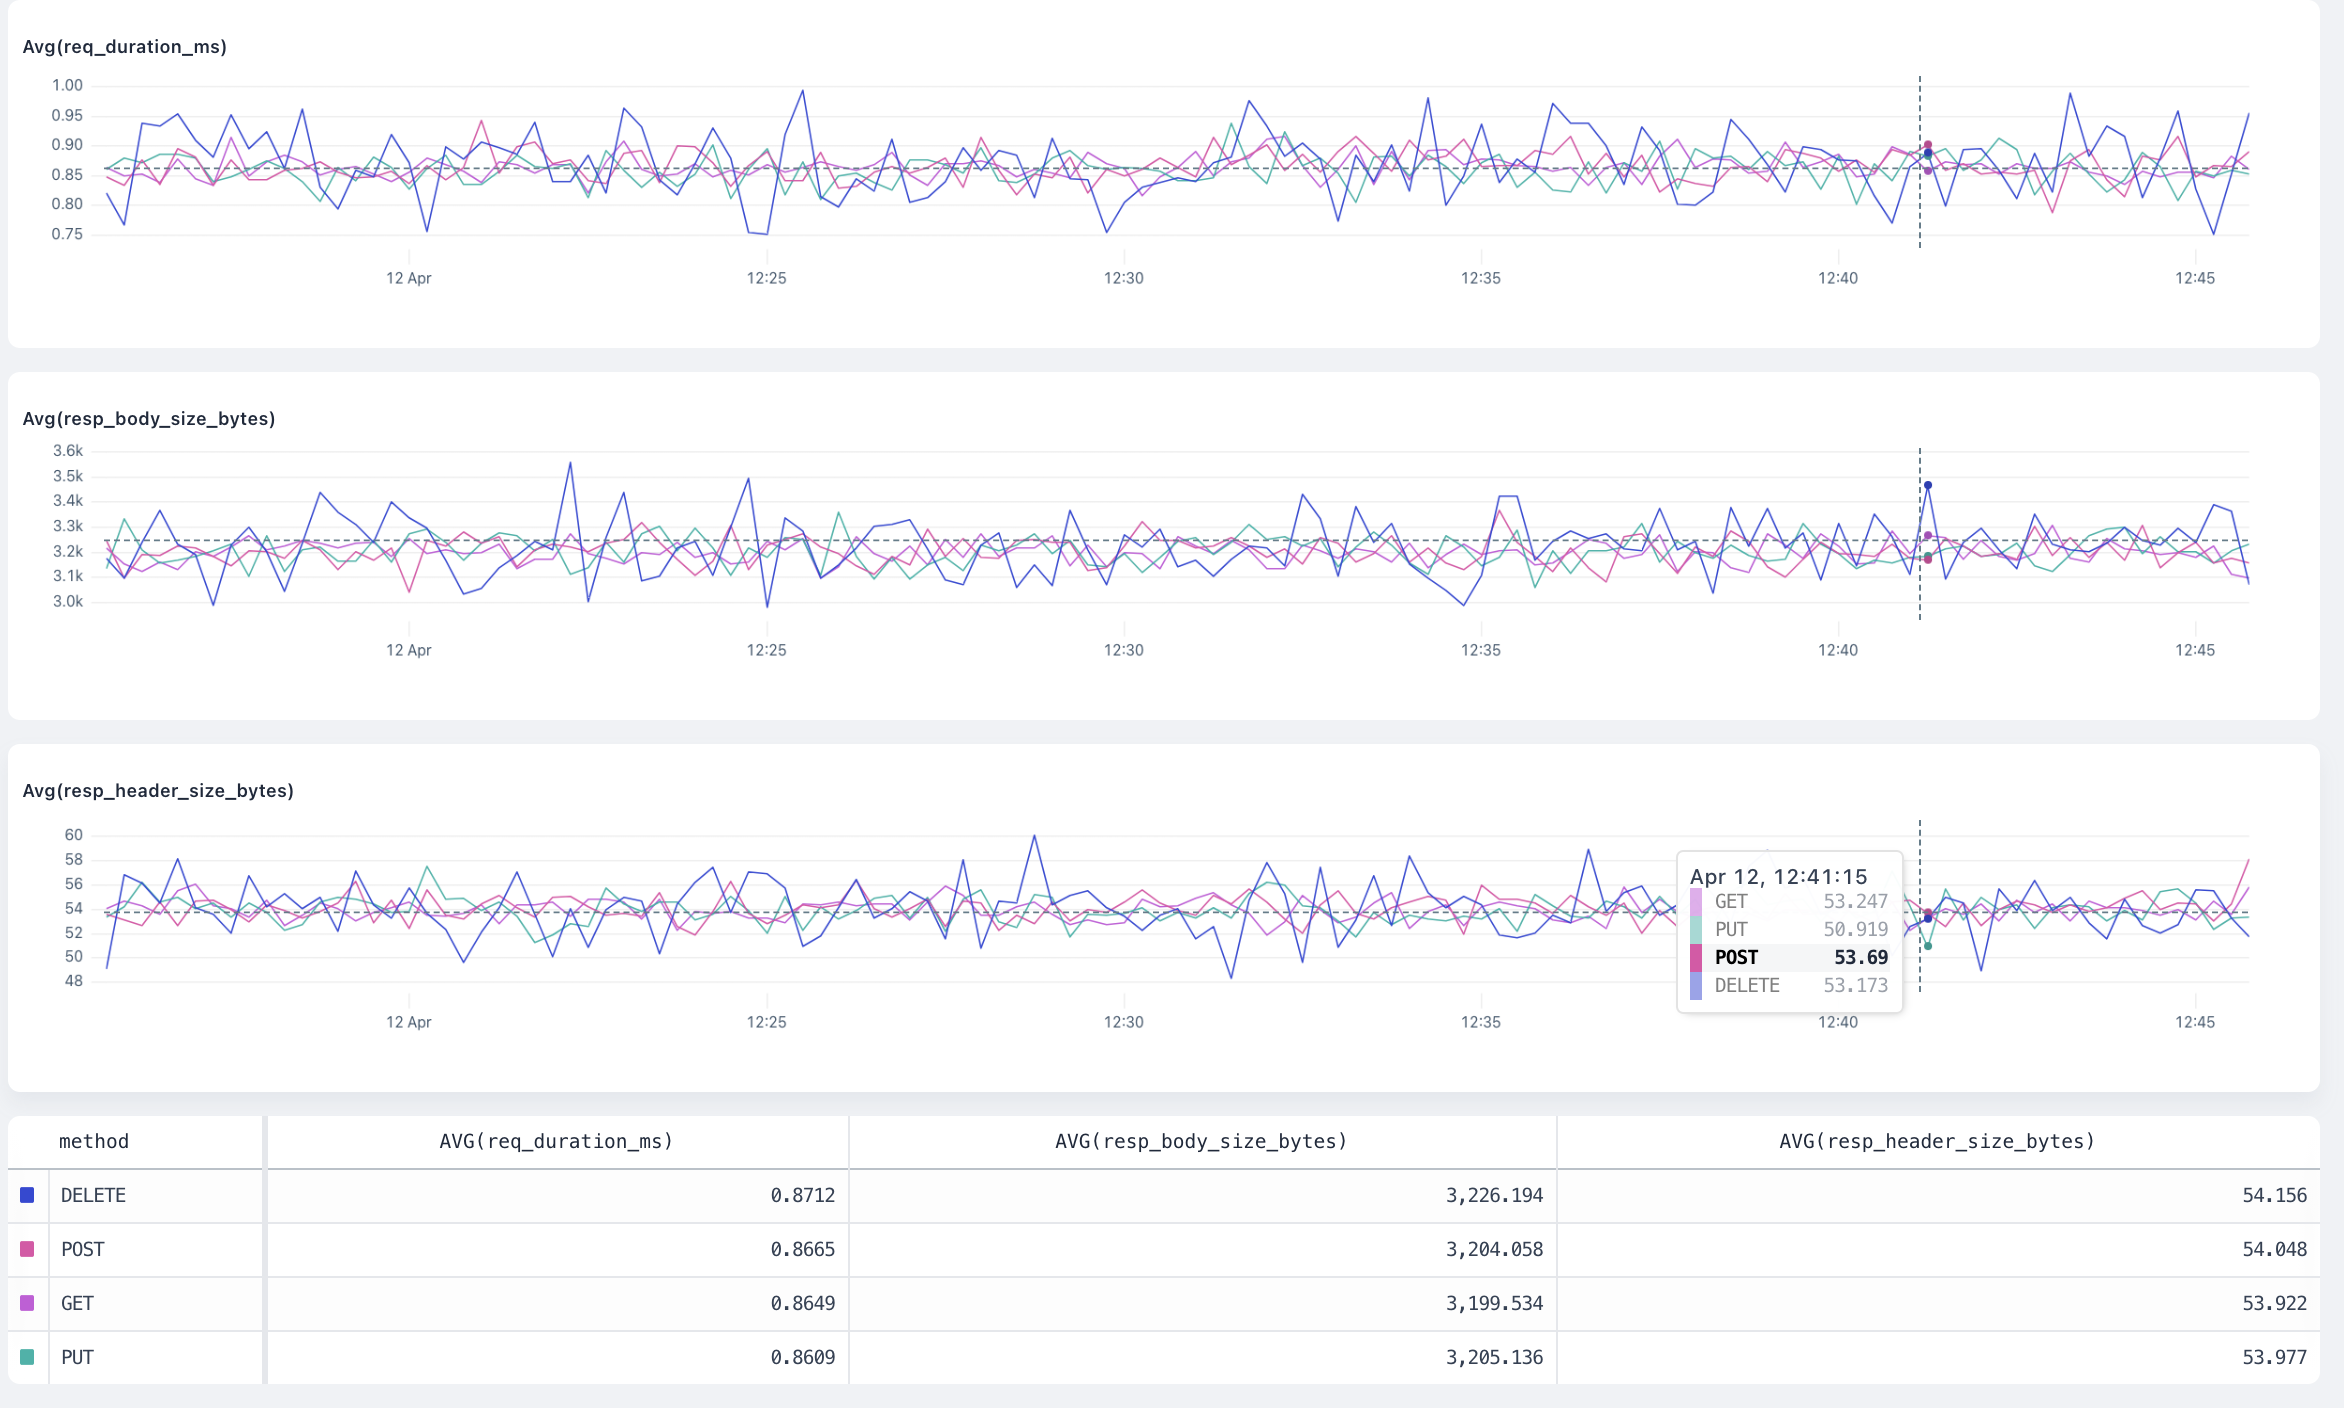 ## `max` [#max]
The `max` visualization finds the maximum value of the field inside the dataset and produces a time series chart.
#### Arguments [#arguments-3]
`field: number` is the number field where Axiom finds the maximum value.
#### Group-by behaviour [#group-by-behaviour-3]
The visualization produces a separate result for each group plotted on a time series chart.
## `max` [#max]
The `max` visualization finds the maximum value of the field inside the dataset and produces a time series chart.
#### Arguments [#arguments-3]
`field: number` is the number field where Axiom finds the maximum value.
#### Group-by behaviour [#group-by-behaviour-3]
The visualization produces a separate result for each group plotted on a time series chart.
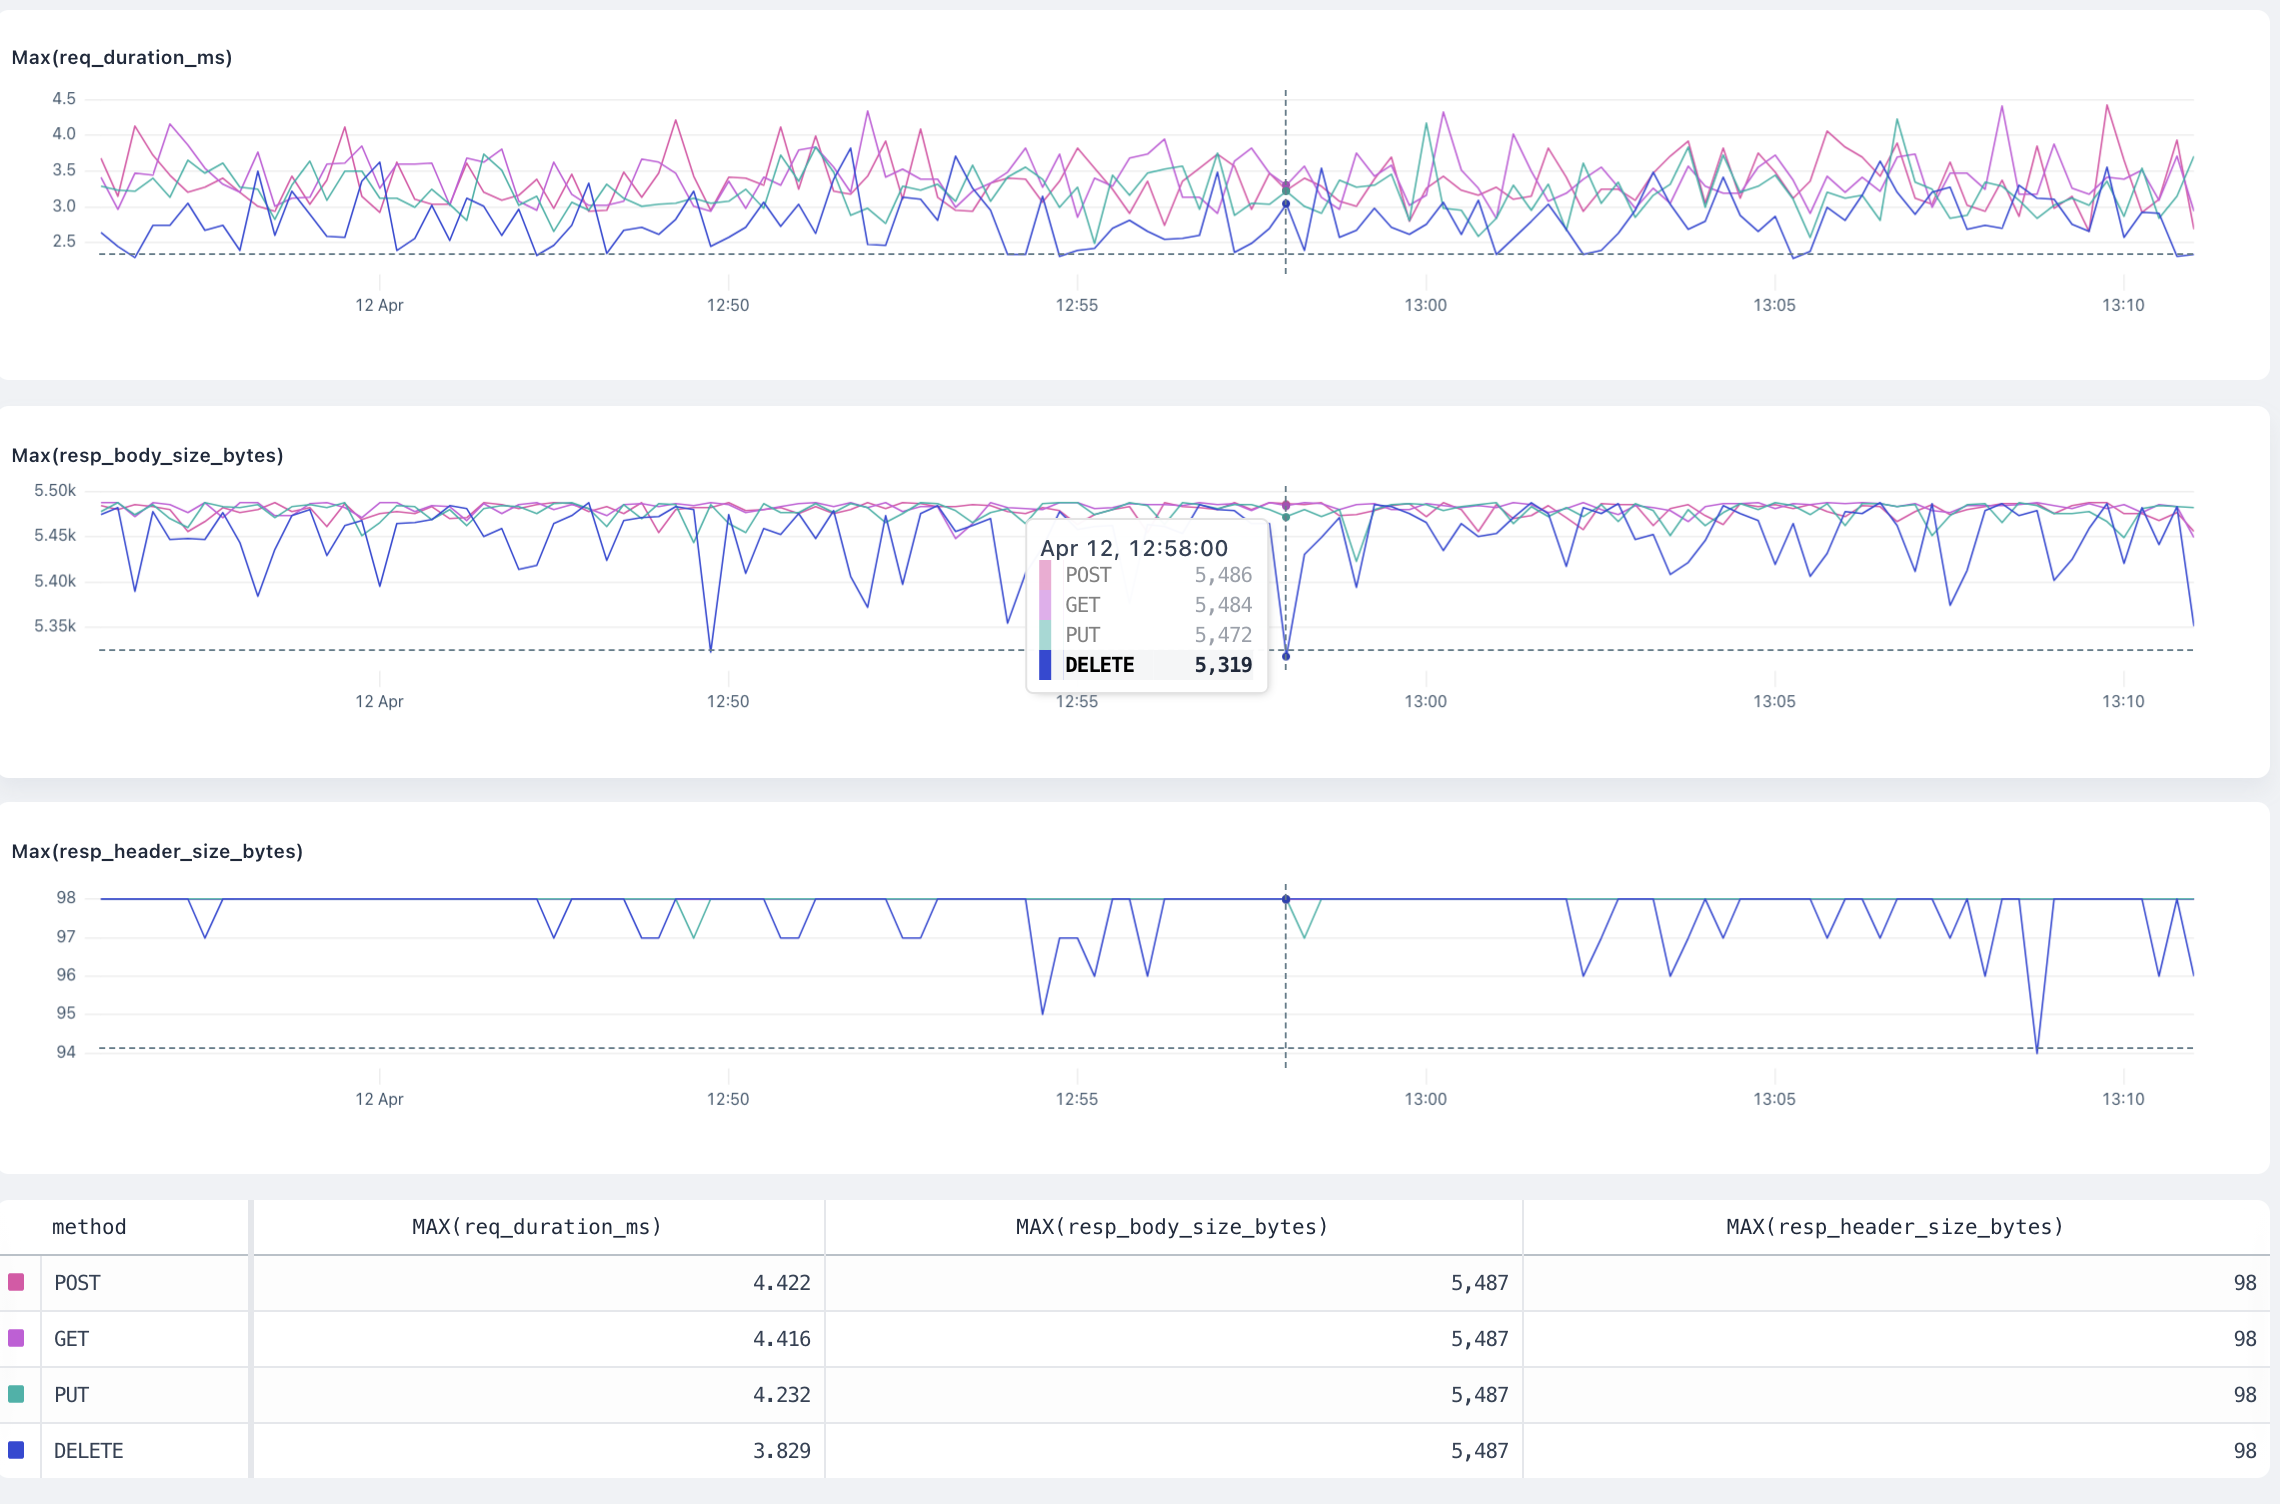 ## `min` [#min]
The `min` visualization finds the minimum value of the field inside the dataset and produces a time series chart.
#### Arguments [#arguments-4]
`field: number` is the number field where Axiom finds the minimum value.
#### Group-by behaviour [#group-by-behaviour-4]
The visualization produces a separate result for each group plotted on a time series chart.
## `min` [#min]
The `min` visualization finds the minimum value of the field inside the dataset and produces a time series chart.
#### Arguments [#arguments-4]
`field: number` is the number field where Axiom finds the minimum value.
#### Group-by behaviour [#group-by-behaviour-4]
The visualization produces a separate result for each group plotted on a time series chart.
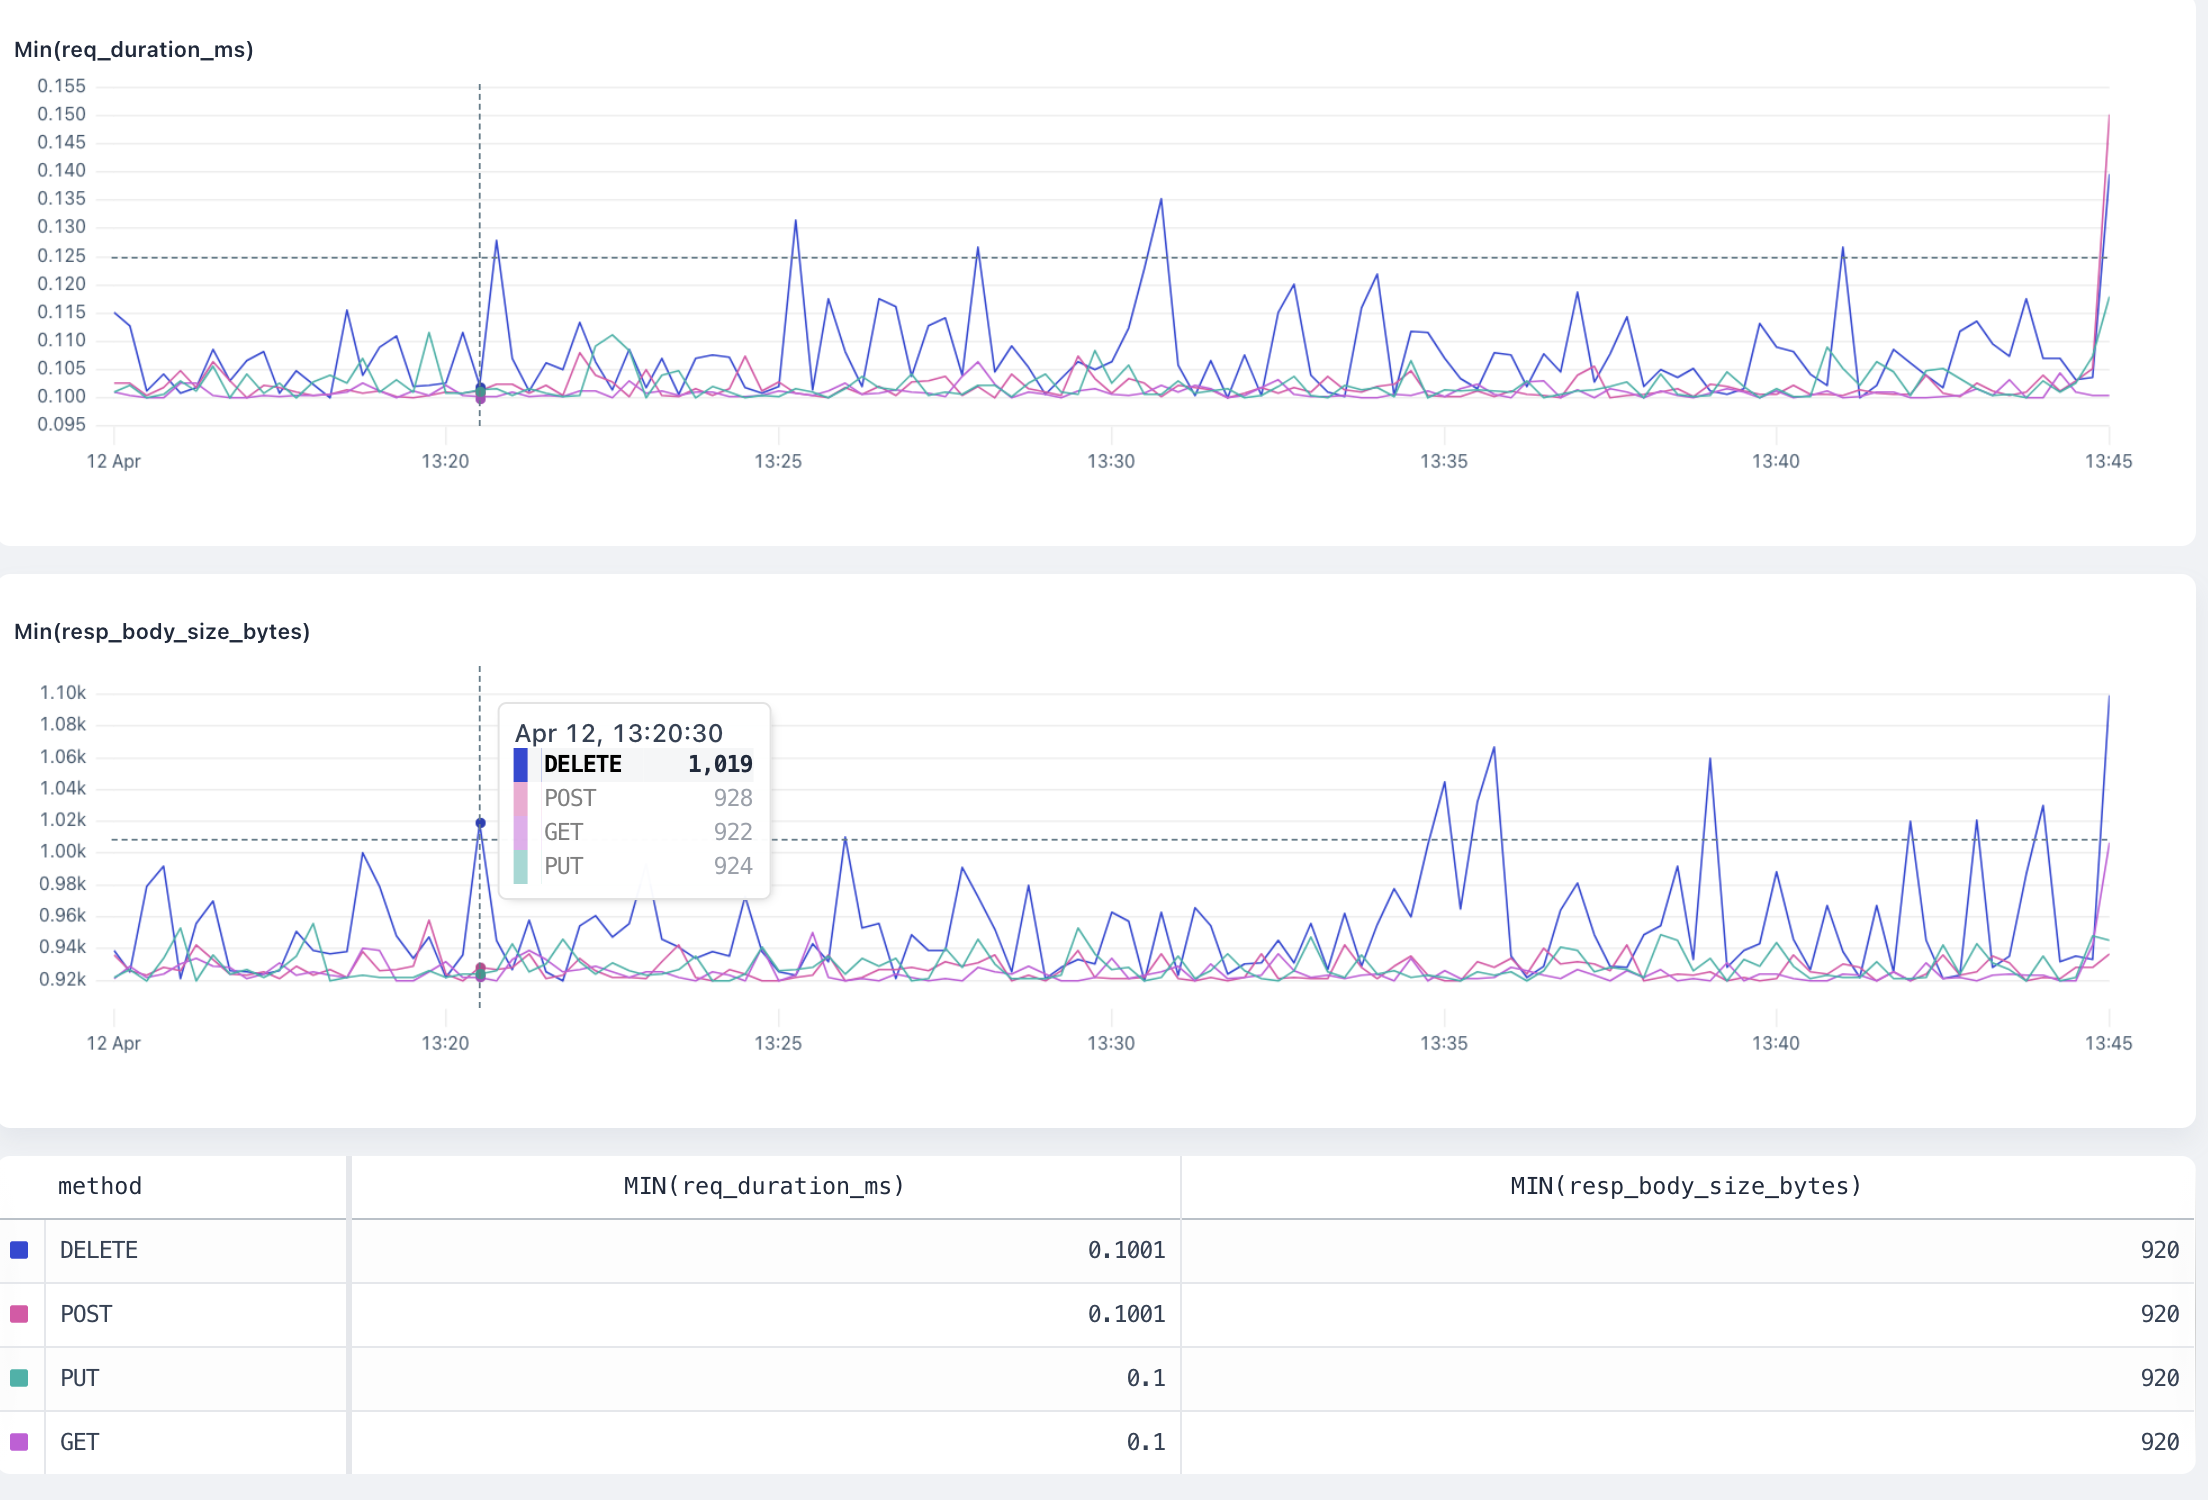 ## `sum` [#sum]
The `sum` visualization adds all the values of the field inside the dataset and produces a time series chart.
#### Arguments [#arguments-5]
`field: number` is the number field where Axiom calculates the sum.
#### Group-by behaviour [#group-by-behaviour-5]
The visualization produces a separate result for each group plotted on a time series chart.
## `sum` [#sum]
The `sum` visualization adds all the values of the field inside the dataset and produces a time series chart.
#### Arguments [#arguments-5]
`field: number` is the number field where Axiom calculates the sum.
#### Group-by behaviour [#group-by-behaviour-5]
The visualization produces a separate result for each group plotted on a time series chart.
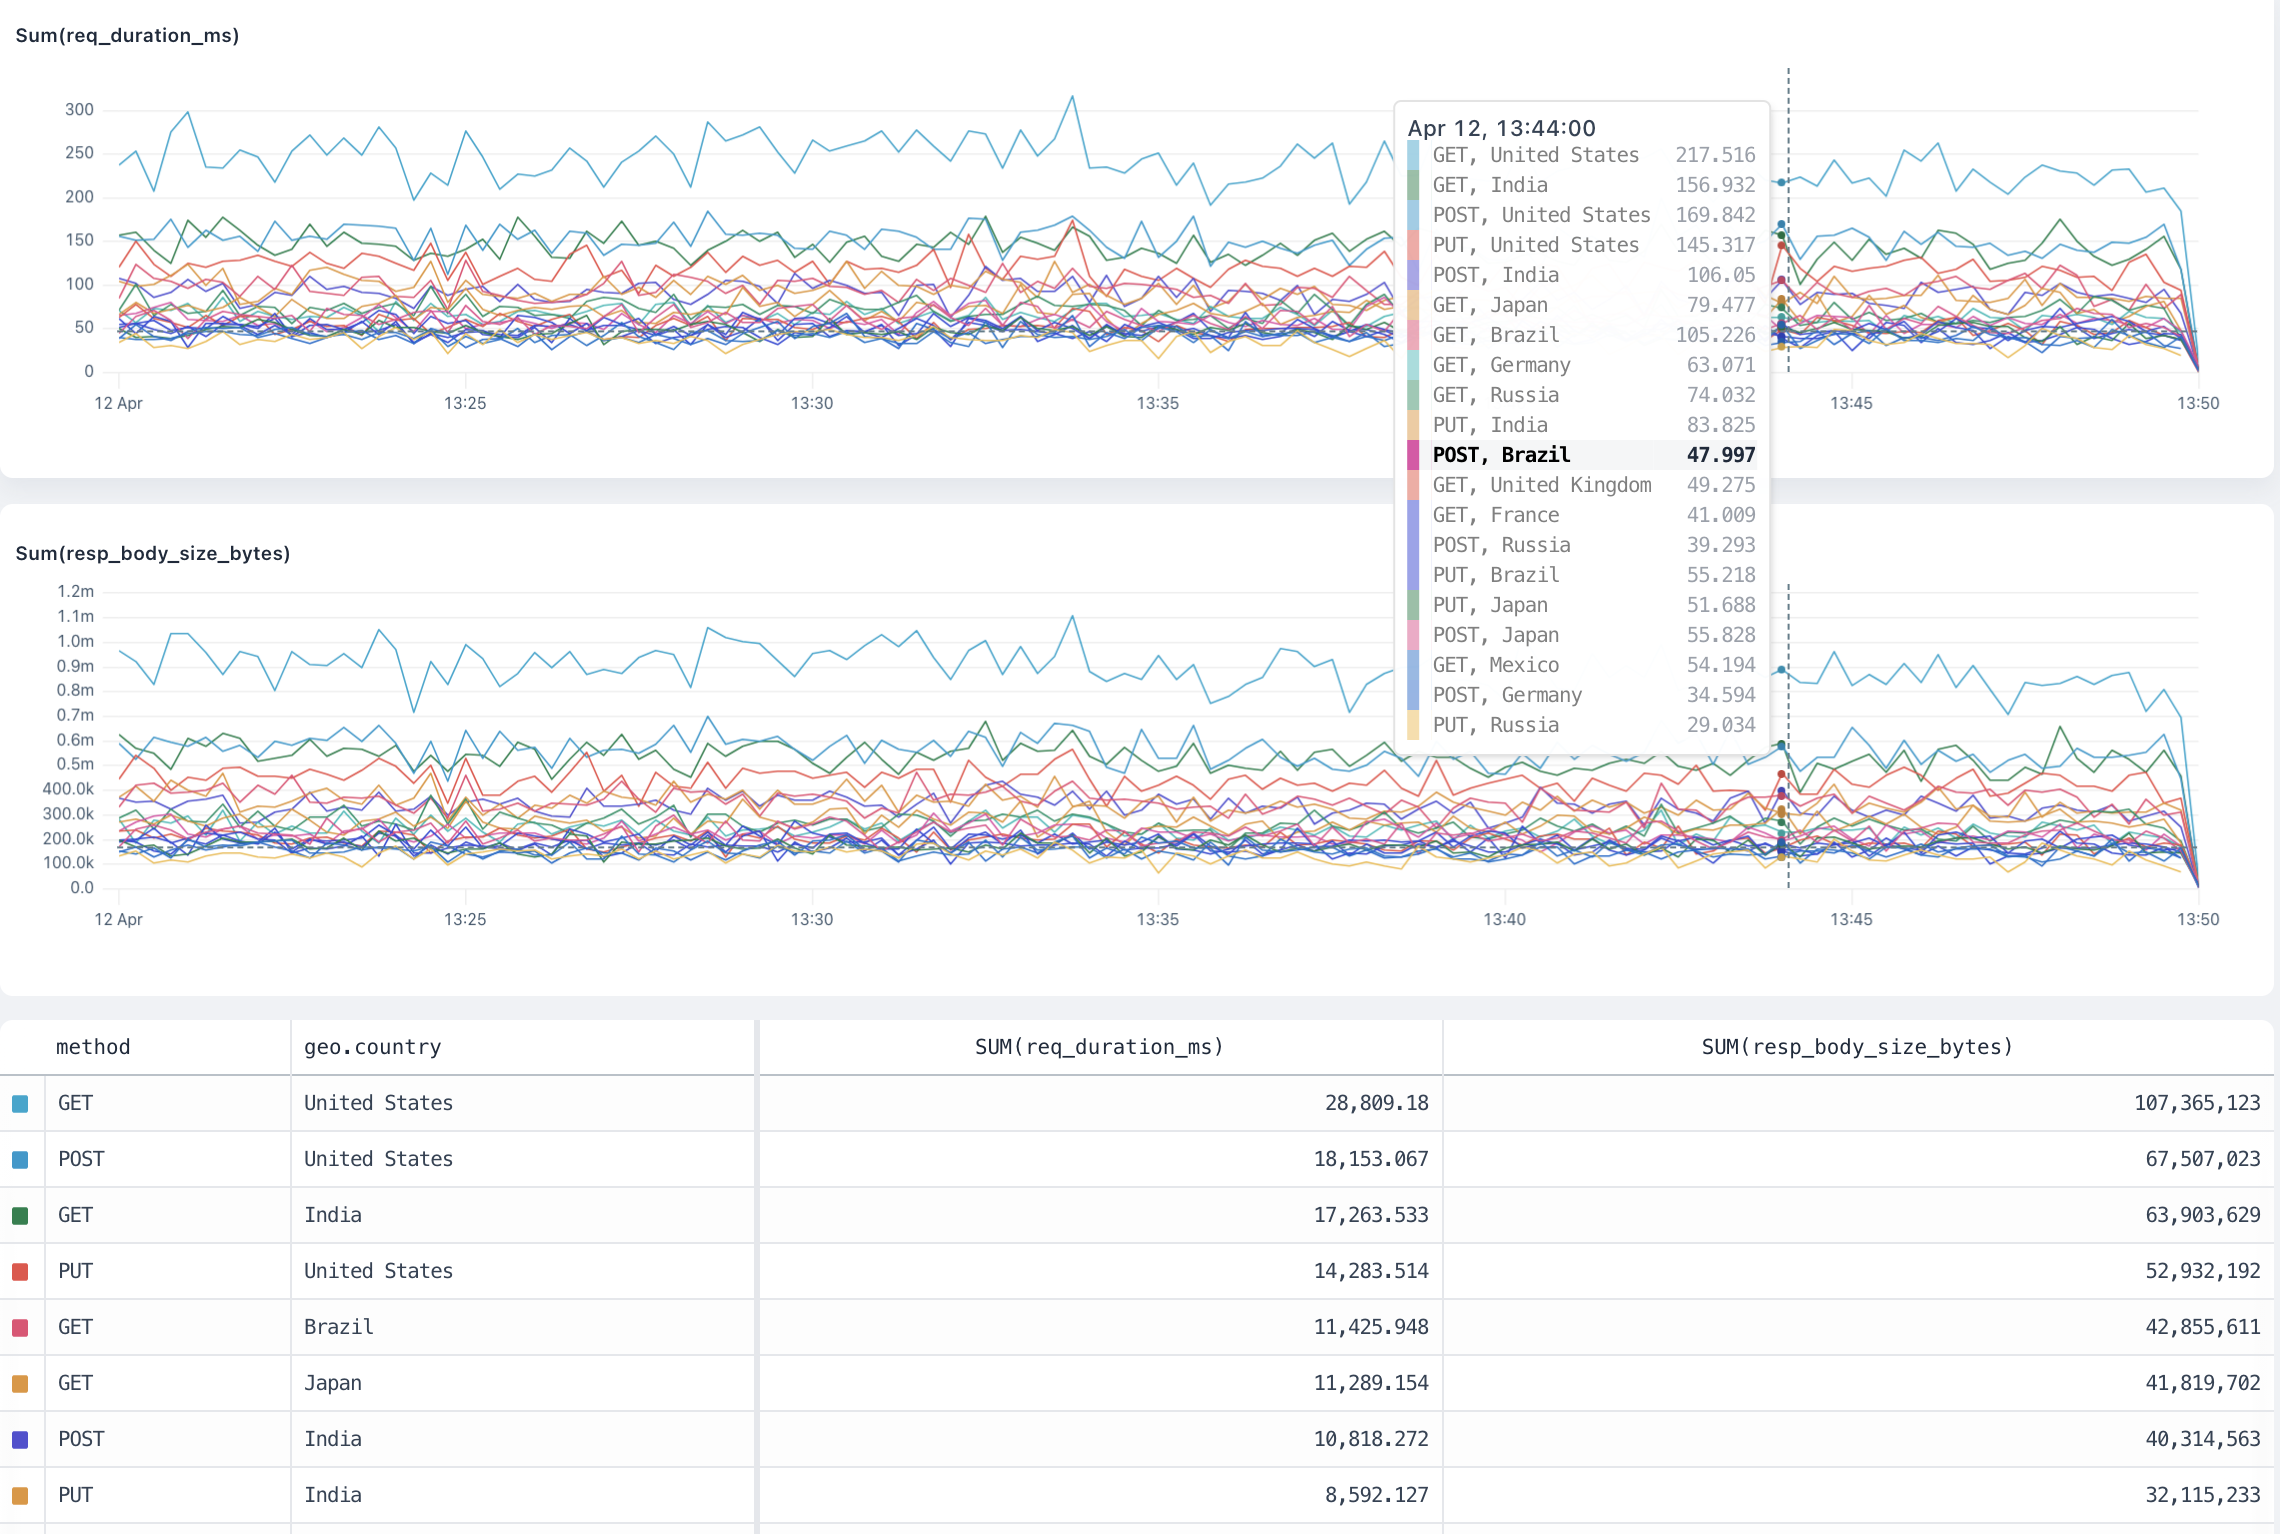 ## `percentiles` [#percentiles]
The `percentiles` visualization calculates the requested percentiles of the field in the dataset and produces a time series chart.
#### Arguments [#arguments-6]
* `field: number` is the number field where Axiom calculates the percentiles.
* `percentiles: number [, ...]` is a list of percentiles , each a float between 0 and 100. For example, `percentiles(request_size, 95, 99, 99.9)`.
#### Group-by behaviour [#group-by-behaviour-6]
The visualization produces a separate result for each group plotted on a horizontal bar chart, allowing for visual comparison across the groups.
## `percentiles` [#percentiles]
The `percentiles` visualization calculates the requested percentiles of the field in the dataset and produces a time series chart.
#### Arguments [#arguments-6]
* `field: number` is the number field where Axiom calculates the percentiles.
* `percentiles: number [, ...]` is a list of percentiles , each a float between 0 and 100. For example, `percentiles(request_size, 95, 99, 99.9)`.
#### Group-by behaviour [#group-by-behaviour-6]
The visualization produces a separate result for each group plotted on a horizontal bar chart, allowing for visual comparison across the groups.
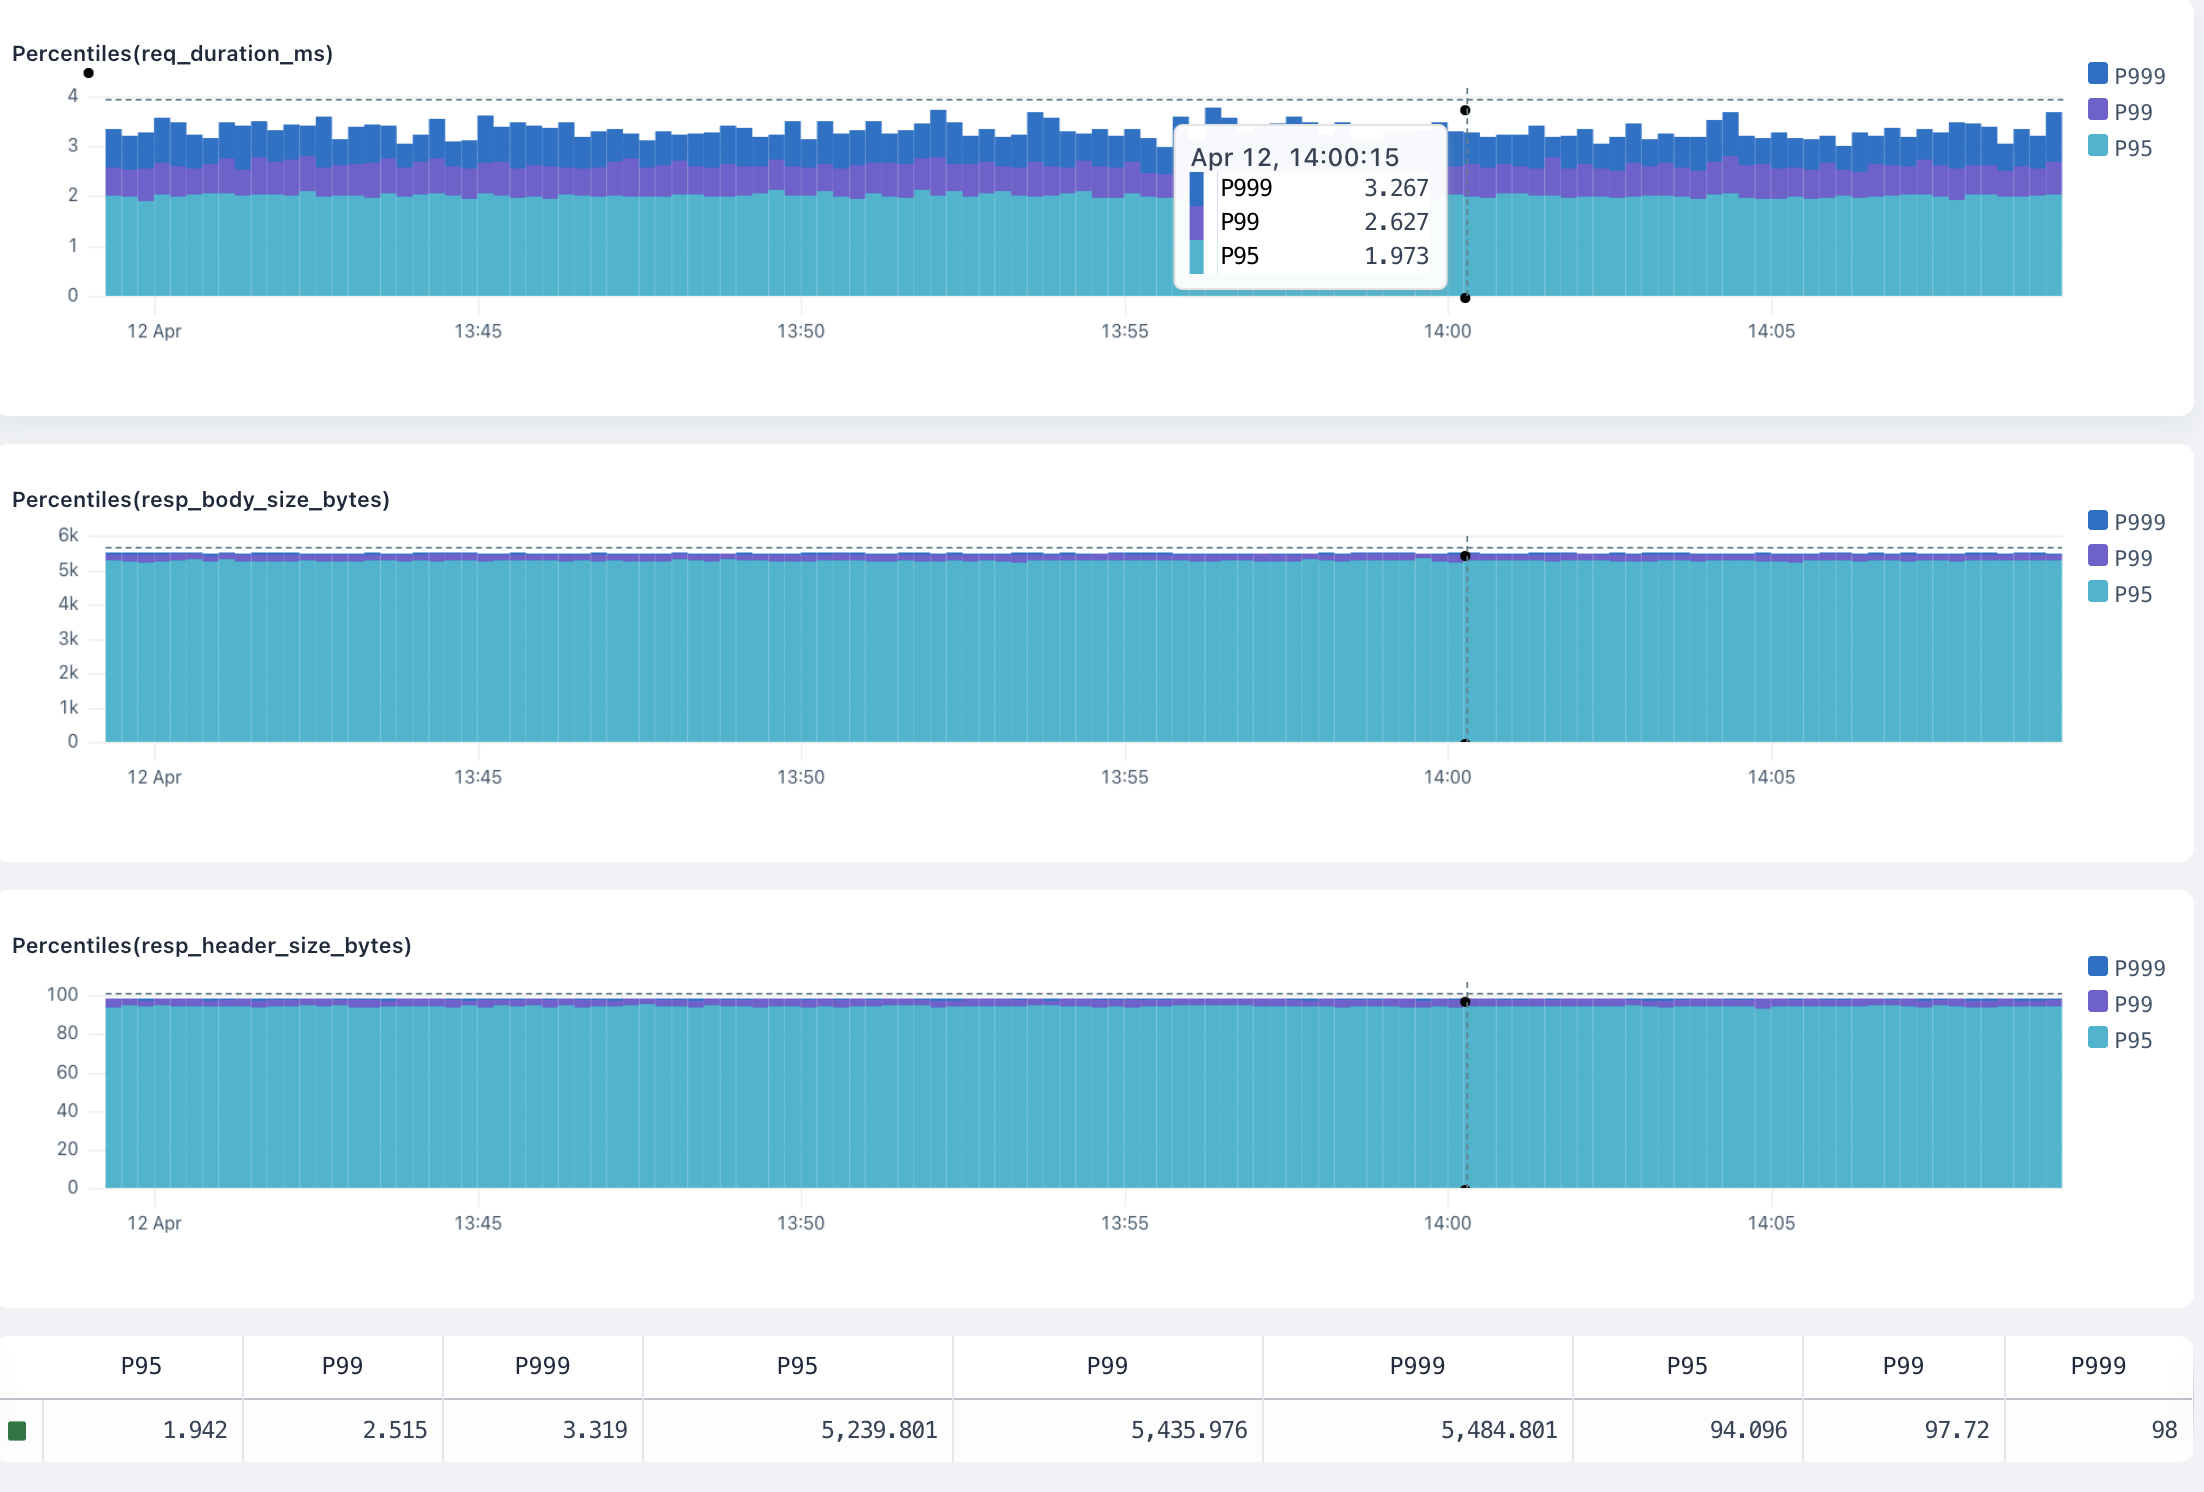 ## `histogram` [#histogram]
The `histogram` visualization buckets the field into a distribution of N buckets, returning a time series heatmap chart.
#### Arguments [#arguments-7]
* `field: number` is the number field where Axiom calculates the distribution.
* `nBuckets` is the number of buckets to return. For example, `histogram(request_size, 15)`.
#### Group-by behaviour [#group-by-behaviour-7]
The visualization produces a separate result for each group plotted on a time series histogram. Hovering over a group in the totals table shows only the results for that group in the histogram.
## `histogram` [#histogram]
The `histogram` visualization buckets the field into a distribution of N buckets, returning a time series heatmap chart.
#### Arguments [#arguments-7]
* `field: number` is the number field where Axiom calculates the distribution.
* `nBuckets` is the number of buckets to return. For example, `histogram(request_size, 15)`.
#### Group-by behaviour [#group-by-behaviour-7]
The visualization produces a separate result for each group plotted on a time series histogram. Hovering over a group in the totals table shows only the results for that group in the histogram.
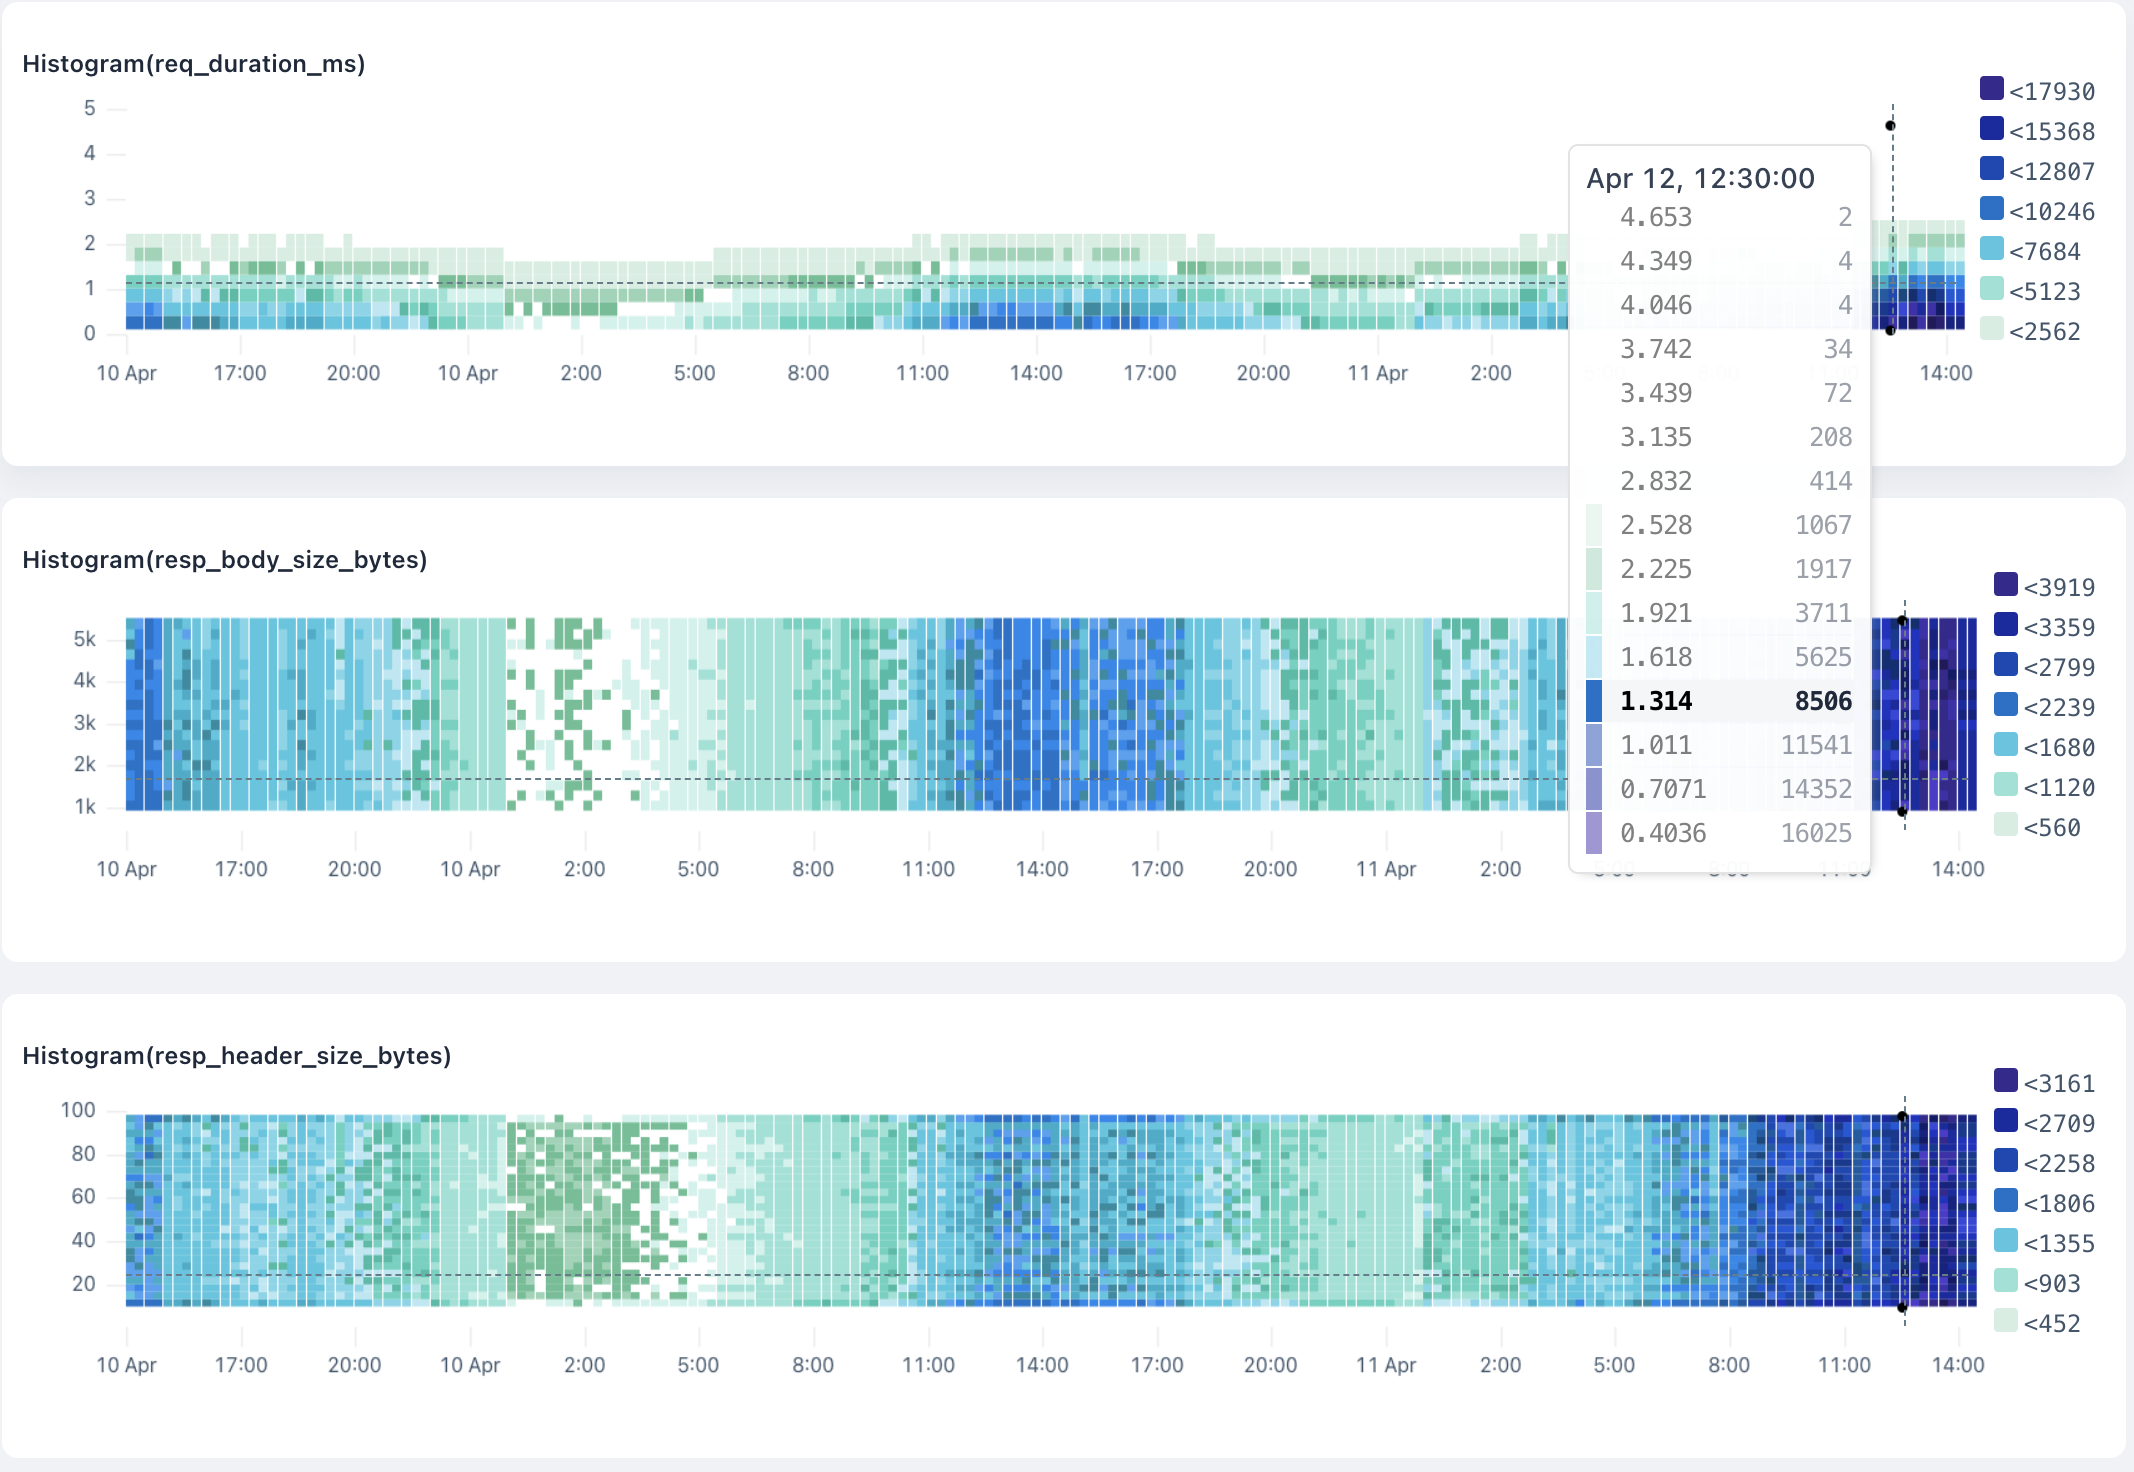 ## `topk` [#topk]
The `topk` visualization calculates the top values for a field in a dataset.
#### Arguments [#arguments-8]
* `field: number` is the number field where Axiom calculates the top values.
* `nResults` is the number of top values to return. For example, `topk(method, 10)`.
#### Group-by behaviour [#group-by-behaviour-8]
The visualization produces a separate result for each group plotted on a time series chart.
## `topk` [#topk]
The `topk` visualization calculates the top values for a field in a dataset.
#### Arguments [#arguments-8]
* `field: number` is the number field where Axiom calculates the top values.
* `nResults` is the number of top values to return. For example, `topk(method, 10)`.
#### Group-by behaviour [#group-by-behaviour-8]
The visualization produces a separate result for each group plotted on a time series chart.
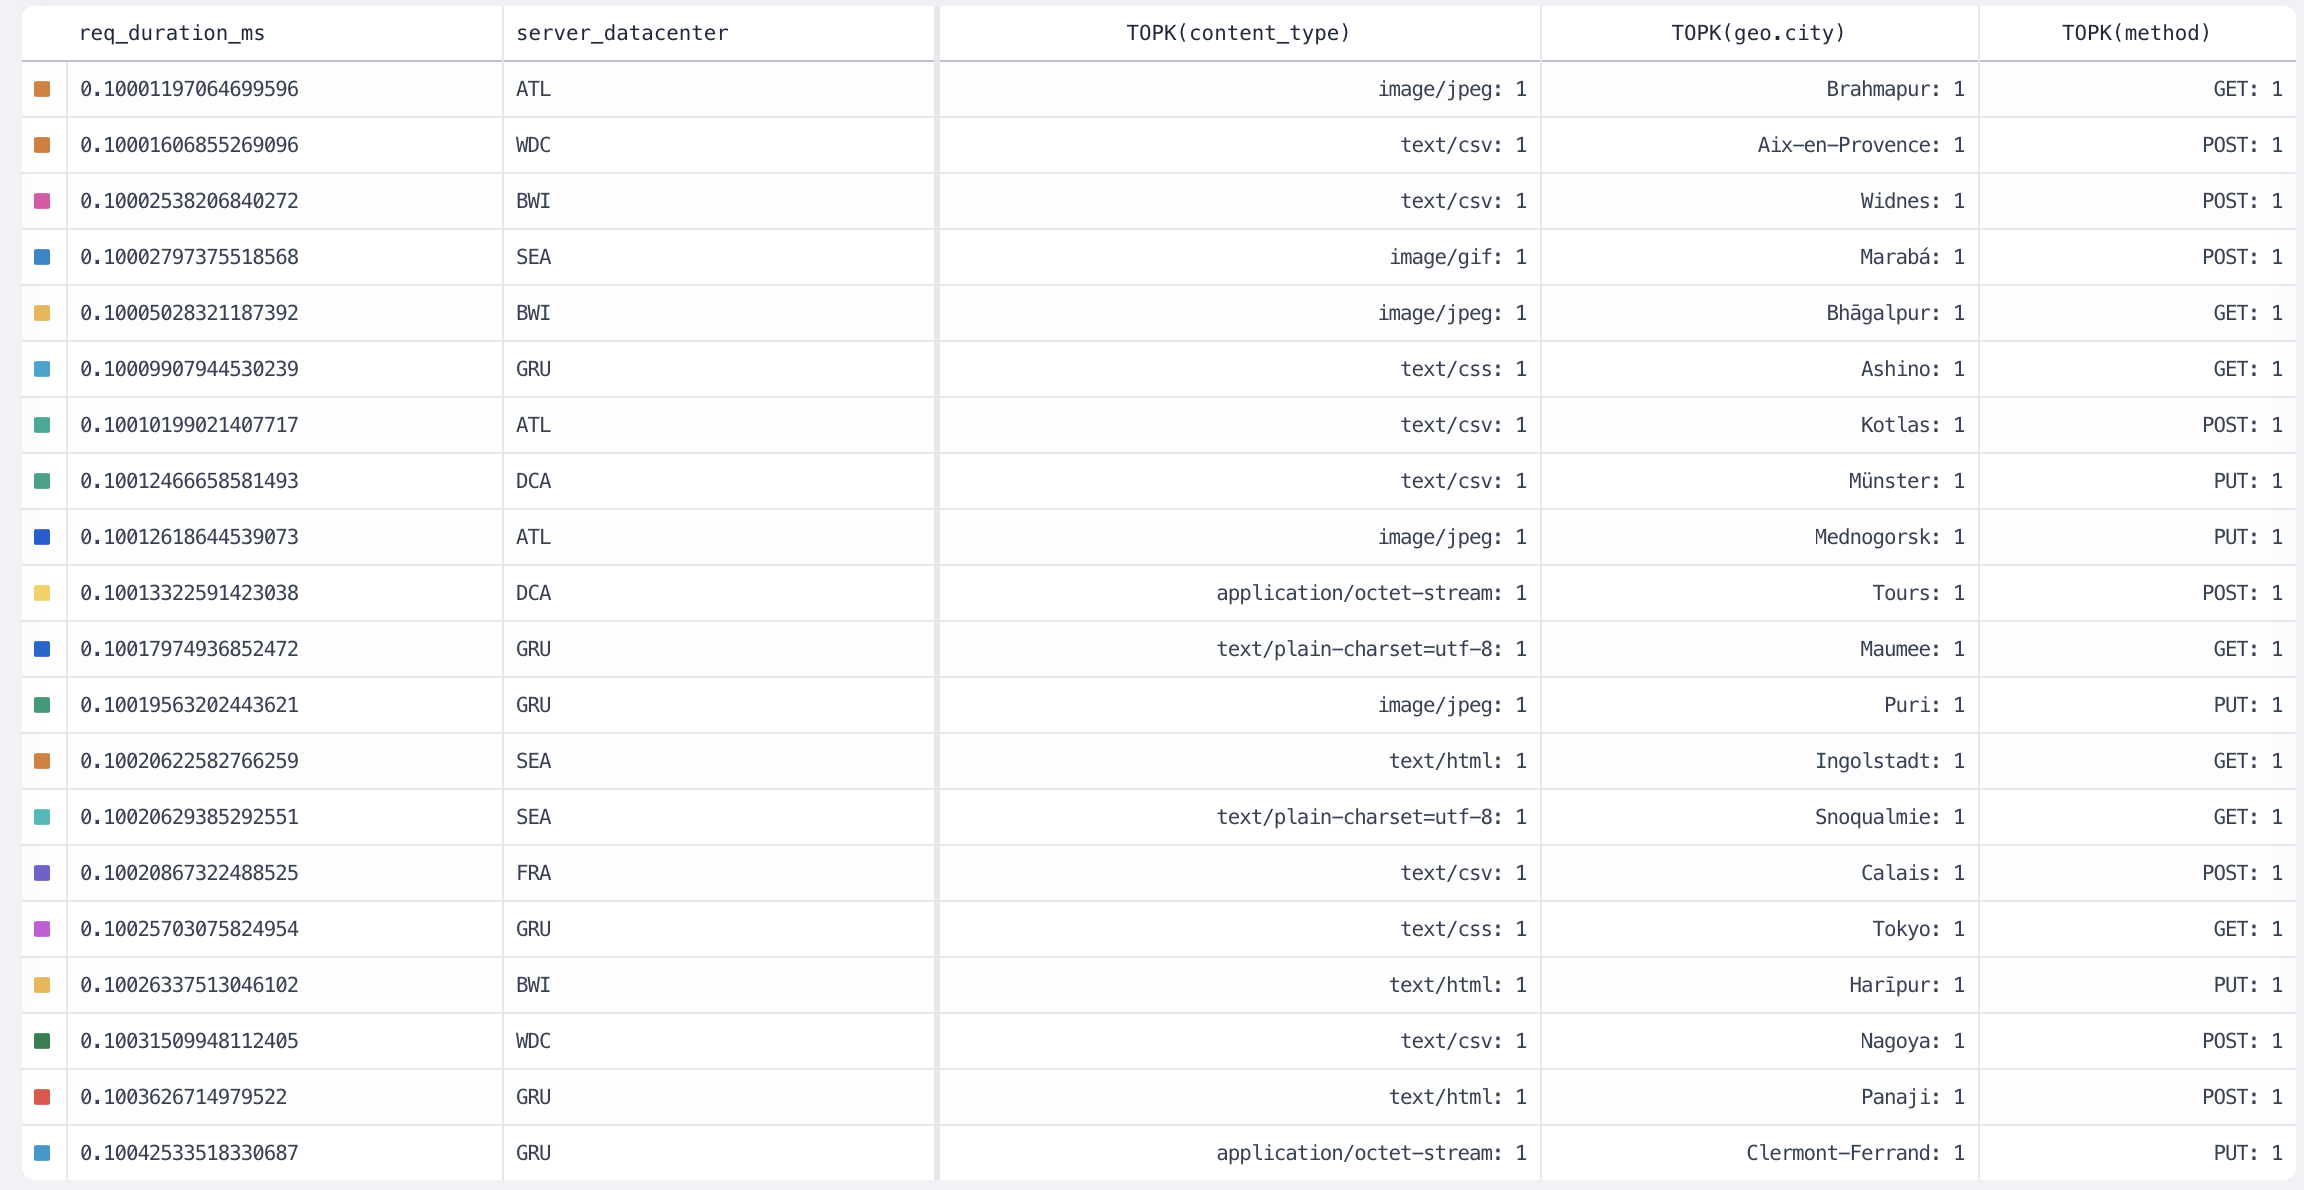 ## `variance` [#variance]
The `variance` visualization calculates the variance of the field in the dataset and produces a time series chart.
The `variance` aggregation returns the sample variance of the fields of the dataset.
#### Arguments [#arguments-9]
`field: number` is the number field where Axiom calculates the variance.
#### Group-by behaviour [#group-by-behaviour-9]
The visualization produces a separate result for each group plotted on a time series chart.
## `variance` [#variance]
The `variance` visualization calculates the variance of the field in the dataset and produces a time series chart.
The `variance` aggregation returns the sample variance of the fields of the dataset.
#### Arguments [#arguments-9]
`field: number` is the number field where Axiom calculates the variance.
#### Group-by behaviour [#group-by-behaviour-9]
The visualization produces a separate result for each group plotted on a time series chart.
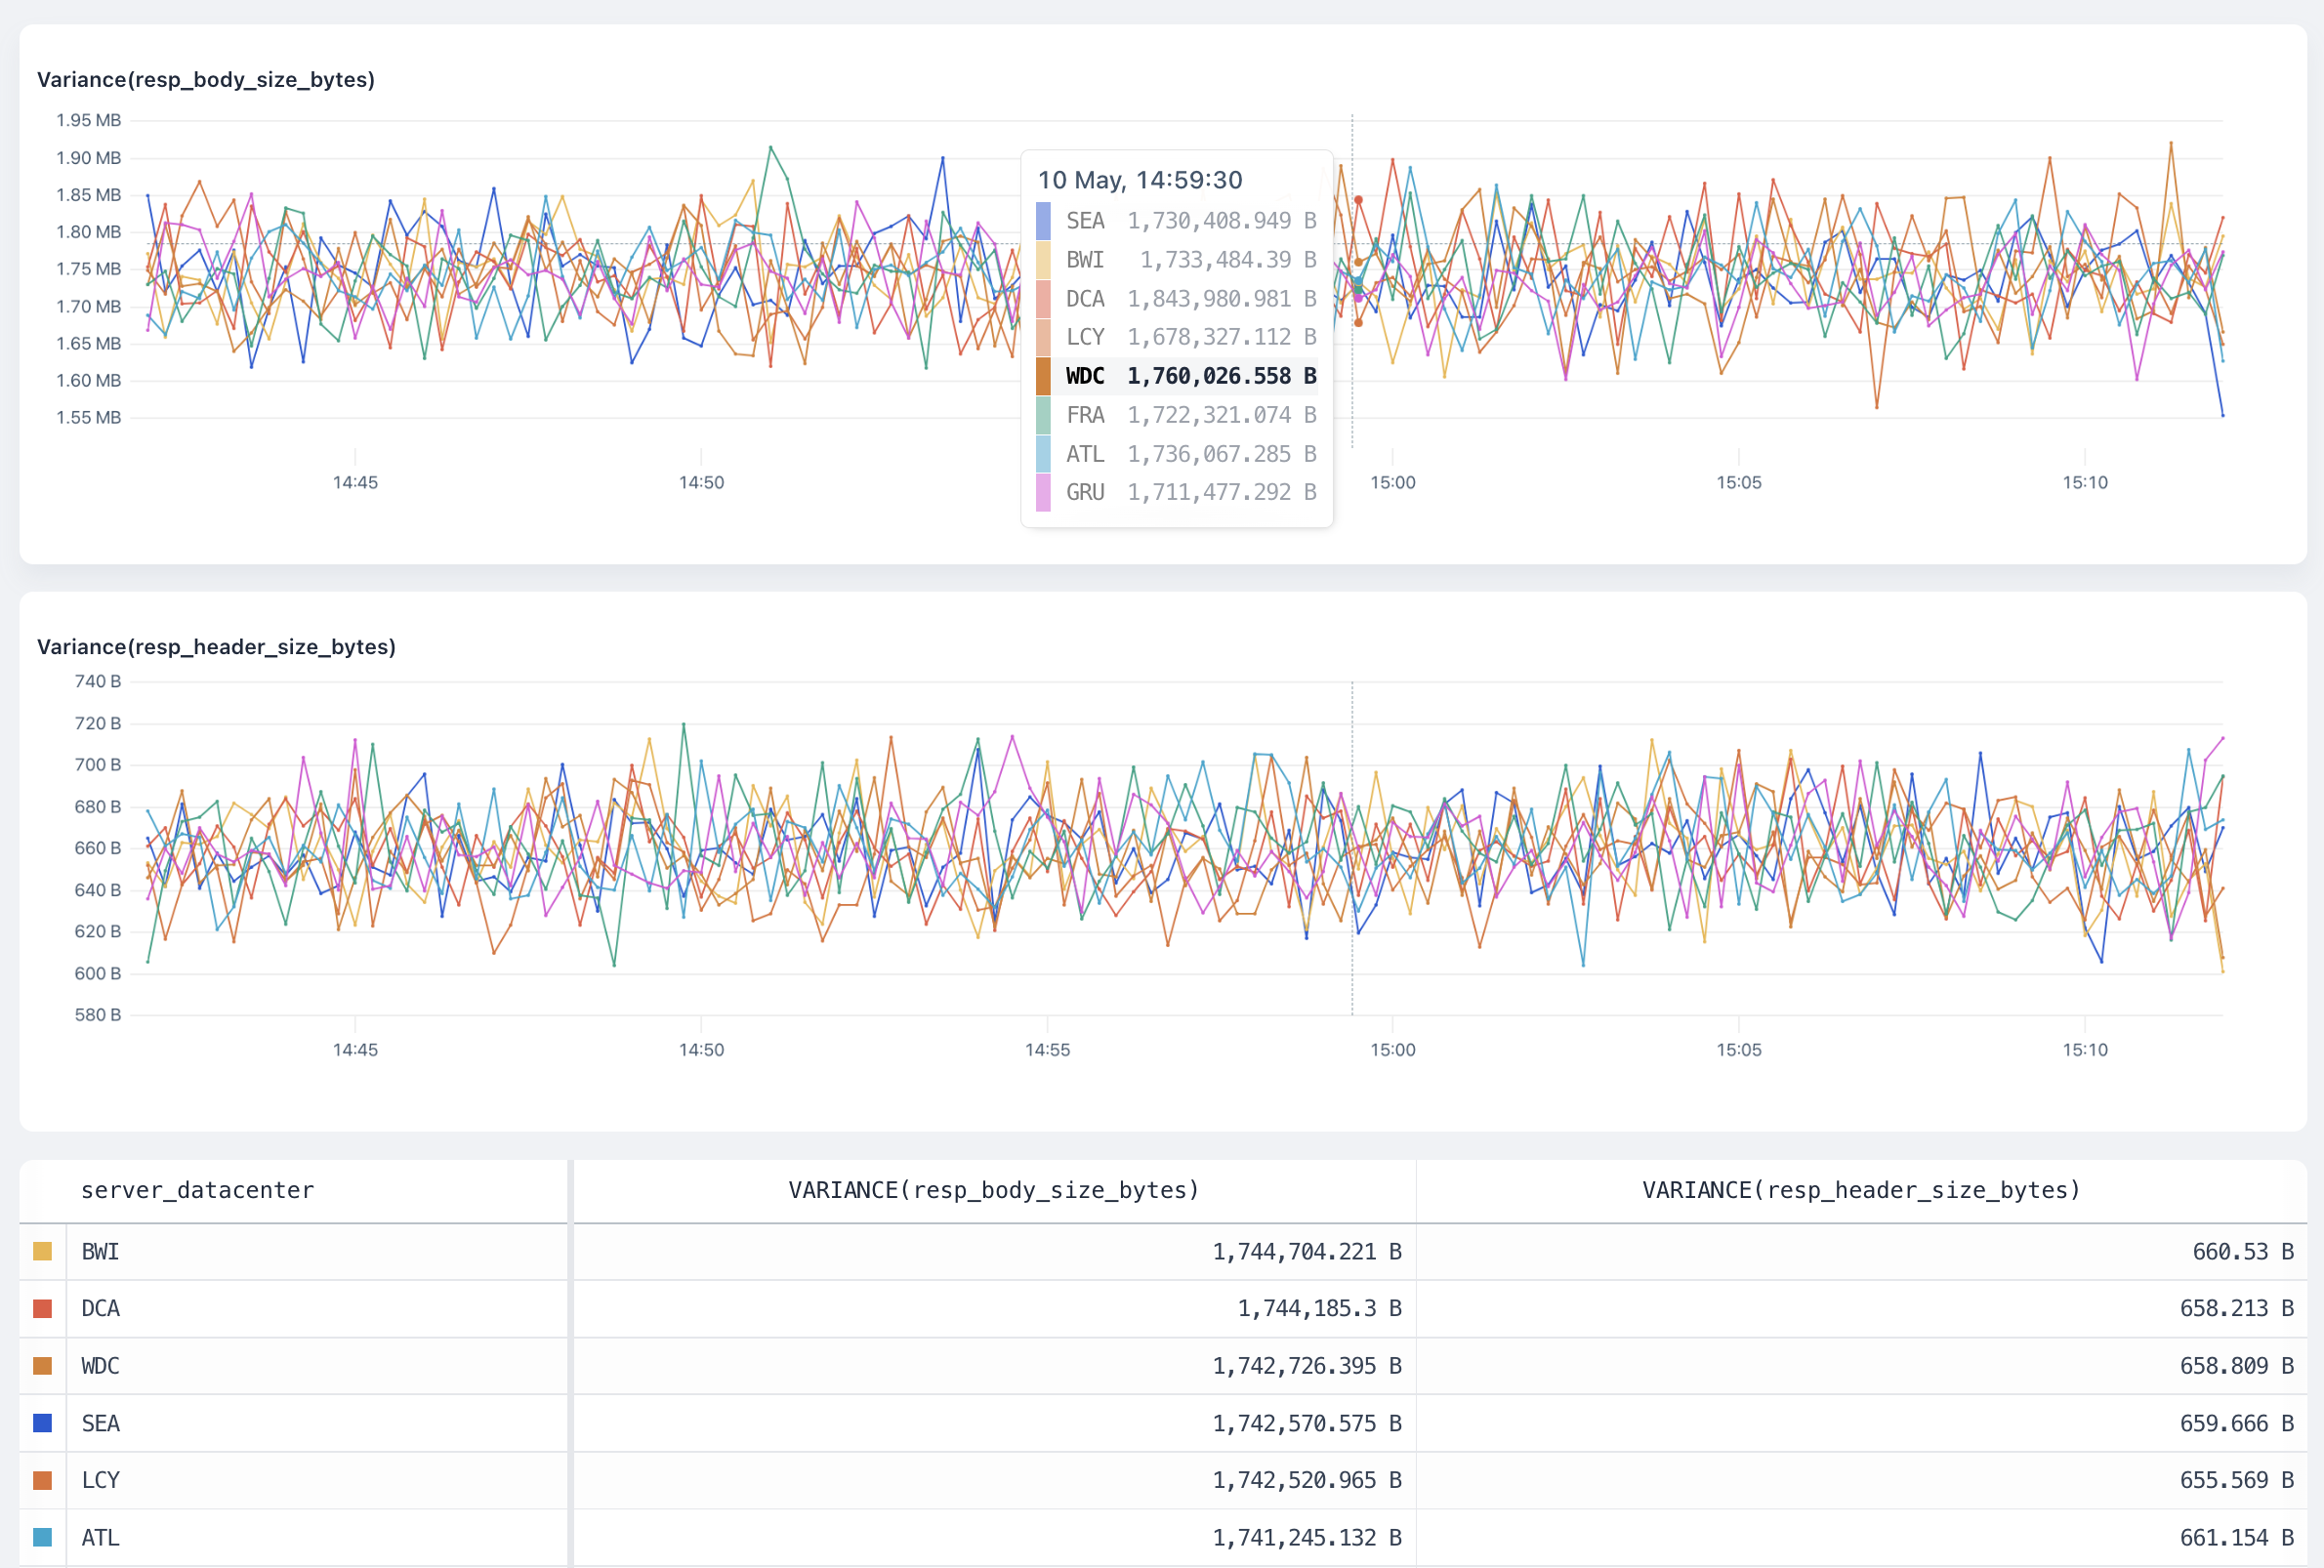 ## `stddev` [#stddev]
The `stddev` visualization calculates the standard deviation of the field in the dataset and produces a time series chart.
The `stddev` aggregation returns the sample standard deviation of the fields of the dataset.
#### Arguments [#arguments-10]
`field: number` is the number field where Axiom calculates the standard deviation.
#### Group-by behaviour [#group-by-behaviour-10]
The visualization produces a separate result for each group plotted on a time series chart.
## `stddev` [#stddev]
The `stddev` visualization calculates the standard deviation of the field in the dataset and produces a time series chart.
The `stddev` aggregation returns the sample standard deviation of the fields of the dataset.
#### Arguments [#arguments-10]
`field: number` is the number field where Axiom calculates the standard deviation.
#### Group-by behaviour [#group-by-behaviour-10]
The visualization produces a separate result for each group plotted on a time series chart.
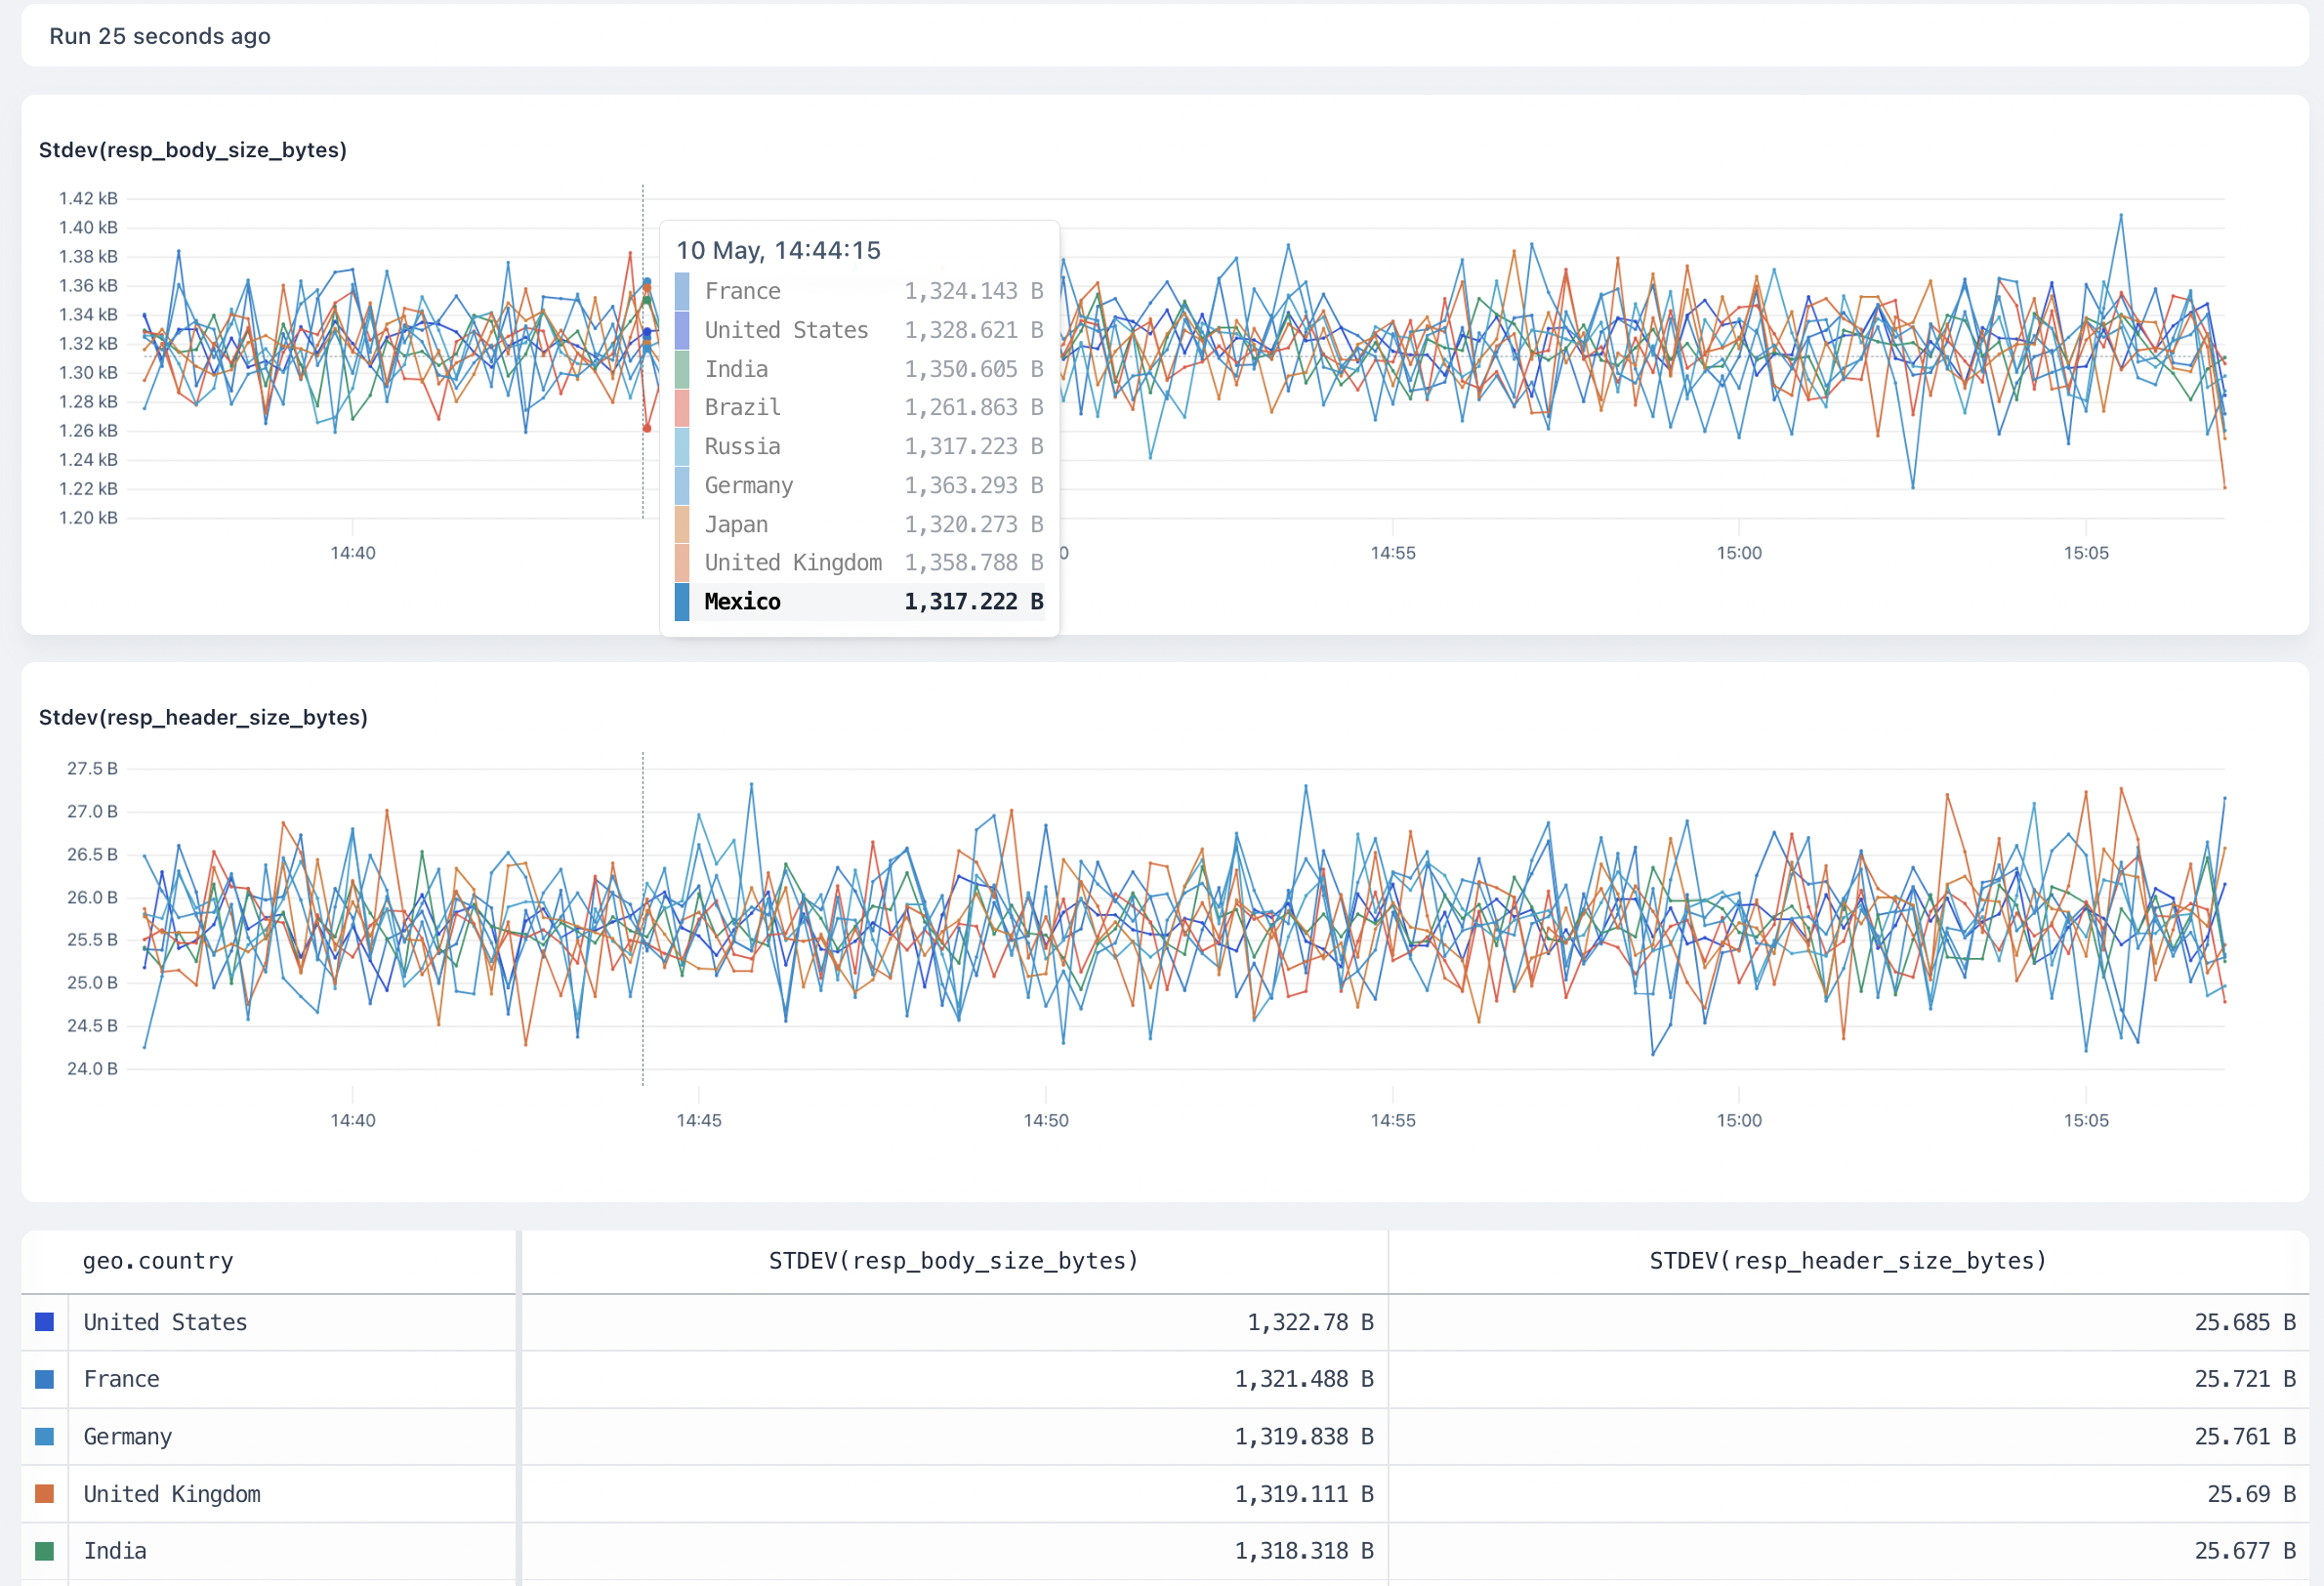 ---
# Track activity in Axiom
Source: https://axiom.co/docs/reference/audit-log
The audit log allows you to track who did what and when within your Axiom organization.
Tracking activity in your Axiom organization with the audit log is useful for legal compliance reasons. For example, you can investigate the following:
* Track who has accessed the Axiom platform.
* Track organization access over time.
* Track data access over time.
The audit log also make it easier to manage your Axiom organization. They allow you to do the following, among others:
* Track changes made by your team to your observability posture.
* Track monitoring performance and identify which monitors generate the most query load.
* Monitor query costs and optimize expensive queries before they impact your budget.
* Trace queries back to their source (monitors or direct queries) for debugging.
The audit log is available to all organizations. By default, you can query the audit log for the previous three days. You can purchase full access to the audit log as an add-on on the Axiom Cloud plan. For more information, see [Manage add-ons](/reference/usage-billing#manage-add-ons).
## Explore audit log [#explore-audit-log]
1. Go to the Query tab, and then click **APL**.
2. Query the `axiom-audit` dataset. For example, run the query `['axiom-audit']` to display the raw audit log data in a table.
3. Optional: Customize your query to filter or summarize the audit log. For more information, see [Query data](/query-data/explore).
4. Click **Run**.
The `action` field specifies the type of activity that happened in your Axiom organization.
## Export audit log [#export-audit-log]
1. Run the query to [display the audit log](#explore-audit-log).
2. Click
---
# Track activity in Axiom
Source: https://axiom.co/docs/reference/audit-log
The audit log allows you to track who did what and when within your Axiom organization.
Tracking activity in your Axiom organization with the audit log is useful for legal compliance reasons. For example, you can investigate the following:
* Track who has accessed the Axiom platform.
* Track organization access over time.
* Track data access over time.
The audit log also make it easier to manage your Axiom organization. They allow you to do the following, among others:
* Track changes made by your team to your observability posture.
* Track monitoring performance and identify which monitors generate the most query load.
* Monitor query costs and optimize expensive queries before they impact your budget.
* Trace queries back to their source (monitors or direct queries) for debugging.
The audit log is available to all organizations. By default, you can query the audit log for the previous three days. You can purchase full access to the audit log as an add-on on the Axiom Cloud plan. For more information, see [Manage add-ons](/reference/usage-billing#manage-add-ons).
## Explore audit log [#explore-audit-log]
1. Go to the Query tab, and then click **APL**.
2. Query the `axiom-audit` dataset. For example, run the query `['axiom-audit']` to display the raw audit log data in a table.
3. Optional: Customize your query to filter or summarize the audit log. For more information, see [Query data](/query-data/explore).
4. Click **Run**.
The `action` field specifies the type of activity that happened in your Axiom organization.
## Export audit log [#export-audit-log]
1. Run the query to [display the audit log](#explore-audit-log).
2. Click  ## Tokens [#tokens]
You can generate an ingest and personal token manually in your Axiom user settings.
See [Tokens](/reference/tokens) to know more about managing access and authorization.
## Configuration and Deployment [#configuration-and-deployment]
Axiom CLI lets you ingest, authenticate, and stream data.
For more information about Configuration, managing authentication status, ingesting, streaming, and more,
visit the [Axiom CLI](https://github.com/axiomhq/cli) repository on GitHub.
Axiom CLI supports the ingestion of different formats of data **( JSON, NDJSON, and CSV)**
## Querying [#querying]
Get deeper insights into your data using [Axiom Processing Language](/apl/introduction)
## Ingestion [#ingestion]
Import, transfer, load, and process data for later use or storage using the Axiom CLI. With [Axiom CLI](https://github.com/axiomhq/cli) you can Ingest the contents of a **JSON, NDJSON, CSV** logfile into a dataset.
**To view a list of all the available commands run `axiom` on your terminal:**
```bash
➜ ~ axiom
The power of Axiom on the command-line.
USAGE
axiom
## Tokens [#tokens]
You can generate an ingest and personal token manually in your Axiom user settings.
See [Tokens](/reference/tokens) to know more about managing access and authorization.
## Configuration and Deployment [#configuration-and-deployment]
Axiom CLI lets you ingest, authenticate, and stream data.
For more information about Configuration, managing authentication status, ingesting, streaming, and more,
visit the [Axiom CLI](https://github.com/axiomhq/cli) repository on GitHub.
Axiom CLI supports the ingestion of different formats of data **( JSON, NDJSON, and CSV)**
## Querying [#querying]
Get deeper insights into your data using [Axiom Processing Language](/apl/introduction)
## Ingestion [#ingestion]
Import, transfer, load, and process data for later use or storage using the Axiom CLI. With [Axiom CLI](https://github.com/axiomhq/cli) you can Ingest the contents of a **JSON, NDJSON, CSV** logfile into a dataset.
**To view a list of all the available commands run `axiom` on your terminal:**
```bash
➜ ~ axiom
The power of Axiom on the command-line.
USAGE
axiom 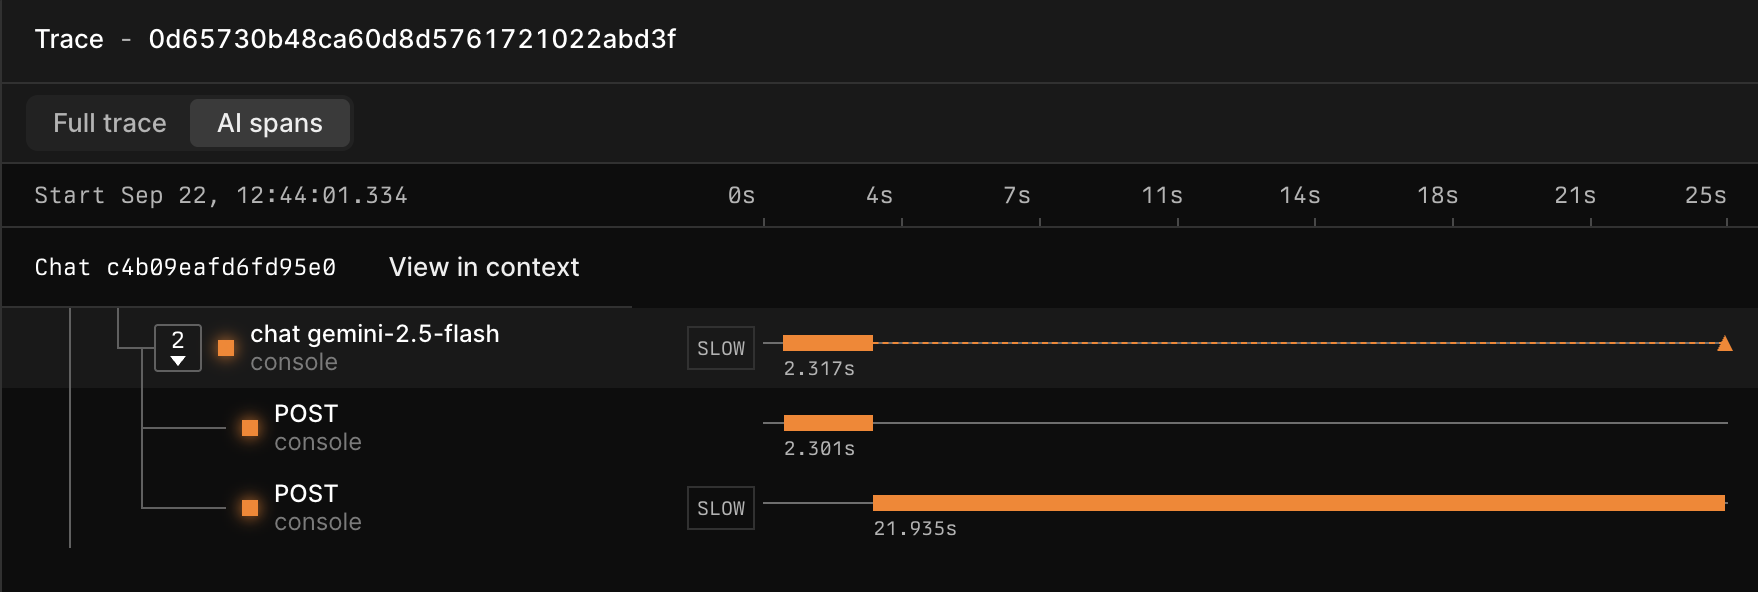 ### Access GenAI dashboard [#access-genai-dashboard]
Axiom automatically creates the GenAI dashboard if the field `attributes.gen_ai.operation.name` is present in your data.
To access the GenAI dashboard:
1. Click the Dashboards tab.
2. Click the dashboard **Generative AI Overview (DATASET\_NAME)** where `DATASET_NAME` is the name of your GenAI dataset.
[Run in Playground](https://play.axiom.co/axiom-play-qf1k/dashboards/genai.otel-demo-genai)
The GenAI dashboard provides you with important insights about your GenAI app such as:
* Vitals about requests, broken down by operation, capability, and step.
* Token usage and cost analysis
* Error analysis
* Comparison of performance and reliability of different AI models
### Access GenAI dashboard [#access-genai-dashboard]
Axiom automatically creates the GenAI dashboard if the field `attributes.gen_ai.operation.name` is present in your data.
To access the GenAI dashboard:
1. Click the Dashboards tab.
2. Click the dashboard **Generative AI Overview (DATASET\_NAME)** where `DATASET_NAME` is the name of your GenAI dataset.
[Run in Playground](https://play.axiom.co/axiom-play-qf1k/dashboards/genai.otel-demo-genai)
The GenAI dashboard provides you with important insights about your GenAI app such as:
* Vitals about requests, broken down by operation, capability, and step.
* Token usage and cost analysis
* Error analysis
* Comparison of performance and reliability of different AI models
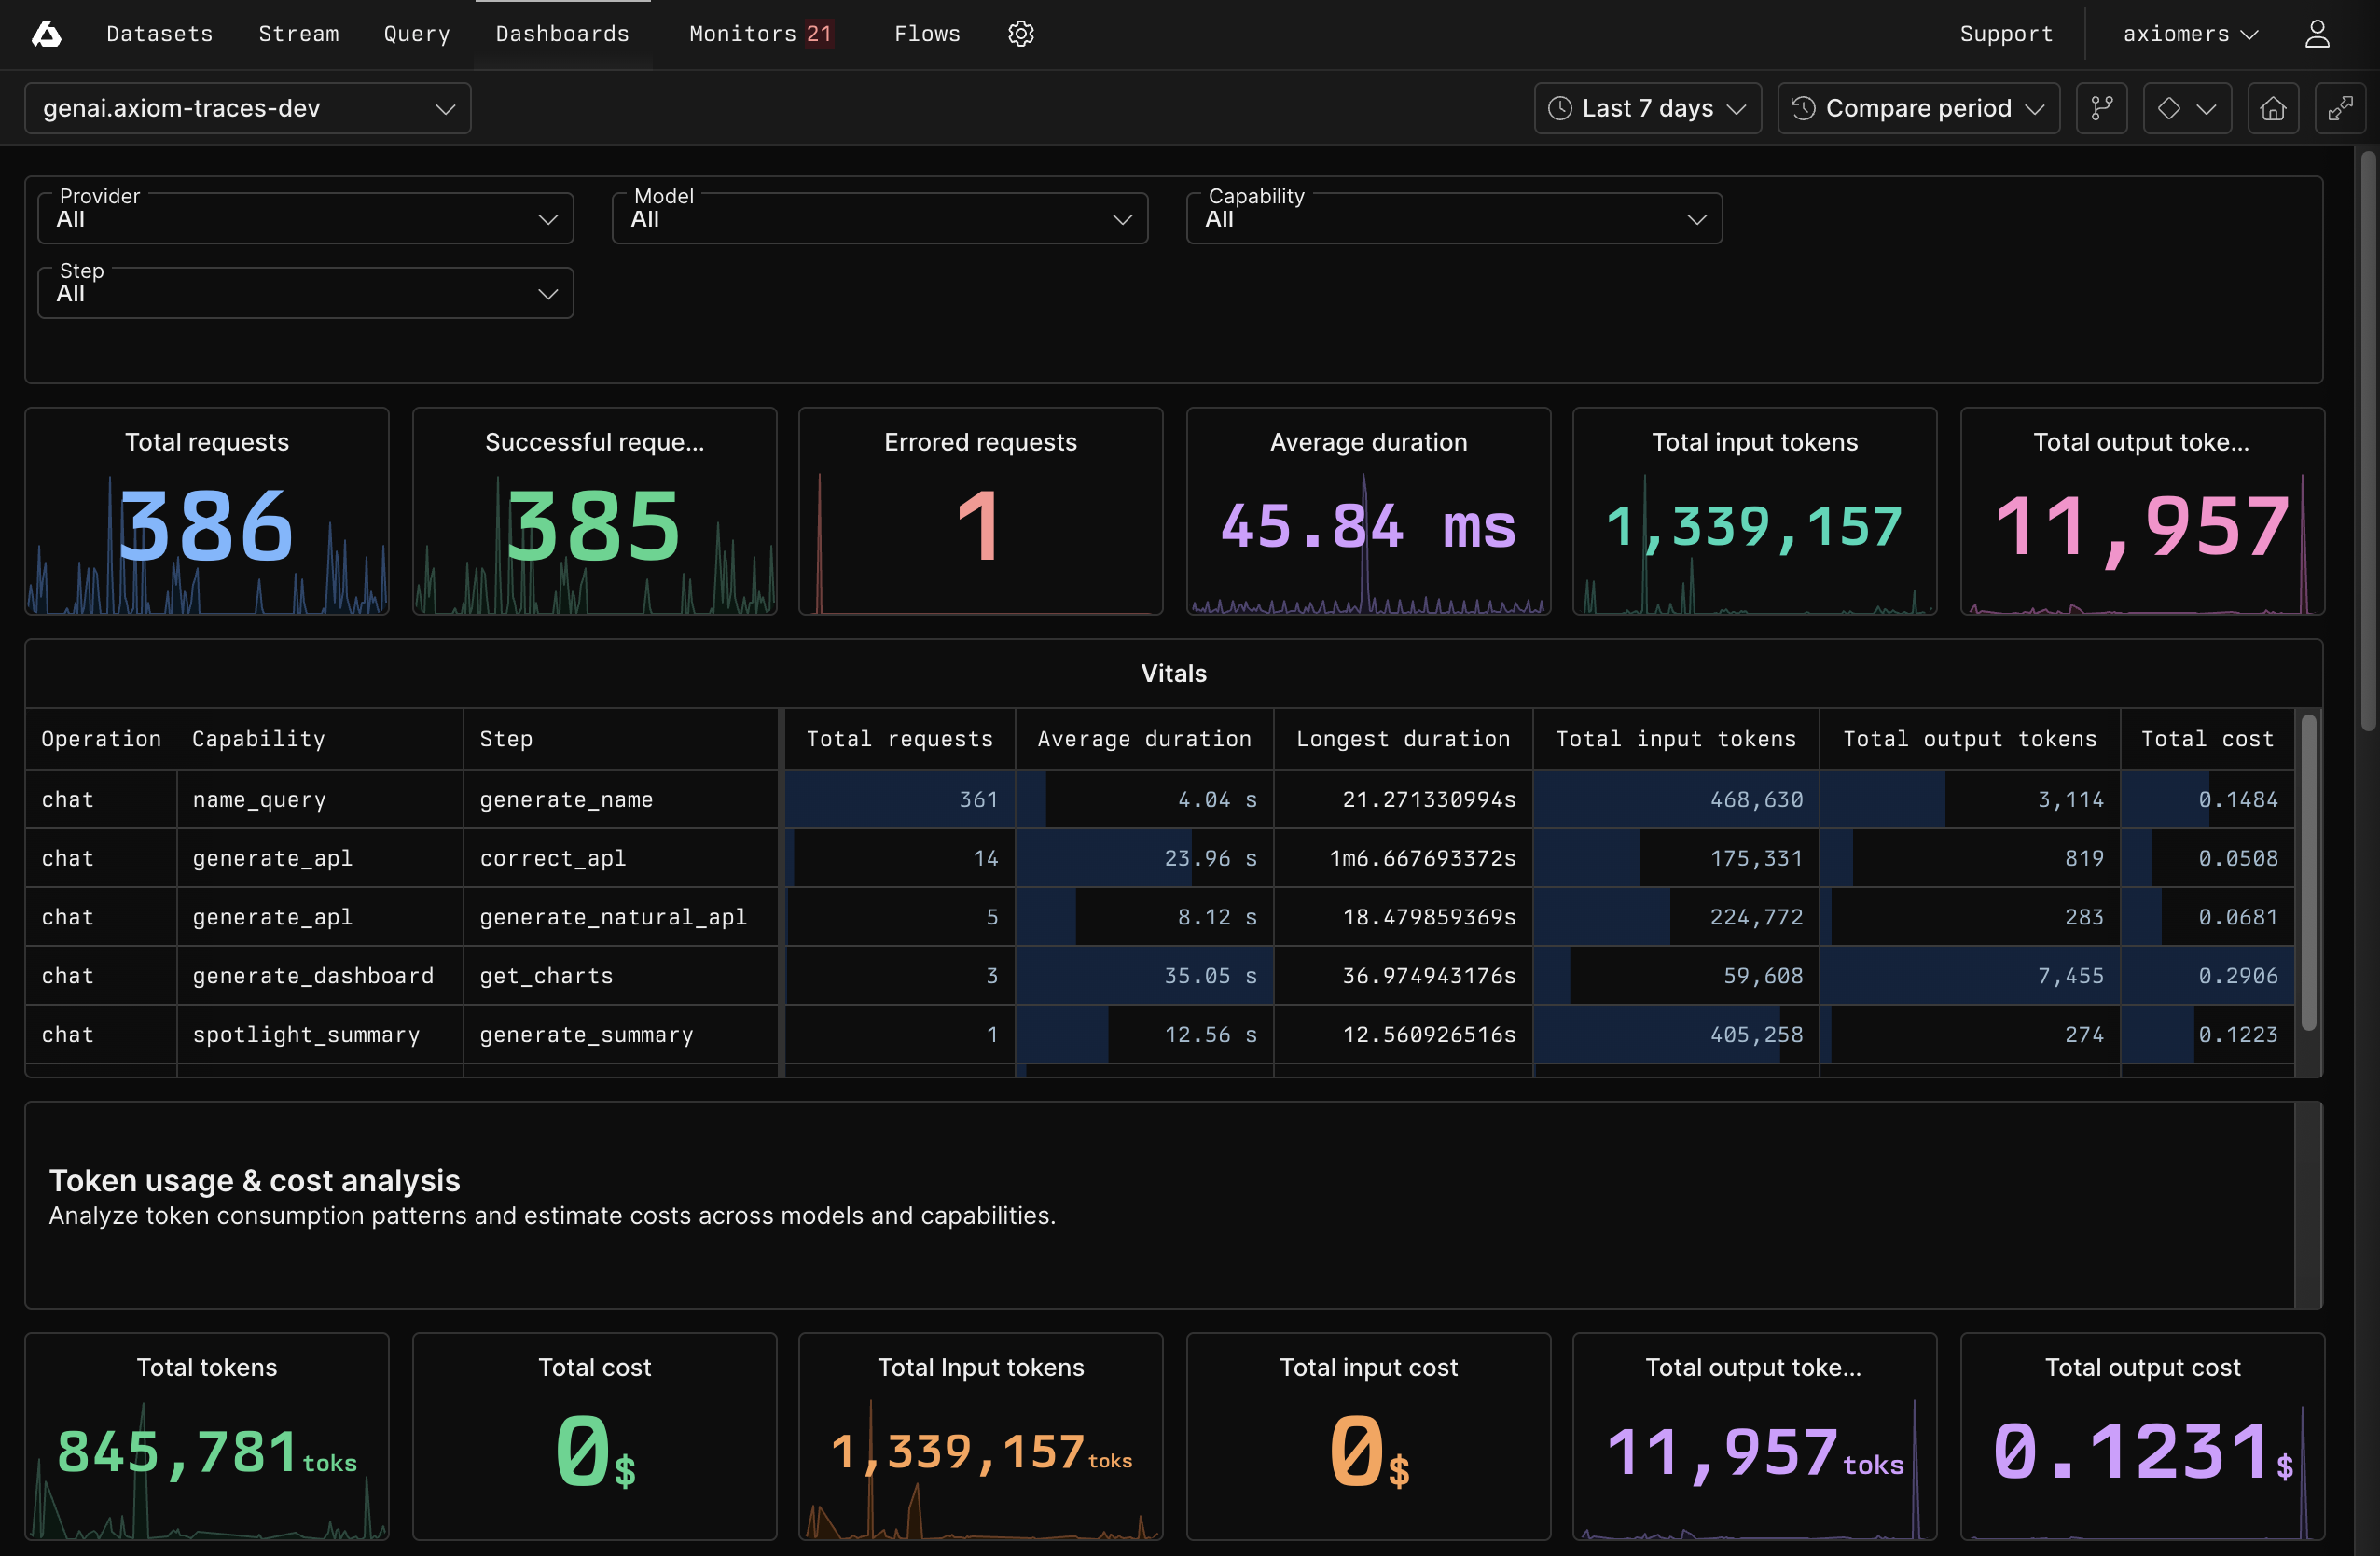 ## What’s next? [#whats-next]
* Use [GenAI APL functions](/apl/scalar-functions/genai-functions) to query and analyze your LLM data.
* See [GenAI attributes](/use-cases/llm-observability/gen-ai-attributes) for the full list of OpenTelemetry attributes Axiom recognizes.
---
# Send data from Amazon Data Firehose to Axiom
Source: https://axiom.co/docs/send-data/aws-firehose
Amazon Data Firehose is a service for delivering real-time streaming data to different destinations. Send event data from Amazon Data Firehose to Axiom to analyse and monitor your data efficiently.
## What’s next? [#whats-next]
* Use [GenAI APL functions](/apl/scalar-functions/genai-functions) to query and analyze your LLM data.
* See [GenAI attributes](/use-cases/llm-observability/gen-ai-attributes) for the full list of OpenTelemetry attributes Axiom recognizes.
---
# Send data from Amazon Data Firehose to Axiom
Source: https://axiom.co/docs/send-data/aws-firehose
Amazon Data Firehose is a service for delivering real-time streaming data to different destinations. Send event data from Amazon Data Firehose to Axiom to analyse and monitor your data efficiently.
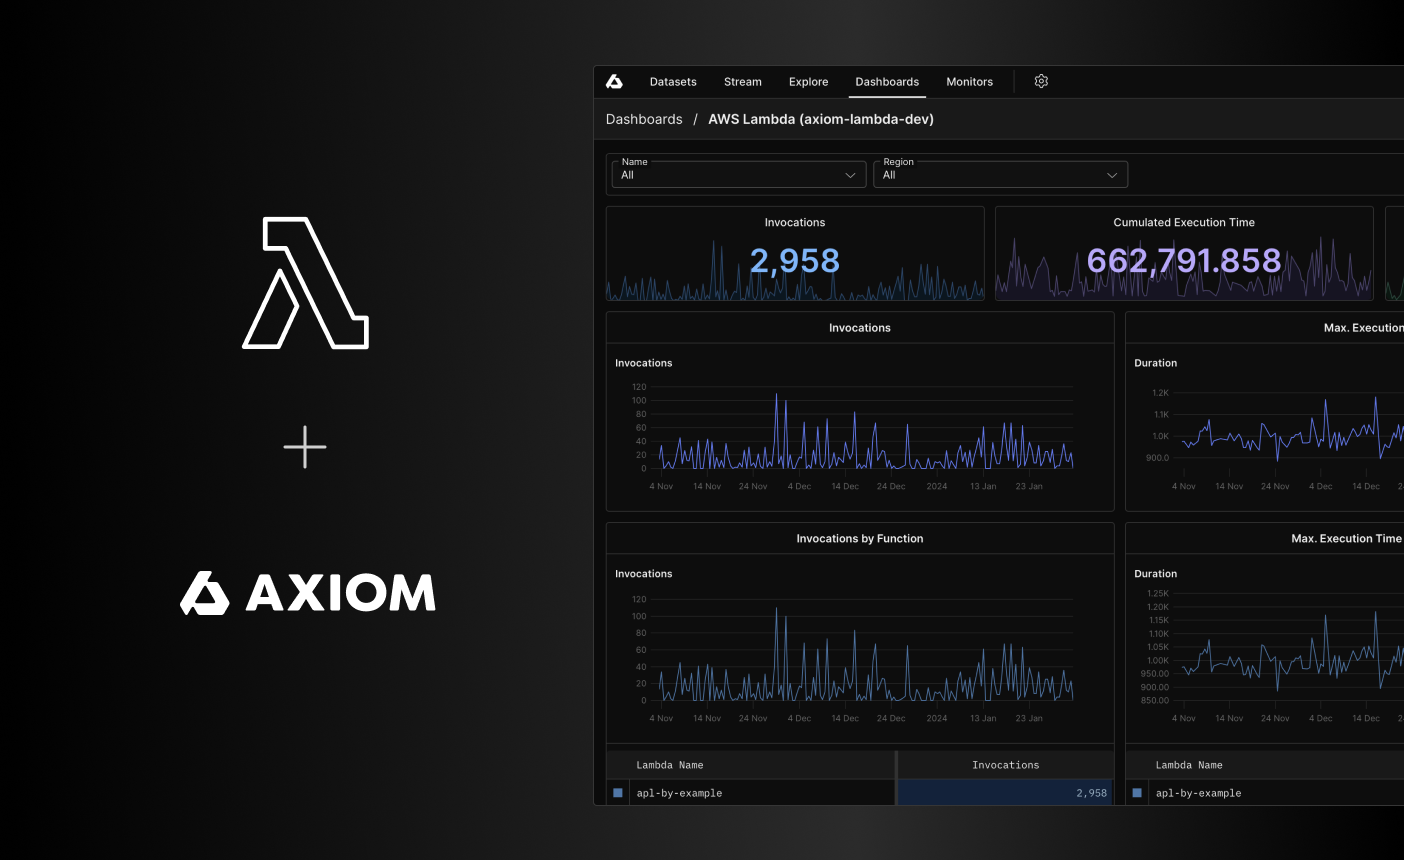 Use the Axiom Lambda Extension to send logs and platform events of your Lambda function to Axiom.
Alternatively, you can use the AWS Distro for OpenTelemetry to send Lambda function logs and platform events to Axiom. For more information, see [AWS Lambda Using OTel](/send-data/aws-lambda-dot).
Axiom detects the extension and provides you with quick filters and a dashboard. For more information on how this enriches your Axiom organization, see [AWS Lambda app](/apps/lambda).
Use the Axiom Lambda Extension to send logs and platform events of your Lambda function to Axiom.
Alternatively, you can use the AWS Distro for OpenTelemetry to send Lambda function logs and platform events to Axiom. For more information, see [AWS Lambda Using OTel](/send-data/aws-lambda-dot).
Axiom detects the extension and provides you with quick filters and a dashboard. For more information on how this enriches your Axiom organization, see [AWS Lambda app](/apps/lambda).
[AWS S3 Forwarder](/send-data/aws-s3)
[Amazon Data Firehose](/send-data/aws-firehose) | | Amazon CloudFront | [AWS S3 Forwarder](/send-data/aws-s3) | | Amazon Data Firehose | [Amazon Data Firehose](/send-data/aws-firehose) | | Amazon Elastic Container Service | [Fluentbit](/send-data/fluent-bit) | | Amazon Elastic Load Balancing (ELB) | [Fluentbit](/send-data/fluent-bit) | | Amazon ElastiCache (Redis OSS) | [Axiom CloudWatch Forwarder](/send-data/cloudwatch)
[Amazon Data Firehose](/send-data/aws-firehose) | | Amazon EventBridge Pipes | [Axiom CloudWatch Forwarder](/send-data/cloudwatch)
[AWS S3 Forwarder](/send-data/aws-s3)
[Amazon Data Firehose](/send-data/aws-firehose) | | Amazon FinSpace | [Axiom CloudWatch Forwarder](/send-data/cloudwatch)
[AWS S3 Forwarder](/send-data/aws-s3)
[Amazon Data Firehose](/send-data/aws-firehose) | | Amazon S3 | [AWS S3 Forwarder](/send-data/aws-s3)
[Vector](/send-data/vector) | | Amazon Virtual Private Cloud (VPC) | [AWS S3 Forwarder](/send-data/aws-s3) | | AWS Fault Injection Service | [AWS S3 Forwarder](/send-data/aws-s3) | | AWS FireLens | [AWS FireLens](/send-data/aws-firelens) | | AWS Global Accelerator | [AWS S3 Forwarder](/send-data/aws-s3) | | AWS IoT Core | [AWS IoT](/send-data/aws-iot-rules) | | AWS Lambda | [AWS Lambda](/send-data/aws-lambda) |
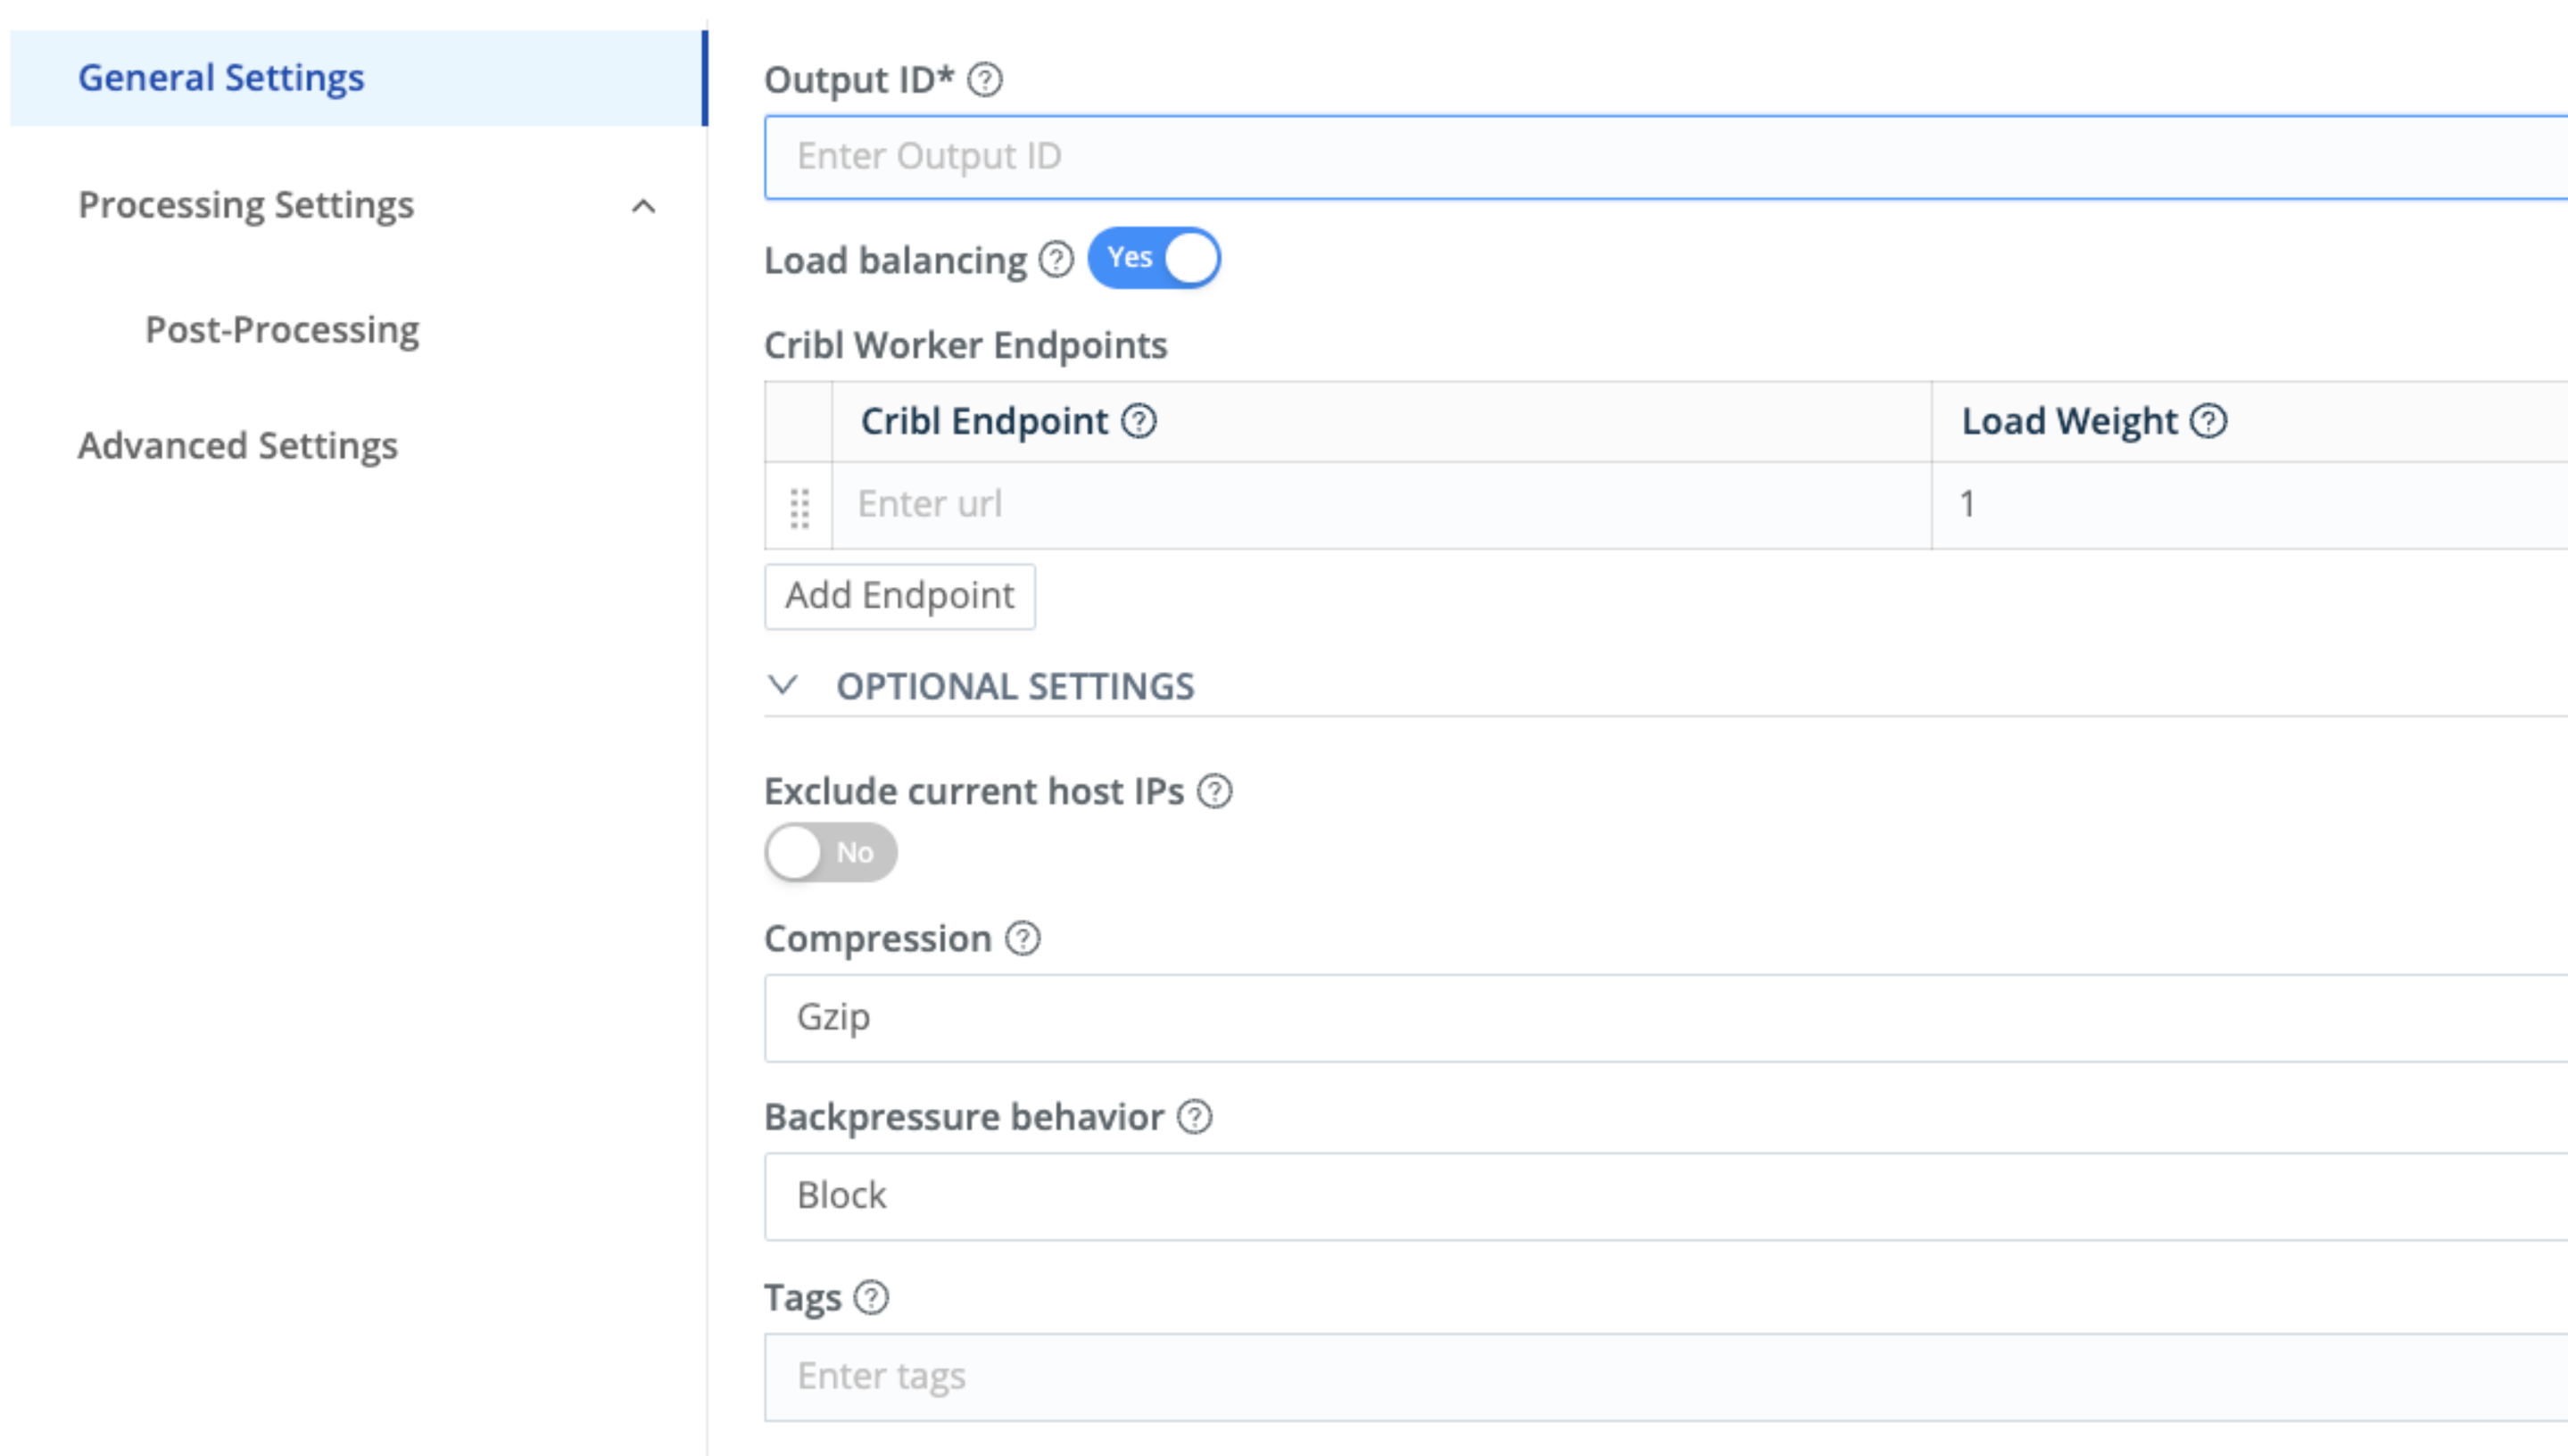 2. Configure the destination:
* **Name:** Choose a name for the destination.
* **Endpoint URL:** The URL of your Axiom log ingest endpoint `https://AXIOM_DOMAIN/v1/ingest/DATASET_NAME`.
2. Configure the destination:
* **Name:** Choose a name for the destination.
* **Endpoint URL:** The URL of your Axiom log ingest endpoint `https://AXIOM_DOMAIN/v1/ingest/DATASET_NAME`.
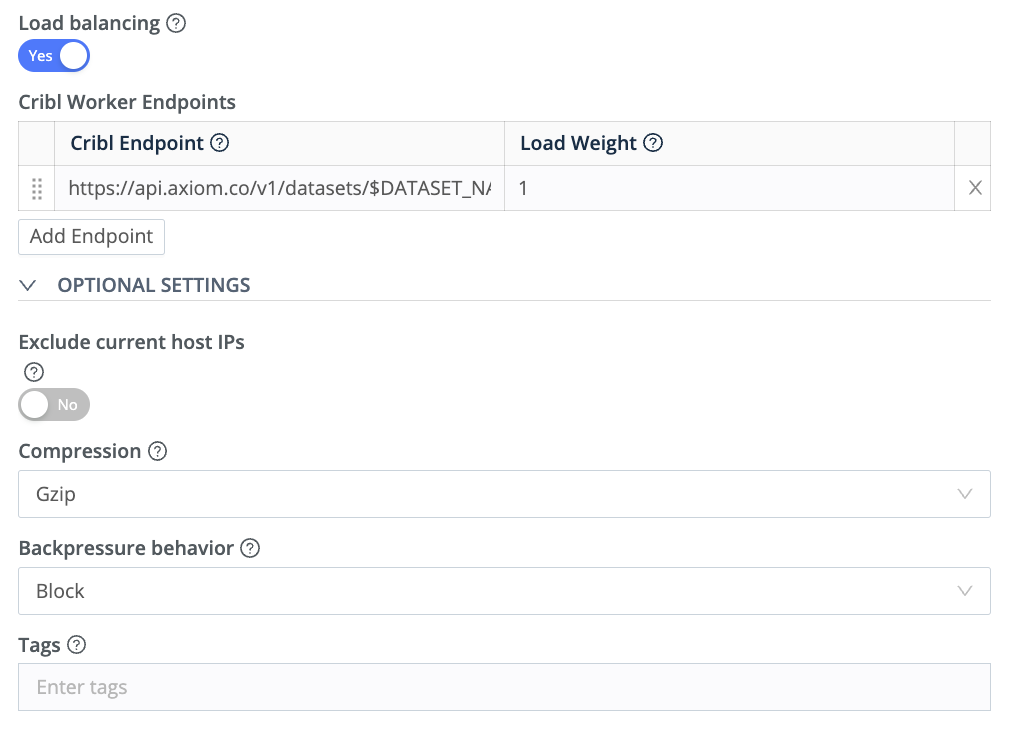 3. Headers:
You may need to add some headers. Here is a common example:
* **Content-Type:** Set this to `application/json`.
* **Authorization:** Set this to `Bearer API_TOKEN`.
3. Headers:
You may need to add some headers. Here is a common example:
* **Content-Type:** Set this to `application/json`.
* **Authorization:** Set this to `Bearer API_TOKEN`.
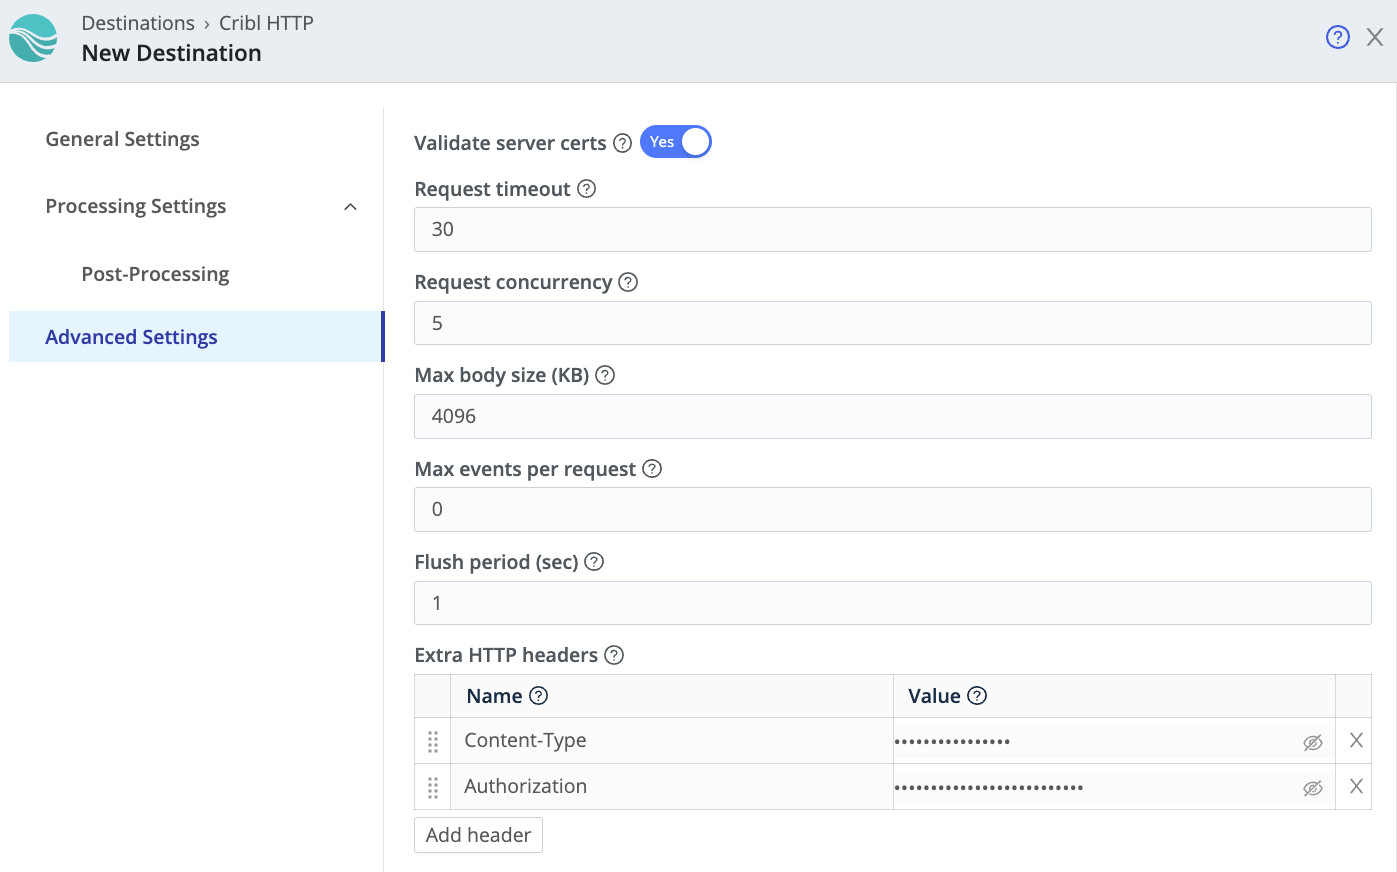 4. Body:
In the Body Template, input `{{_raw}}`. This forwards the raw log event to Axiom.
5. Save and enable the destination:
After you’ve finished configuring the destination, save your changes and make sure the destination is enabled.
## Set up log forwarding from Cribl to Axiom using the Syslog destination [#set-up-log-forwarding-from-cribl-to-axiom-using-the-syslog-destination]
### Create Syslog endpoint [#create-syslog-endpoint]
4. Body:
In the Body Template, input `{{_raw}}`. This forwards the raw log event to Axiom.
5. Save and enable the destination:
After you’ve finished configuring the destination, save your changes and make sure the destination is enabled.
## Set up log forwarding from Cribl to Axiom using the Syslog destination [#set-up-log-forwarding-from-cribl-to-axiom-using-the-syslog-destination]
### Create Syslog endpoint [#create-syslog-endpoint]
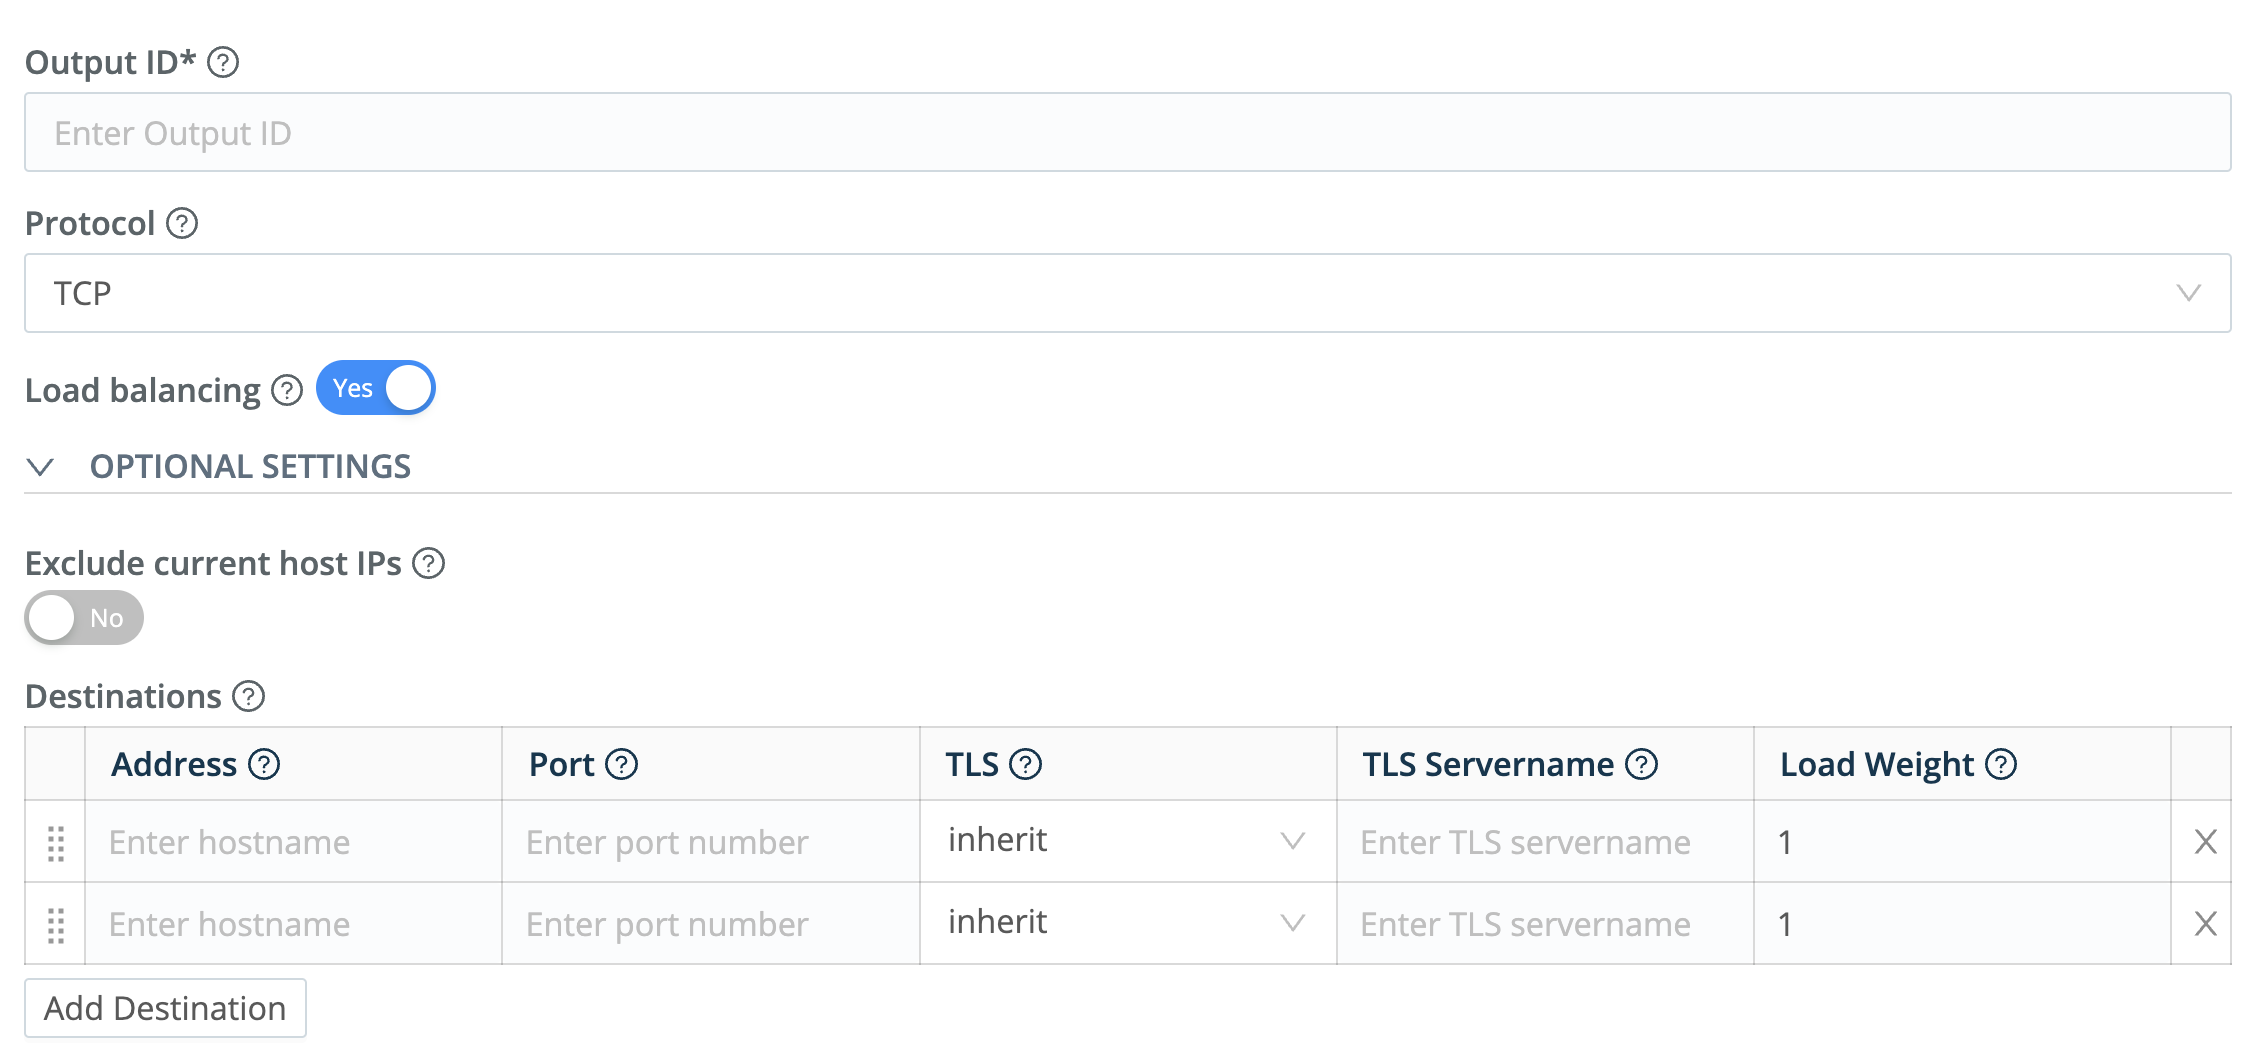 3. Configure the Message:
* **Timestamp Format:** Choose the timestamp format to use in the Syslog messages.
* **Application Name Field:** Enter the name of the field to use as the app name in the Syslog messages.
* **Message Field:** Enter the name of the field to use as the message in the Syslog messages. Typically, this would be `_raw`.
* **Throttling:** Enter the throttling value. Throttling is a mechanism to control the data flow rate from the source (Cribl) to the destination (in this case, an Axiom Syslog Endpoint).
3. Configure the Message:
* **Timestamp Format:** Choose the timestamp format to use in the Syslog messages.
* **Application Name Field:** Enter the name of the field to use as the app name in the Syslog messages.
* **Message Field:** Enter the name of the field to use as the message in the Syslog messages. Typically, this would be `_raw`.
* **Throttling:** Enter the throttling value. Throttling is a mechanism to control the data flow rate from the source (Cribl) to the destination (in this case, an Axiom Syslog Endpoint).
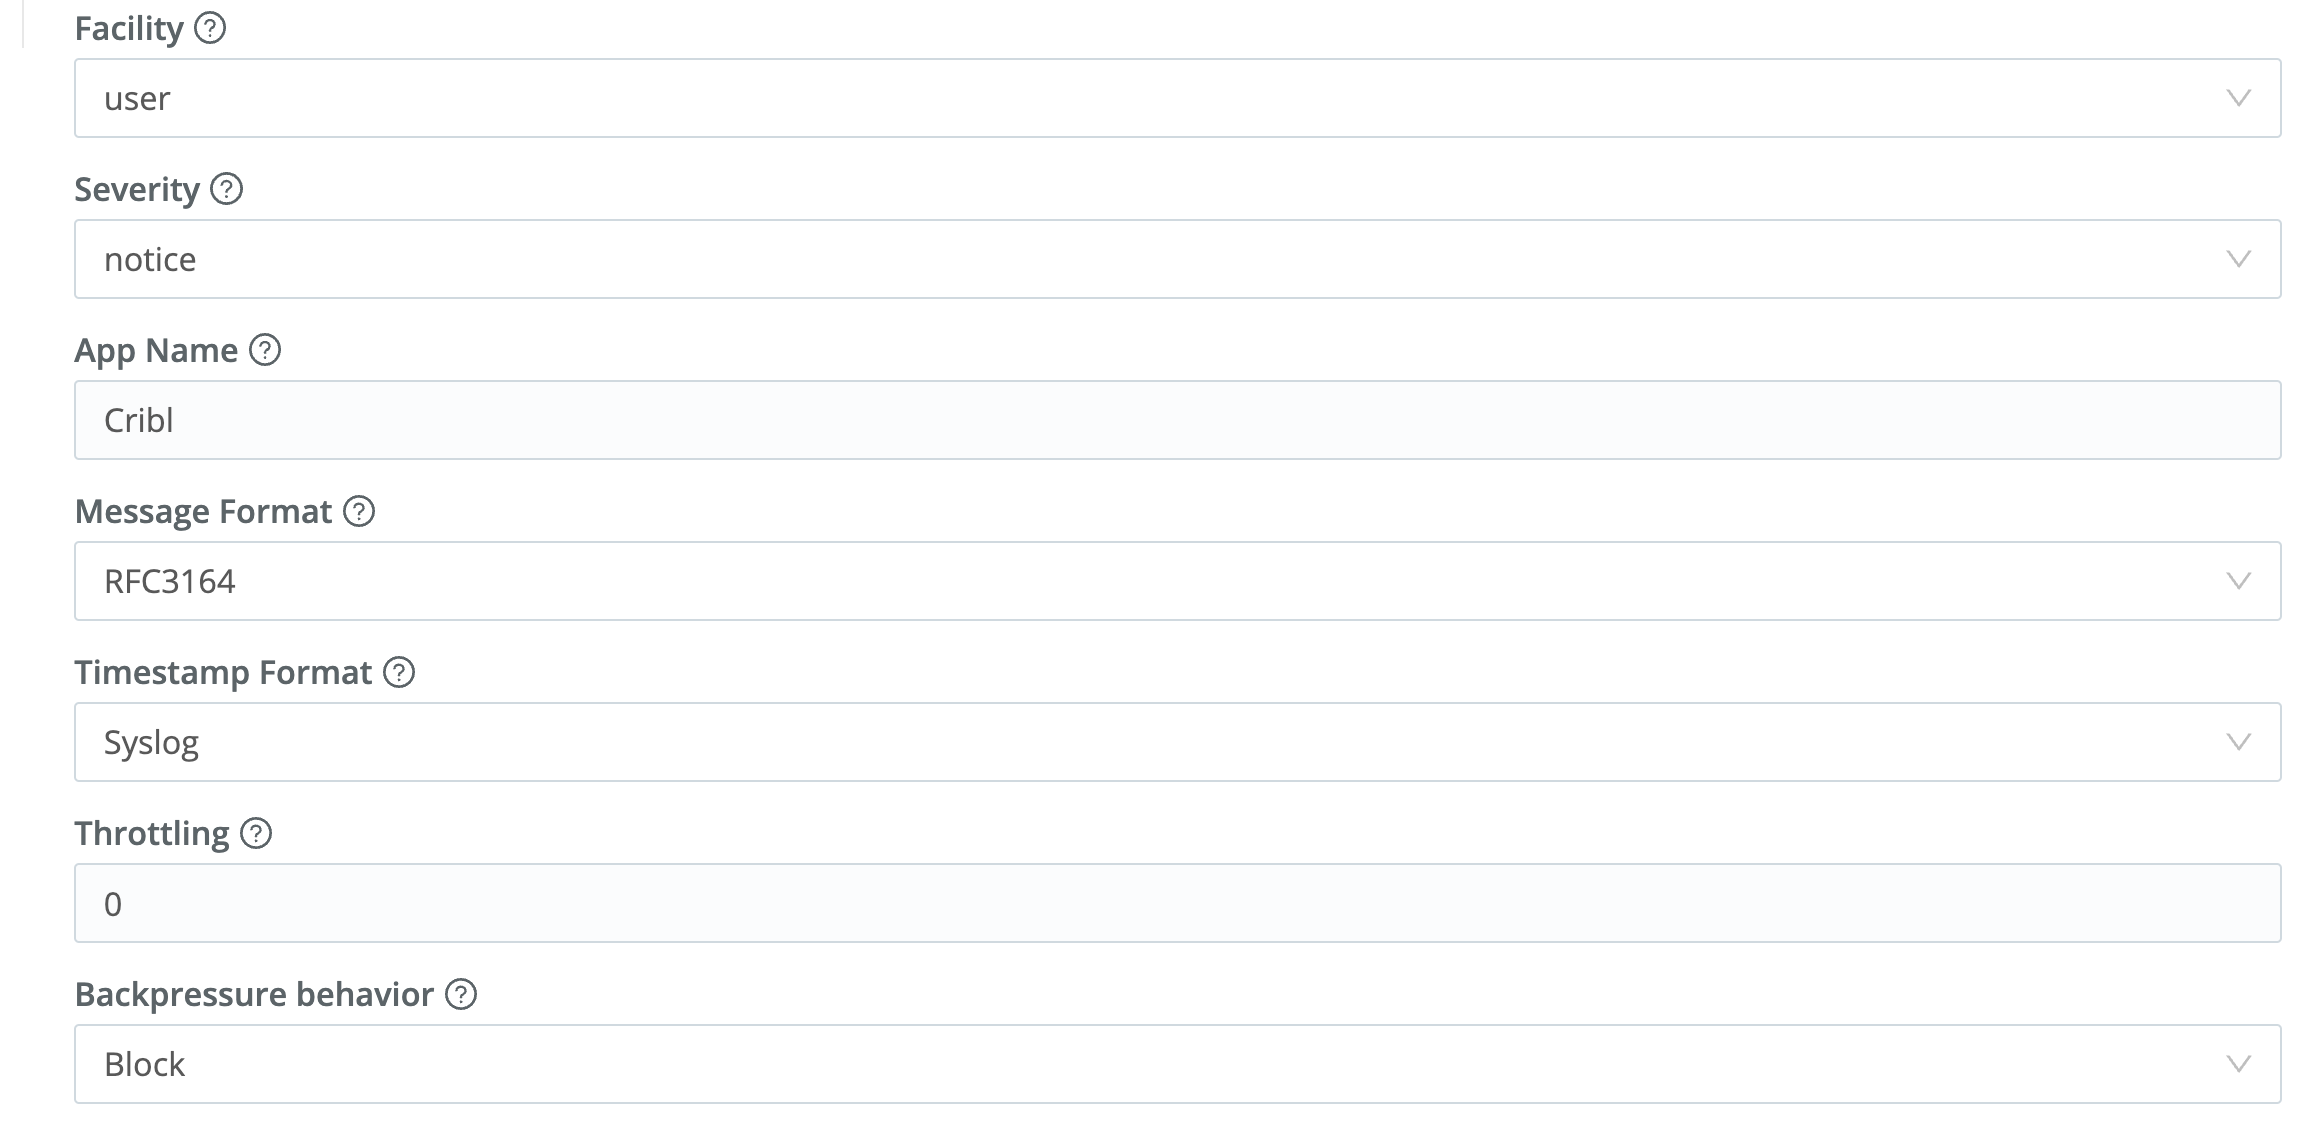 4. Save and enable the destination
After you’ve finished configuring the destination, save your changes and make sure the destination is enabled.
---
# Send data from Elastic Beats to Axiom
Source: https://axiom.co/docs/send-data/elastic-beats
[Elastic Beats](https://www.elastic.co/beats/) serves as a lightweight platform for data shippers that transfer information from the source to Axiom and other tools based on the configuration. Before shipping data, it collects metrics and logs from different sources, which later are deployed to your Axiom deployments.
There are different [Elastic Beats](https://www.elastic.co/beats/) you could use to ship logs. Axiom’s documentation provides a detailed step by step procedure on how to use each Beats.
4. Save and enable the destination
After you’ve finished configuring the destination, save your changes and make sure the destination is enabled.
---
# Send data from Elastic Beats to Axiom
Source: https://axiom.co/docs/send-data/elastic-beats
[Elastic Beats](https://www.elastic.co/beats/) serves as a lightweight platform for data shippers that transfer information from the source to Axiom and other tools based on the configuration. Before shipping data, it collects metrics and logs from different sources, which later are deployed to your Axiom deployments.
There are different [Elastic Beats](https://www.elastic.co/beats/) you could use to ship logs. Axiom’s documentation provides a detailed step by step procedure on how to use each Beats.
Logged in
Logged in
; } ``` ### Capture errors [#capture-errors] #### Capture errors on Next 15 or later [#capture-errors-on-next-15-or-later] To capture errors on Next 15 or later, use the `onRequestError` option. Create an `instrumentation.ts` file in the `src` or root folder of your Next.js app (depending on your configuration) with the following content: ```ts instrumentation.ts [expandable] import { logger } from "@/lib/axiom/server"; import { createOnRequestError } from "@axiomhq/nextjs"; export const onRequestError = createOnRequestError(logger); ``` Alternatively, customize the error logging by creating a custom `onRequestError` function: ```ts [expandable] import { logger } from "@/lib/axiom/server"; import { transformOnRequestError } from "@axiomhq/nextjs"; import { Instrumentation } from "next"; export const onRequestError: Instrumentation.onRequestError = async ( error, request, ctx ) => { logger.error(...transformOnRequestError(error, request, ctx)); await logger.flush(); }; ``` #### Capture errors on Next 14 or earlier [#capture-errors-on-next-14-or-earlier] To capture routing errors on Next 14 or earlier, use the [error handling mechanism of Next.js](https://nextjs.org/docs/app/building-your-application/routing/error-handling): 1. Create an `error.tsx` file in the `app` folder. 2. Inside your component function, add `useLogger` to send the error to Axiom. For example: ```tsx [expandable] "use client"; import NavTable from "@/components/NavTable"; import { LogLevel } from "@axiomhq/logging"; import { useLogger } from "@/lib/axiom/client"; import { usePathname } from "next/navigation"; export default function ErrorPage({ error, }: { error: Error & { digest?: string }; }) { const pathname = usePathname(); const log = useLogger({ source: "error.tsx" }); let status = error.message == "Invalid URL" ? 404 : 500; log.log(LogLevel.error, error.message, { error: error.name, cause: error.cause, stack: error.stack, digest: error.digest, request: { host: window.location.href, path: pathname, statusCode: status, }, }); return (
Ops! An Error has occurred:{" "}
);
}
```
### Advanced customizations [#advanced-customizations]
This section describes some advanced customizations.
#### Proxy for client-side usage [#proxy-for-client-side-usage]
Instead of sending logs directly to Axiom, you can send them to a proxy endpoint in your Next.js app. This is useful if you don’t want to expose the Axiom API token to the client or if you want to send the logs from the client to transports on your server.
1. Create a `client.ts` file in the `lib/axiom` folder with the following content:
```ts lib/axiom/client.ts [expandable]
'use client';
import { Logger, ProxyTransport } from '@axiomhq/logging';
import { createUseLogger, createWebVitalsComponent } from '@axiomhq/react';
export const logger = new Logger({
transports: [
new ProxyTransport({ url: '/api/axiom', autoFlush: true }),
],
});
const useLogger = createUseLogger(logger);
const WebVitals = createWebVitalsComponent(logger);
export { useLogger, WebVitals };
```
2. In the `/app/api/axiom` folder, create a `route.ts` file with the following content. This example uses `/api/axiom` as the Axiom proxy path.
```ts /app/api/axiom/route.ts
import { logger } from "@/lib/axiom/server";
import { createProxyRouteHandler } from "@axiomhq/nextjs";
export const POST = createProxyRouteHandler(logger);
```
For more information on React client side helpers, see [React](/send-data/react).
#### Customize data reports sent to Axiom [#customize-data-reports-sent-to-axiom]
To customize the reports sent to Axiom, use the `onError` and `onSuccess` functions that the `createAxiomRouteHandler` function accepts in the configuration object.
In the `lib/axiom/server.ts` file, use the `transformRouteHandlerErrorResult` and `transformRouteHandlerSuccessResult` functions to customize the data sent to Axiom by adding fields to the report object:
```ts [expandable]
import { Logger, AxiomJSTransport } from '@axiomhq/logging';
import {
createAxiomRouteHandler,
getLogLevelFromStatusCode,
nextJsFormatters,
transformRouteHandlerErrorResult,
transformRouteHandlerSuccessResult
} from '@axiomhq/nextjs';
/* ... your logger setup ... */
export const withAxiom = createAxiomRouteHandler(logger, {
onError: (error) => {
if (error.error instanceof Error) {
logger.error(error.error.message, error.error);
}
const [message, report] = transformRouteHandlerErrorResult(error);
report.customField = "customValue";
report.request.searchParams = error.req.nextUrl.searchParams;
logger.log(getLogLevelFromStatusCode(report.statusCode), message, report);
logger.flush();
},
onSuccess: (data) => {
const [message, report] = transformRouteHandlerSuccessResult(data);
report.customField = "customValue";
report.request.searchParams = data.req.nextUrl.searchParams;
logger.info(message, report);
logger.flush();
},
});
```
`{error.message}`
...
);
}
```
Web Vitals are only sent from production deployments.
### Logs [#logs-1]
Send logs to Axiom from different parts of your app. Each log function call takes a message and an optional `fields` object.
```ts [expandable]
log.debug("Login attempt", { user: "j_doe", status: "success" }); // Results in {"message": "Login attempt", "fields": {"user": "j_doe", "status": "success"}}
log.info("Payment completed", { userID: "123", amount: "25USD" });
log.warn("API rate limit exceeded", {
endpoint: "/users/1",
rateLimitRemaining: 0,
});
log.error("System Error", { code: "500", message: "Internal server error" });
```
#### Route handlers [#route-handlers-1]
Wrap your route handlers in `withAxiom` to add a logger to your request and log exceptions automatically:
```ts [expandable]
import { withAxiom, AxiomRequest } from "next-axiom";
export const GET = withAxiom((req: AxiomRequest) => {
req.log.info("Login function called");
// You can create intermediate loggers
const log = req.log.with({ scope: "user" });
log.info("User logged in", { userId: 42 });
return NextResponse.json({ hello: "world" });
});
```
#### Client components [#client-components-1]
To send logs from client components, add `useLogger` from next-axiom to your component:
```ts [expandable]
"use client";
import { useLogger } from "next-axiom";
export default function ClientComponent() {
const log = useLogger();
log.debug("User logged in", { userId: 42 });
return Logged in
; } ``` #### Server components [#server-components-1] To send logs from server components, add `Logger` from next-axiom to your component, and call flush before returning: ```ts [expandable] import { Logger } from "next-axiom"; export default async function ServerComponent() { const log = new Logger(); log.info("User logged in", { userId: 42 }); // ... await log.flush(); returnLogged in
; } ``` #### Log levels [#log-levels] The log level defines the lowest level of logs sent to Axiom. Choose one of the following levels (from lowest to highest): * `debug` is the default setting. It means that you send all logs to Axiom. * `info` * `warn` * `error` means that you only send the highest-level logs to Axiom. * `off` means that you don’t send any logs to Axiom. For example, to send all logs except for debug logs to Axiom: ```sh export NEXT_PUBLIC_AXIOM_LOG_LEVEL=info ``` ### Capture errors [#capture-errors-1] To capture routing errors, use the [error handling mechanism of Next.js](https://nextjs.org/docs/app/building-your-application/routing/error-handling): 1. Go to the `app` folder. 2. Create an `error.tsx` file. 3. Inside your component function, add `useLogger` from next-axiom to send the error to Axiom. For example: ```ts [expandable] "use client"; import NavTable from "@/components/NavTable"; import { LogLevel } from "@/next-axiom/logger"; import { useLogger } from "next-axiom"; import { usePathname } from "next/navigation"; export default function ErrorPage({ error, }: { error: Error & { digest?: string }; }) { const pathname = usePathname(); const log = useLogger({ source: "error.tsx" }); let status = error.message == "Invalid URL" ? 404 : 500; log.logHttpRequest( LogLevel.error, error.message, { host: window.location.href, path: pathname, statusCode: status, }, { error: error.name, cause: error.cause, stack: error.stack, digest: error.digest, } ); return (
Ops! An Error has occurred:{" "}
);
}
```
### Extend logger [#extend-logger]
To extend the logger, use `log.with` to create an intermediate logger. For example:
```ts [expandable]
const logger = useLogger().with({ userId: 42 });
logger.info("Hi"); // will ingest { ..., "message": "Hi", "fields" { "userId": 42 }}
```
---
# Send OpenTelemetry data to Axiom
Source: https://axiom.co/docs/send-data/opentelemetry
OpenTelemetry (OTel) is a set of APIs, libraries, and agents to capture distributed traces and metrics from your app. It’s a Cloud Native Computing Foundation (CNCF) project that was started to create a unified solution for service and app performance monitoring.
The OpenTelemetry project has published strong specifications for the three main pillars of observability: logs, traces, and metrics. These schemas are supported by all tools and services that support interacting with OpenTelemetry. Axiom supports OpenTelemetry natively on an API level, allowing you to connect any existing OpenTelemetry shipper, library, or tool to Axiom for sending data.
OpenTelemetry-compatible events flow into Axiom, where they’re organized into datasets for easy segmentation. Users can create a dataset to receive OpenTelemetry data and obtain an API token for ingestion. Axiom provides comprehensive observability through browsing, querying, dashboards, and alerting of OpenTelemetry data.
| OpenTelemetry component | Support |
| ------------------------------------------------------------------ | ------- |
| [Logs](https://opentelemetry.io/docs/concepts/signals/logs/) | ✓ |
| [Traces](https://opentelemetry.io/docs/concepts/signals/traces/) | ✓ |
| [Metrics](https://opentelemetry.io/docs/concepts/signals/metrics/) | ✓ |
`{error.message}`