> ## Documentation Index
> Fetch the complete documentation index at: https://axiom.co/docs/llms.txt
> Use this file to discover all available pages before exploring further.
# Query using Builder
> This page explains how to use the visual query builder to query your data in Console.
Builder allows you query your data using a visual interface in the Console.
## Typical query workflow
Creating a query in Builder typically involves the following steps:
1. **Source:** Select the data you want to query.
2. **Filter:** Narrow down the query results.
3. **Transform and aggregate:** Apply functions to shape and summarize the data before viewing results.
4. **Time range:** Specify the time period over which you want to look up data.
Builder adapts to the type of data you query:
* **Logs, traces, and events:** Select dataset as the source, use **Summarize** to aggregate, and **More** for sort and limit options.
* **Metrics:** Select dataset and metric as the source, use **Transformations** to transform and aggregate the data.
## Query data using Builder
1. Click the Query tab.
2. Click **Builder** in the top left.
3. Define the query:
* From the list, select the dataset that you want to query.
* In **Where**, [add filters](#add-filters) to narrow down the query results.
* In **Summarize**, [add visualizations](#add-visualizations) to the query results.
* In **More**, [specify additional options](#more-options) such as sorting the results or limiting the number of displayed events.
* In **Dataset**, define the source of your query. Select an OTel metrics dataset, and then select the metric you want to query.
The dataset and metric names are separated by a colon in the Builder interface. For example, `axiom-dev.metrics:alertmanager_alerts`.
* In **Where**, [add filters](#filter) to narrow down the query results. Restrict the query to a set of series whose tag values match the conditions you specify.
* In **Transformations**, [select transformations](#transformations) to apply to the data.
The metric selector only shows metrics that were active during the selected time range. Expand the time range to see more metrics in the dropdown.
4. [Select the time range](#select-time-range).
5. Click **Run**.
While the query runs, the status bar gives you continuous updates about the number of rows examined, matched, and returned.
See below for more information about each of these steps.
## Example query
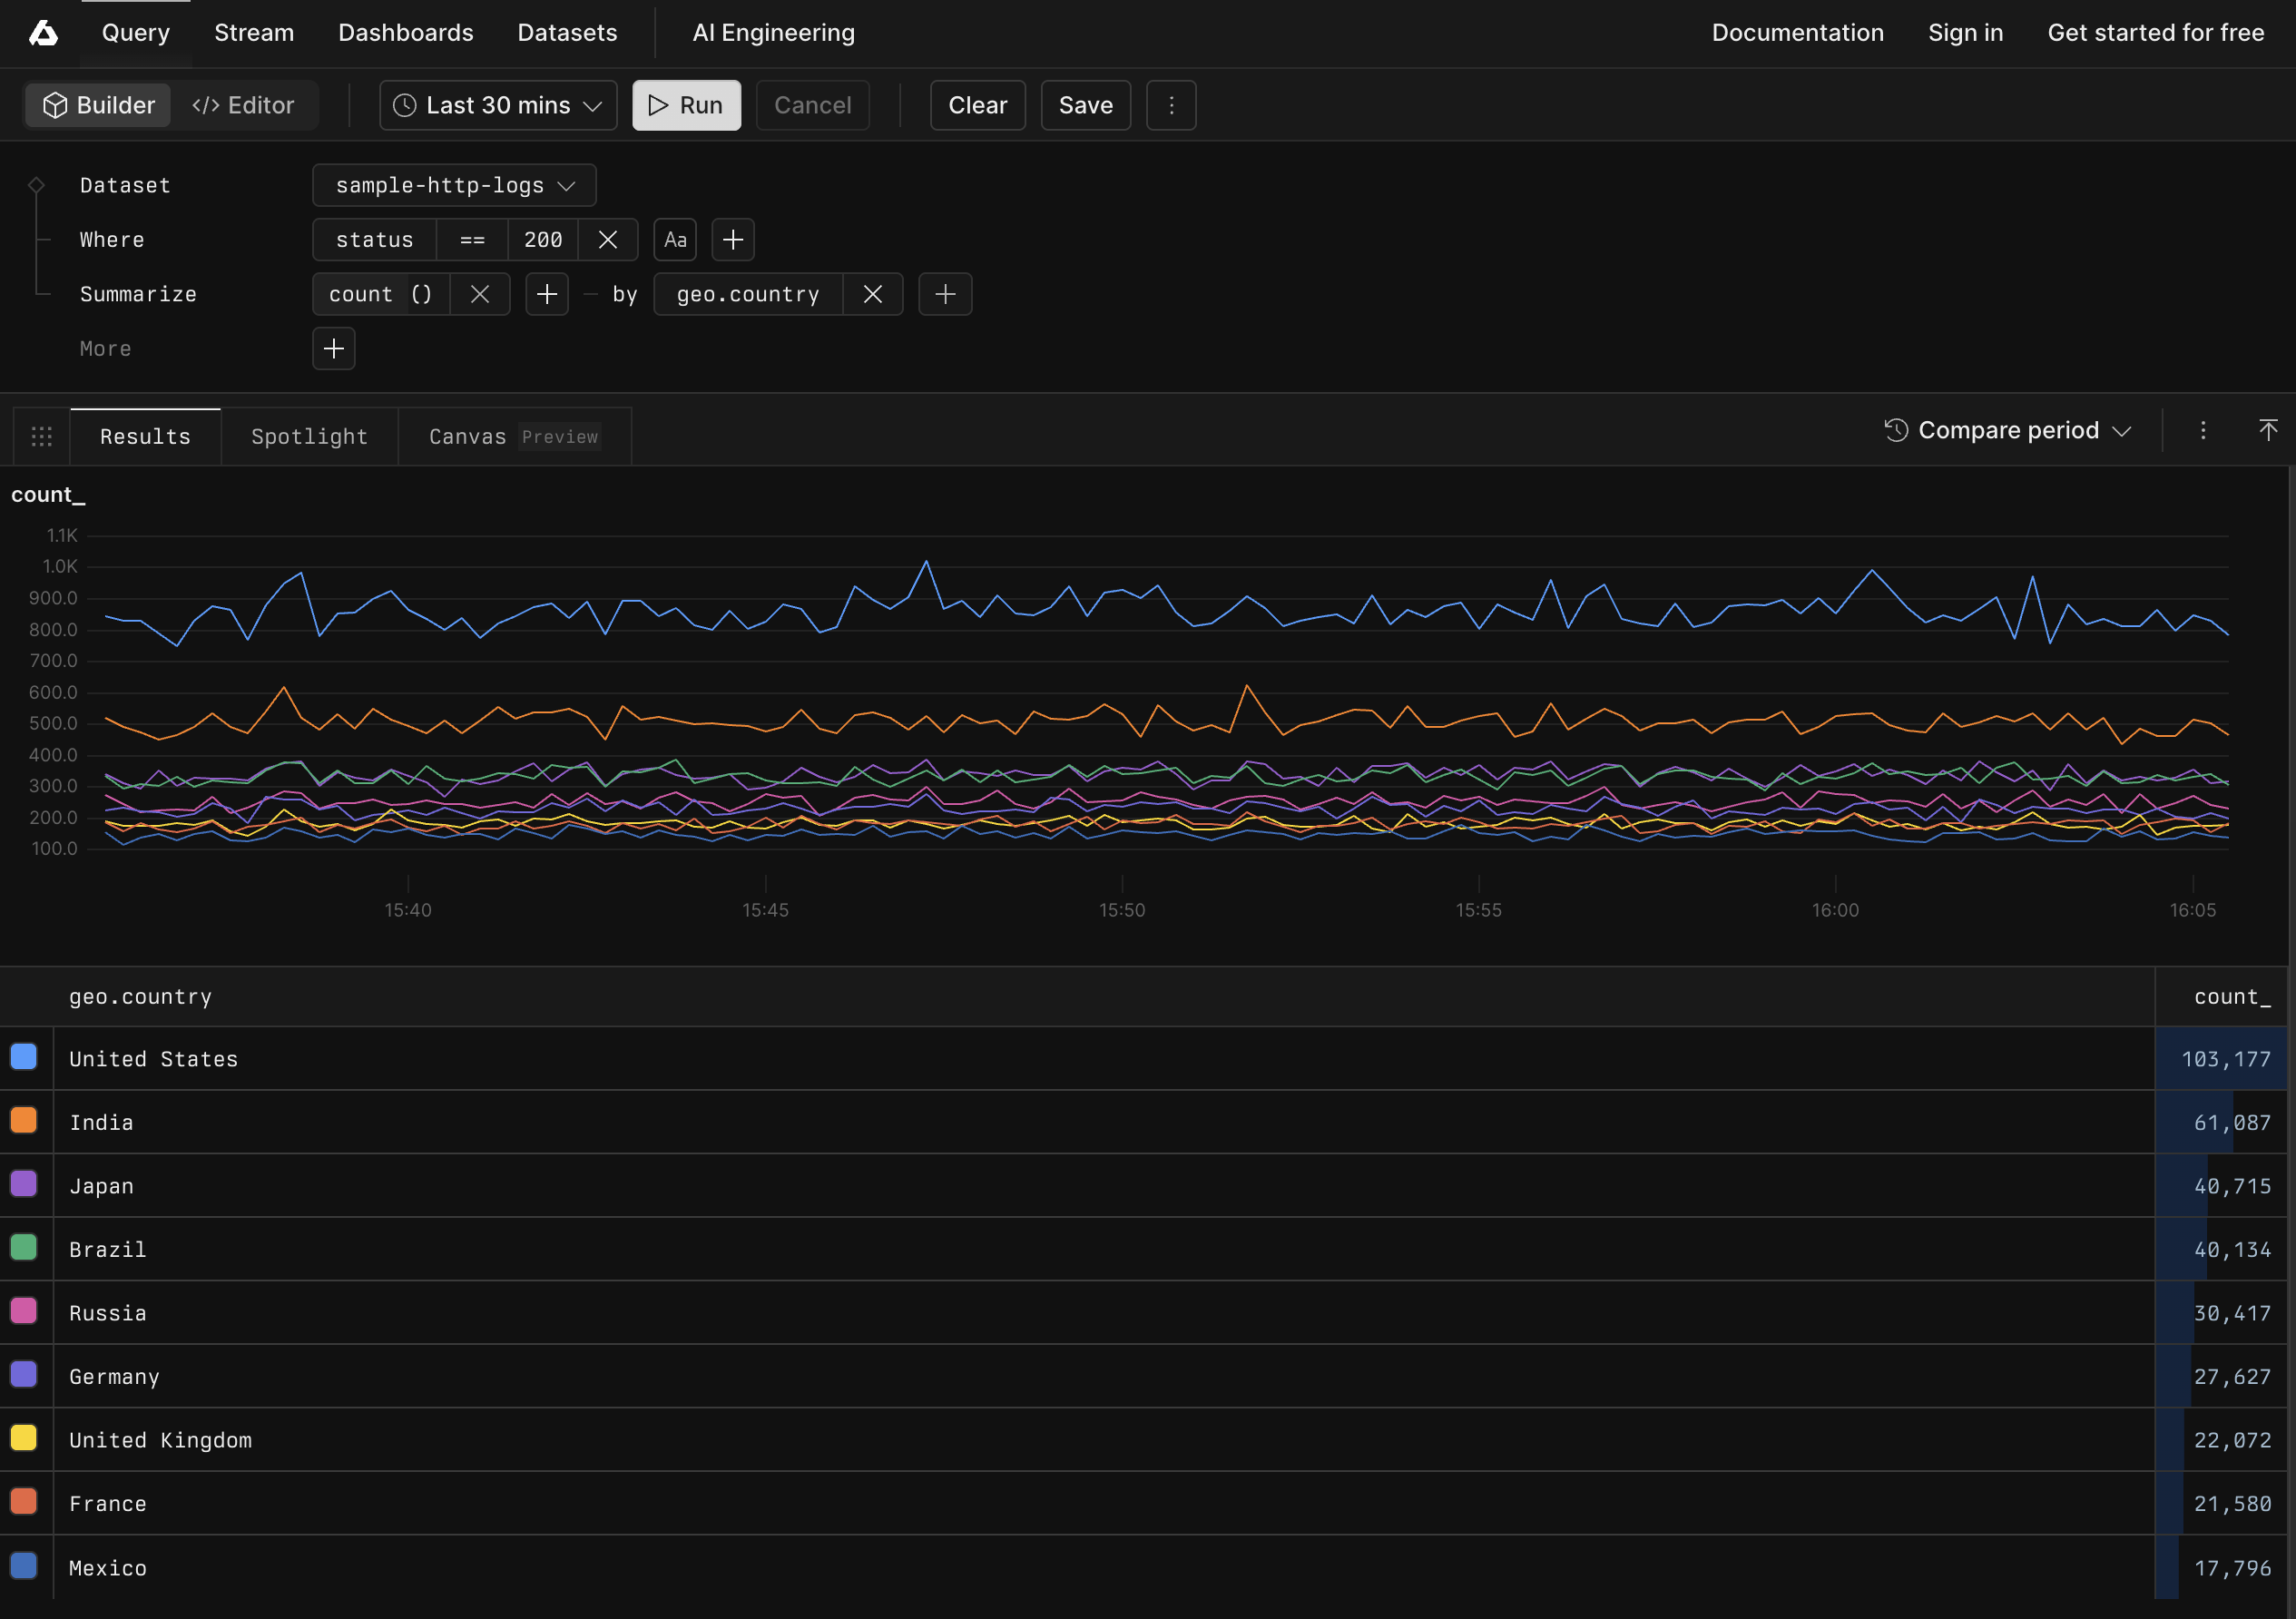 This example queries the `sample-http-logs` dataset to find all events where the HTTP status code is 200 and groups the results by county.
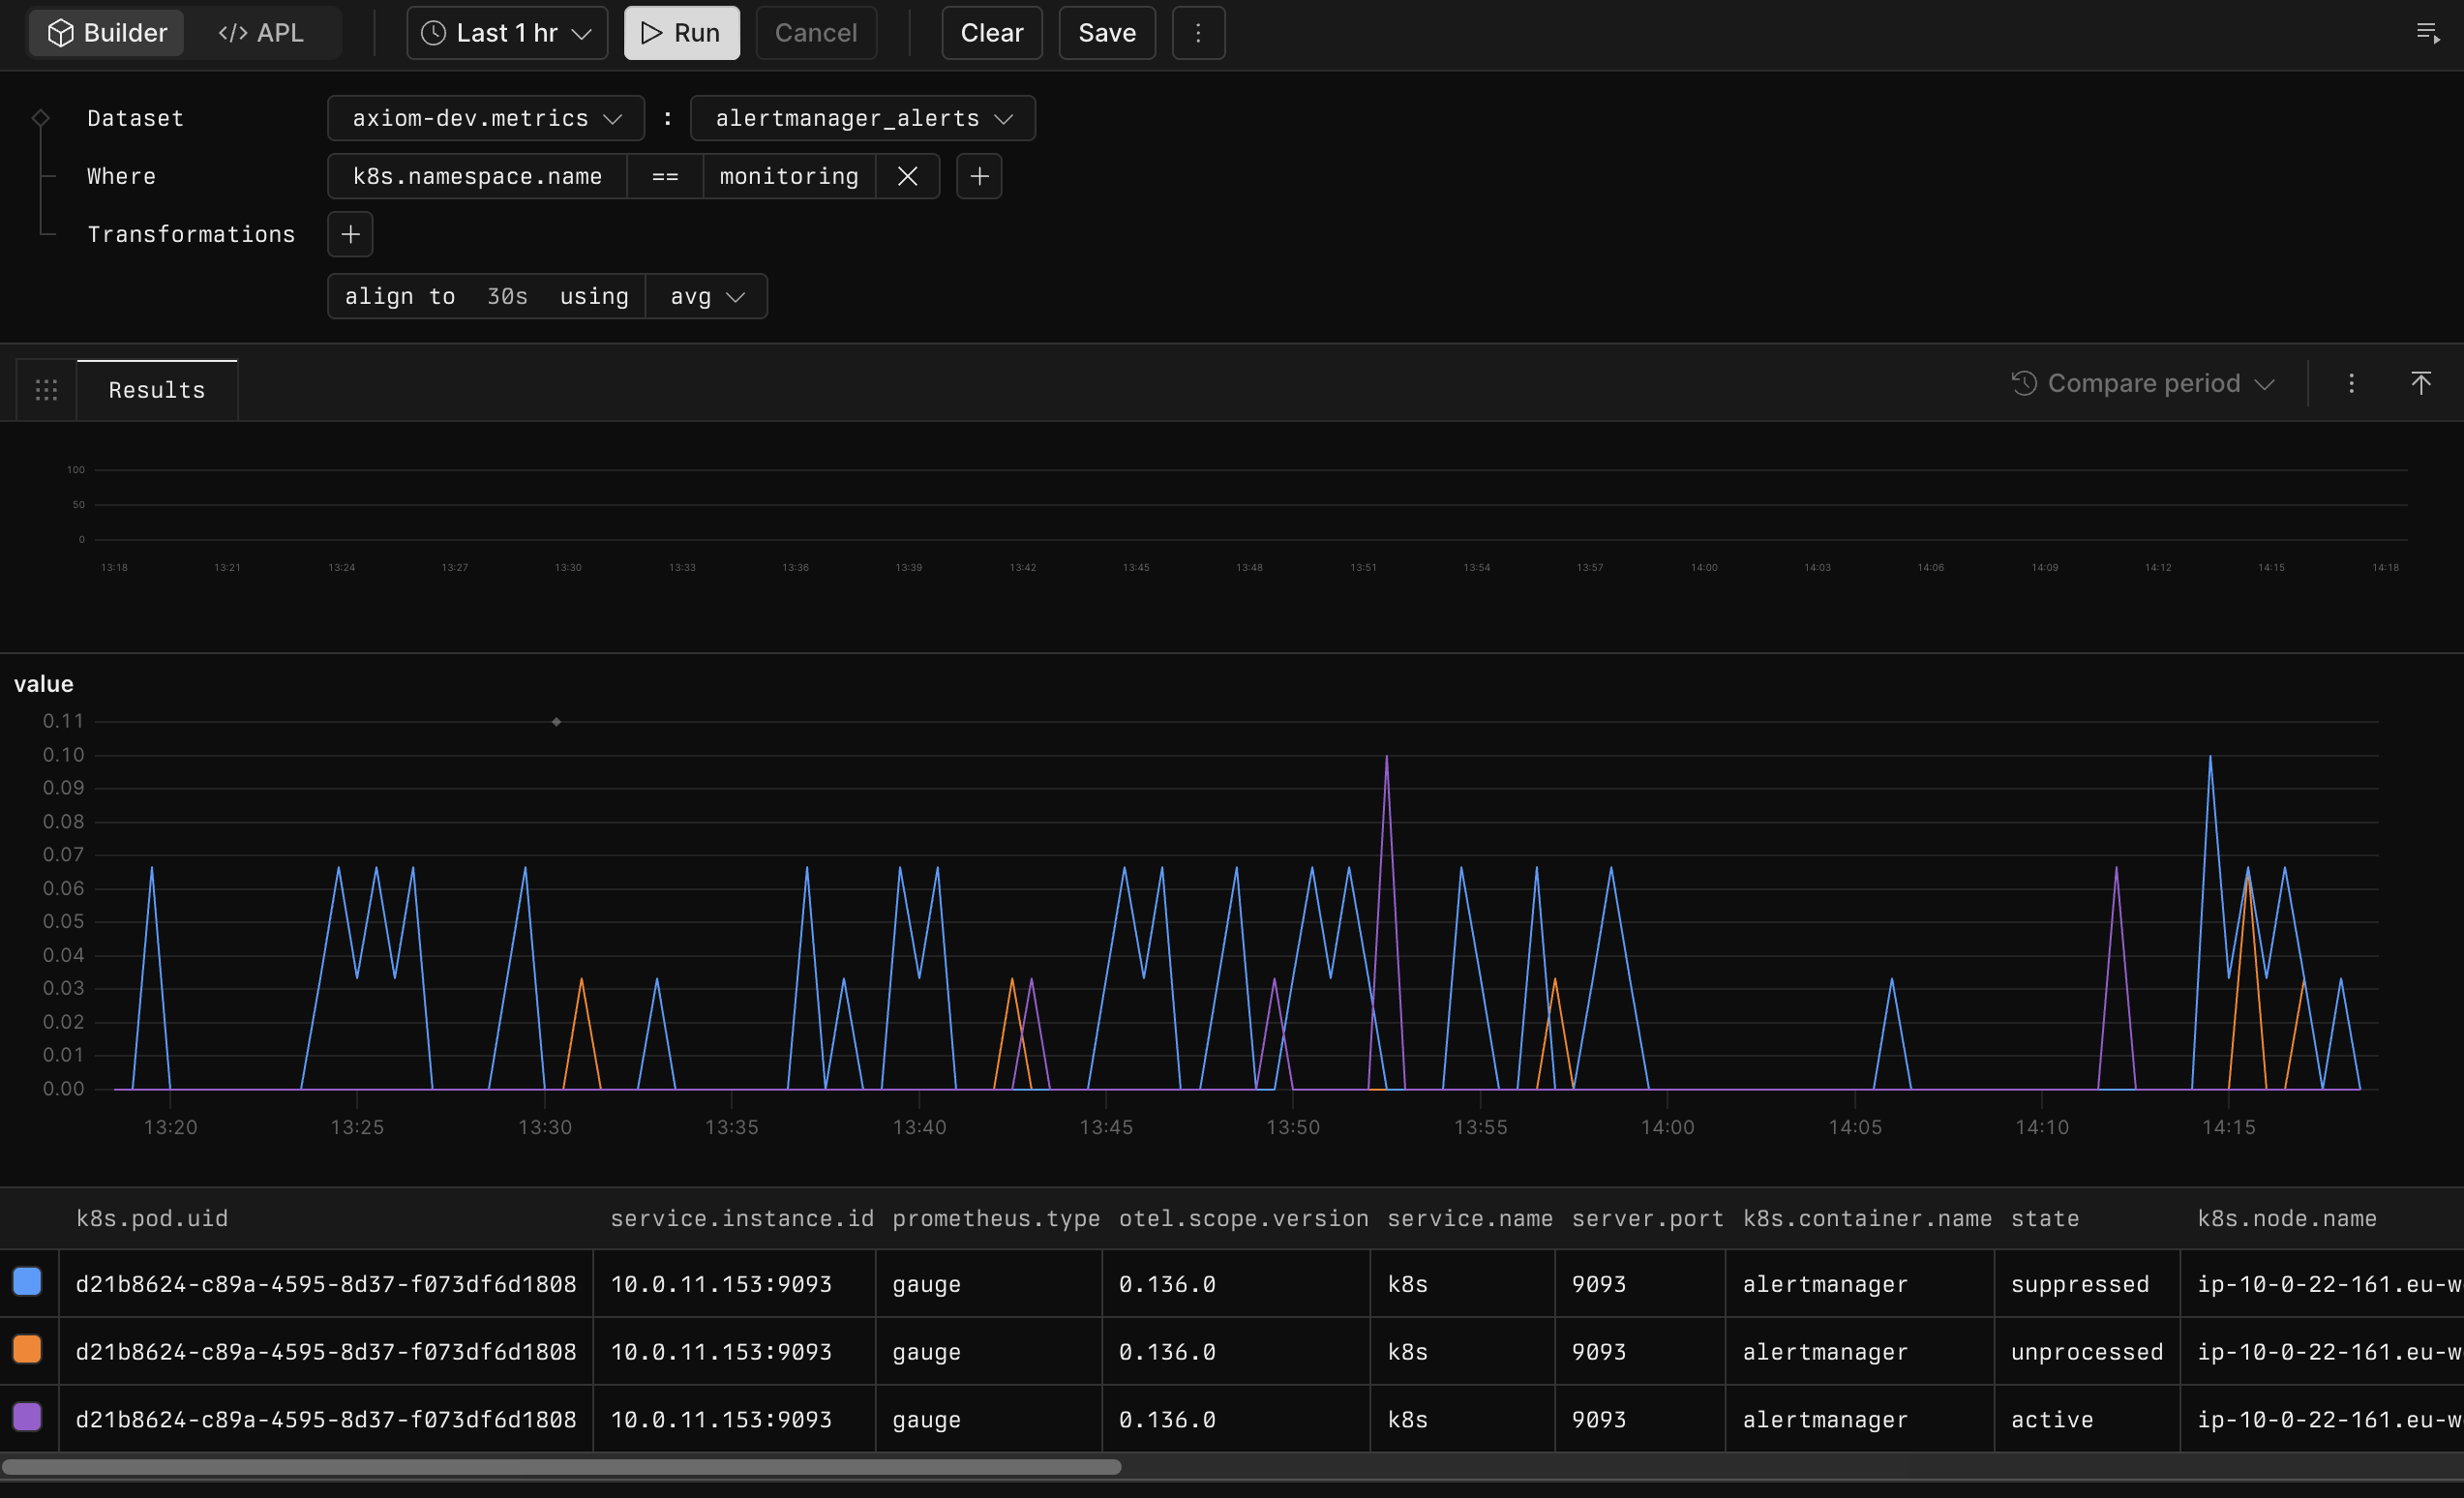 This example queries the `axiom-dev.metrics` dataset’s `alertmanager_alerts` metric one hour before the current time. It filters results to events where `k8s.namespace.name` is `monitoring` and aggregates events over 30-second time windows into their average value.
## Query logs, traces, and events
### Add filters
Use the **Where** section to filter the results to specific events. For example, to filter for events that originate in a specific geolocation like France.
To add a filter:
1. Click **+** in the **Where** section.
2. Select the field where you want to filter for values. For example, `geo.country`.
3. Select the logical operator of the filter. These are different for each field type. For example, you can use **starts-with** for string fields and **>=** for number fields. In this example, select `==` for an exact match.
4. Specify the value for which you want to filter. In this example, enter `France`.
When you run the query, the results only show events matching the criteria you specified for the filter.
[Run in Playground](https://play.axiom.co/axiom-play-qf1k/query?initForm=%7B%22apl%22%3A%22%5B'sample-http-logs'%5D%5Cn%7C%20where%20%5B'geo.country'%5D%20%3D~%20'France'%22%7D)
### Add multiple filters
You can add multiple filters and combine them with AND/OR operators. For example, to filter for events that originate in France or Germany.
To add and combine multiple filters:
1. Add a filter for France as explained in [Add filters](#add-filters).
2. Add a filter for Germany as explained in [Add filters](#add-filters).
3. Click **and** that appears between the two filters, and then select **or**.
The query results display events that originate in France or Germany.
[Run in Playground](https://play.axiom.co/axiom-play-qf1k/query?initForm=%7B%22apl%22%3A%22%5B'sample-http-logs'%5D%5Cn%7C%20where%20\(%5B'geo.country'%5D%20%3D~%20'France'%20or%20%5B'geo.country'%5D%20%3D~%20'Germany'\)%22%7D)
You can add groups of filters using the **New Group** element.
Axiom supports AND/OR operators at the top level and one level deep.
### Add visualizations
Axiom provides powerful visualizations that display the output of aggregate functions across your dataset. The **Summarize** section provides you with several ways to visualize the query results. For example, the `count` visualization displays the number of events matching your query over time. Some visualizations require an argument such as a field or other parameters.
[Run in Playground](https://play.axiom.co/axiom-play-qf1k/query?initForm=%7B%22apl%22%3A%22%5B'sample-http-logs'%5D%5Cn%7C%20summarize%20count\(\)%20by%20bin_auto\(_time\)%22%7D)
For more information about visualizations, see [Visualize data](/query-data/visualizations).
### Segment data
When visualizing data, segment data into specific groups to see more clearly how the data behaves. For example, to see how many events originate in each geolocation, select the `count` visualization and group by `geo.country`.
[Run in Playground](https://play.axiom.co/axiom-play-qf1k/query?initForm=%7B%22apl%22%3A%22%5B'sample-http-logs'%5D%5Cn%7C%20summarize%20count\(\)%20by%20bin_auto\(_time\)%2C%20%5B'geo.country'%5D%22%7D)
### More options
In the **More** section, specify the following additional options:
* By default, Axiom automatically chooses the best ordering for the query results. To specify the sorting order manually, click **Sort by**, and then select the field according to which you want to sort the results.
* To limit the number of events the query returns, click **Limit**, and then specify the maximum number of returned events.
* Specify whether to display or hide open intervals.
## Query metrics
Your metrics data is organized into datasets, metrics, tags, and series:
* **Dataset:** A group of related metrics.
* **Metric:** A measurement that tracks a specific aspect of your system over time.
* **Tag:** A key-value pair identifying a series.
* **Series:** A unique combination of a metric and tag set.
### Filter
Use the **Where** section to filter series based on tag values:
1. Click **+** in the **Where** section.
2. Select the tag where you want to filter for values.
3. Select the logical operator of the filter. Available operators are:
* Equality: `==`, `!=`
* Comparisons: `<`, `<=`, `>`, `>=`
4. Specify the value for which you want to filter.
5. Click **+** to add another filter and join them with the logical and operator.
For example, the following joins three filters: `project == /.*metrics.*/ and code >= 200 and code < 300`.
### Transformations
Use the **Transformations** section to transform individual values or series.
1. Click **+** in the **Transformations** section.
2. Select the transformation you want to apply to the data. Available transformations are:
* **map:** Map the data to a new value using the expression you specify.
* **align:** Aggregate data using the function and the time window you specify.
* **group:** Group the data by a set of tags using the aggregation function you specify.
* **bucket** Aggregate the data by time and tag dimensions simultaneously.
#### Map
Use `map` to transform individual values.
Available mapping functions:
| Function | Description |
| --------------------- | ------------------------------------------------------- |
| `rate` | Computes the per-second rate of change for a metric. |
| `abs` | Returns the absolute value of each data point. |
| `interpolate::linear` | Linear interpolation of missing values. |
| `fill::prev` | Fills missing values using the previous non-null value. |
For example, to calculate rate per second for the metric, use `map rate`. To fill empty values with the latest value, use `map fill::prev`.
#### Align
Use `align` to aggregate over time windows. You can specify the time window and the aggregation function to apply.
Available aggregation functions:
| Function | Description |
| ------------ | -------------------------------------- |
| `avg` | Averages values in each interval. |
| `count` | Counts non-null values per interval. |
| `max` | Takes the maximum value per interval. |
| `min` | Takes the minimum value per interval. |
| `prom::rate` | PromQL-style rate calculation. |
| `sum` | Sums values in each interval. |
| `last` | Takes the last value in each interval. |
For example, to calculate the average over 5-minute time windows, use `align to 5m using avg`. To count the data points in the last hour, use `align to 1h using count`.
When metrics emit data at regular intervals but with different offsets across time series, `align` maps your data to a fixed set of time intervals. This makes it easier to visualize data from different sources on a single chart. If the alignment interval is shorter than the emission interval, some intervals can have null values. Select how to handle null values in the [chart options](/query-data/query-results#configure-chart-options).
#### Group
Use `group` to combine series by tags. You can specify the tags to group by and the aggregation function to apply. If you don’t specify tags, Axiom aggregates all series into one group.
Available aggregation functions:
| Function | Description |
| -------- | ---------------------------------- |
| `avg` | Averages values in each group. |
| `count` | Counts non-null values per group. |
| `max` | Takes the maximum value per group. |
| `min` | Takes the minimum value per group. |
| `sum` | Sums values in each group. |
For example:
* To calculate the number of series, use `group using count`.
* To sum the values of all series, use `group using sum`.
* To group data by the `project` and `namespace` tags using the `sum` aggregation, use `group by project, namespace using sum`.
#### Bucket
Use `bucket` to aggregate over time and tag dimensions simultaneously.
Available aggregation functions:
| Function | Description |
| ---------- | ------------------------------------------------------------------------------------------------------------------------------------------------------------------------------ |
| `avg` | Averages values in each group and time inverval. |
| `count` | Counts non-null values per group and time inverval. |
| `max` | Takes the maximum value per group and time inverval. |
| `min` | Takes the minimum value per group and time inverval. |
| `sum` | Sums values in each group and time inverval. |
| `quantile` | Computes the specified quantile per group and time inverval. Specify the quantile as a value between 0 and 1. For example, specifying 0.99 corresponds to the 99th percentile. |
For example:
* To calculate the average value per group and time interval, use `bucket using histogram(avg)`.
* To also count the number of data points per group and time interval, use `bucket using histogram(count, avg)`.
To show the results of multiple aggregations in a single chart, use multiple functions.
If you don’t specify tags with `bucket`, Axiom applies the specified aggregations to all tags.
When the underlying metric is a histogram, Axiom computes `bucket` aggregations using the `interpolate_cumulative_histogram` and `interpolate_delta_histogram` functions depending on the temporality used. For quantile aggregations, this estimates the quantile using the underlying histogram data.
## Select time range
When you select the time range of a query, you specify the time interval where you want to look for events.
To select the time range, choose one of the following options:
1. In the top left, click **Time range**.
2. Choose one of the following options:
* Use the **Quick range** items to quickly select popular time ranges.
* To the right of the **Start date** and **End date** fields, click **Select date and time** to select specific times.
* Enter the specific time in the **Start date** and **End date** fields using natural language. For example, `1 hour ago` or `last Monday at 3pm`. For more information on the supported natural language inputs, see the [Sugar documentation](https://sugarjs.com/docs/#/DateParsing). Don’t use the `from` and `after` keywords in your input.
This example queries the `axiom-dev.metrics` dataset’s `alertmanager_alerts` metric one hour before the current time. It filters results to events where `k8s.namespace.name` is `monitoring` and aggregates events over 30-second time windows into their average value.
## Query logs, traces, and events
### Add filters
Use the **Where** section to filter the results to specific events. For example, to filter for events that originate in a specific geolocation like France.
To add a filter:
1. Click **+** in the **Where** section.
2. Select the field where you want to filter for values. For example, `geo.country`.
3. Select the logical operator of the filter. These are different for each field type. For example, you can use **starts-with** for string fields and **>=** for number fields. In this example, select `==` for an exact match.
4. Specify the value for which you want to filter. In this example, enter `France`.
When you run the query, the results only show events matching the criteria you specified for the filter.
[Run in Playground](https://play.axiom.co/axiom-play-qf1k/query?initForm=%7B%22apl%22%3A%22%5B'sample-http-logs'%5D%5Cn%7C%20where%20%5B'geo.country'%5D%20%3D~%20'France'%22%7D)
### Add multiple filters
You can add multiple filters and combine them with AND/OR operators. For example, to filter for events that originate in France or Germany.
To add and combine multiple filters:
1. Add a filter for France as explained in [Add filters](#add-filters).
2. Add a filter for Germany as explained in [Add filters](#add-filters).
3. Click **and** that appears between the two filters, and then select **or**.
The query results display events that originate in France or Germany.
[Run in Playground](https://play.axiom.co/axiom-play-qf1k/query?initForm=%7B%22apl%22%3A%22%5B'sample-http-logs'%5D%5Cn%7C%20where%20\(%5B'geo.country'%5D%20%3D~%20'France'%20or%20%5B'geo.country'%5D%20%3D~%20'Germany'\)%22%7D)
You can add groups of filters using the **New Group** element.
Axiom supports AND/OR operators at the top level and one level deep.
### Add visualizations
Axiom provides powerful visualizations that display the output of aggregate functions across your dataset. The **Summarize** section provides you with several ways to visualize the query results. For example, the `count` visualization displays the number of events matching your query over time. Some visualizations require an argument such as a field or other parameters.
[Run in Playground](https://play.axiom.co/axiom-play-qf1k/query?initForm=%7B%22apl%22%3A%22%5B'sample-http-logs'%5D%5Cn%7C%20summarize%20count\(\)%20by%20bin_auto\(_time\)%22%7D)
For more information about visualizations, see [Visualize data](/query-data/visualizations).
### Segment data
When visualizing data, segment data into specific groups to see more clearly how the data behaves. For example, to see how many events originate in each geolocation, select the `count` visualization and group by `geo.country`.
[Run in Playground](https://play.axiom.co/axiom-play-qf1k/query?initForm=%7B%22apl%22%3A%22%5B'sample-http-logs'%5D%5Cn%7C%20summarize%20count\(\)%20by%20bin_auto\(_time\)%2C%20%5B'geo.country'%5D%22%7D)
### More options
In the **More** section, specify the following additional options:
* By default, Axiom automatically chooses the best ordering for the query results. To specify the sorting order manually, click **Sort by**, and then select the field according to which you want to sort the results.
* To limit the number of events the query returns, click **Limit**, and then specify the maximum number of returned events.
* Specify whether to display or hide open intervals.
## Query metrics
Your metrics data is organized into datasets, metrics, tags, and series:
* **Dataset:** A group of related metrics.
* **Metric:** A measurement that tracks a specific aspect of your system over time.
* **Tag:** A key-value pair identifying a series.
* **Series:** A unique combination of a metric and tag set.
### Filter
Use the **Where** section to filter series based on tag values:
1. Click **+** in the **Where** section.
2. Select the tag where you want to filter for values.
3. Select the logical operator of the filter. Available operators are:
* Equality: `==`, `!=`
* Comparisons: `<`, `<=`, `>`, `>=`
4. Specify the value for which you want to filter.
5. Click **+** to add another filter and join them with the logical and operator.
For example, the following joins three filters: `project == /.*metrics.*/ and code >= 200 and code < 300`.
### Transformations
Use the **Transformations** section to transform individual values or series.
1. Click **+** in the **Transformations** section.
2. Select the transformation you want to apply to the data. Available transformations are:
* **map:** Map the data to a new value using the expression you specify.
* **align:** Aggregate data using the function and the time window you specify.
* **group:** Group the data by a set of tags using the aggregation function you specify.
* **bucket** Aggregate the data by time and tag dimensions simultaneously.
#### Map
Use `map` to transform individual values.
Available mapping functions:
| Function | Description |
| --------------------- | ------------------------------------------------------- |
| `rate` | Computes the per-second rate of change for a metric. |
| `abs` | Returns the absolute value of each data point. |
| `interpolate::linear` | Linear interpolation of missing values. |
| `fill::prev` | Fills missing values using the previous non-null value. |
For example, to calculate rate per second for the metric, use `map rate`. To fill empty values with the latest value, use `map fill::prev`.
#### Align
Use `align` to aggregate over time windows. You can specify the time window and the aggregation function to apply.
Available aggregation functions:
| Function | Description |
| ------------ | -------------------------------------- |
| `avg` | Averages values in each interval. |
| `count` | Counts non-null values per interval. |
| `max` | Takes the maximum value per interval. |
| `min` | Takes the minimum value per interval. |
| `prom::rate` | PromQL-style rate calculation. |
| `sum` | Sums values in each interval. |
| `last` | Takes the last value in each interval. |
For example, to calculate the average over 5-minute time windows, use `align to 5m using avg`. To count the data points in the last hour, use `align to 1h using count`.
When metrics emit data at regular intervals but with different offsets across time series, `align` maps your data to a fixed set of time intervals. This makes it easier to visualize data from different sources on a single chart. If the alignment interval is shorter than the emission interval, some intervals can have null values. Select how to handle null values in the [chart options](/query-data/query-results#configure-chart-options).
#### Group
Use `group` to combine series by tags. You can specify the tags to group by and the aggregation function to apply. If you don’t specify tags, Axiom aggregates all series into one group.
Available aggregation functions:
| Function | Description |
| -------- | ---------------------------------- |
| `avg` | Averages values in each group. |
| `count` | Counts non-null values per group. |
| `max` | Takes the maximum value per group. |
| `min` | Takes the minimum value per group. |
| `sum` | Sums values in each group. |
For example:
* To calculate the number of series, use `group using count`.
* To sum the values of all series, use `group using sum`.
* To group data by the `project` and `namespace` tags using the `sum` aggregation, use `group by project, namespace using sum`.
#### Bucket
Use `bucket` to aggregate over time and tag dimensions simultaneously.
Available aggregation functions:
| Function | Description |
| ---------- | ------------------------------------------------------------------------------------------------------------------------------------------------------------------------------ |
| `avg` | Averages values in each group and time inverval. |
| `count` | Counts non-null values per group and time inverval. |
| `max` | Takes the maximum value per group and time inverval. |
| `min` | Takes the minimum value per group and time inverval. |
| `sum` | Sums values in each group and time inverval. |
| `quantile` | Computes the specified quantile per group and time inverval. Specify the quantile as a value between 0 and 1. For example, specifying 0.99 corresponds to the 99th percentile. |
For example:
* To calculate the average value per group and time interval, use `bucket using histogram(avg)`.
* To also count the number of data points per group and time interval, use `bucket using histogram(count, avg)`.
To show the results of multiple aggregations in a single chart, use multiple functions.
If you don’t specify tags with `bucket`, Axiom applies the specified aggregations to all tags.
When the underlying metric is a histogram, Axiom computes `bucket` aggregations using the `interpolate_cumulative_histogram` and `interpolate_delta_histogram` functions depending on the temporality used. For quantile aggregations, this estimates the quantile using the underlying histogram data.
## Select time range
When you select the time range of a query, you specify the time interval where you want to look for events.
To select the time range, choose one of the following options:
1. In the top left, click **Time range**.
2. Choose one of the following options:
* Use the **Quick range** items to quickly select popular time ranges.
* To the right of the **Start date** and **End date** fields, click **Select date and time** to select specific times.
* Enter the specific time in the **Start date** and **End date** fields using natural language. For example, `1 hour ago` or `last Monday at 3pm`. For more information on the supported natural language inputs, see the [Sugar documentation](https://sugarjs.com/docs/#/DateParsing). Don’t use the `from` and `after` keywords in your input.