> ## Documentation Index
> Fetch the complete documentation index at: https://axiom.co/docs/llms.txt
> Use this file to discover all available pages before exploring further.
# Metrics
> This section explains how to work with OpenTelemetry (OTel) metrics.
Axiom’s dedicated MetricsDB provides a purpose-built metrics datastore that handles high-cardinality time-series data without the cost penalties and performance degradation common in traditional metrics systems. This section explains how to work with OpenTelemetry (OTel) metrics in Axiom.
## What makes MetricsDB different
MetricsDB is engineered from the ground up to embrace dimensional complexity:
* **High-cardinality as a design principle**: Store metrics with high-cardinality tags. Where other metrics datastore penalize you with higher costs or degraded performance, MetricsDB treats high cardinality as a core capability.
* **Intentional architecture**: The storage format, query engine, and compression algorithms are specifically optimized for time-series metrics workloads. These design constraints are thoughtful trade-offs that deliver exceptional performance and cost-efficiency for real-world metrics use cases.
* **Unified observability**: Query metrics alongside logs, traces, and events, enabling powerful correlations across all your telemetry data without switching tools or learning multiple query languages.
### MetricsDB vs EventDB
Logs, traces, events, and metrics are different forms of machine data. It’s often possible to represent metrics as events, but a dedicated metrics datastore comes with the following benefits:
* **Efficient compression**: Instrumentation aggregates measurements on the client and sends summaries at regular intervals instead of individual events. This dramatically reduces data volume for high-frequency measurements.
* **Standardized data types**: OpenTelemetry defines a small set of metric types with clear semantics. The metric type tells you how to query the data—no guessing how to aggregate or calculate rates.
* **Faster queries**: Metrics data is stored in a format optimized for producing time series and other popular metrics visualizations. No need to process the data at query time.
### When to use MetricsDB or EventDB for metrics
| Use MetricsDB when | Use EventDB when |
| ---------------------------------------------------------------------------- | ------------------------------------- |
| You can send metrics using the OTel Collector or another OTel-compatible SDK | You can’t use OTel-compatible tooling |
| High-frequency measurements (many per second) | Low-frequency point-in-time gauges |
| You need rate calculations or percentiles | Simple aggregations are sufficient |
When in doubt, use MetricsDB. It’s designed for metrics workloads and scales better as volume grows.
## Prerequisites
* [Create an Axiom account](https://app.axiom.co/register).
* [Create a dataset in Axiom](/reference/datasets#create-dataset) where you send your data.
* [Create an API token in Axiom](/reference/tokens) with permissions to ingest data to the dataset you have created.
You must use a dedicated dataset for OTel metrics. When you create a dataset, select the type of OTel data you want to send to it. For more information, see [Create dataset](/reference/datasets#create-dataset).
## Ingest metrics
You can ingest OTel metrics the same way you ingest other types of OTel data.
For more information, see [Send OpenTelemetry data to Axiom](/send-data/opentelemetry).
The `/v1/metrics` endpoint only supports the `application/x-protobuf` content type. JSON format isn’t supported for metrics ingestion.
### Try it quickly with axiom-hostmetrics
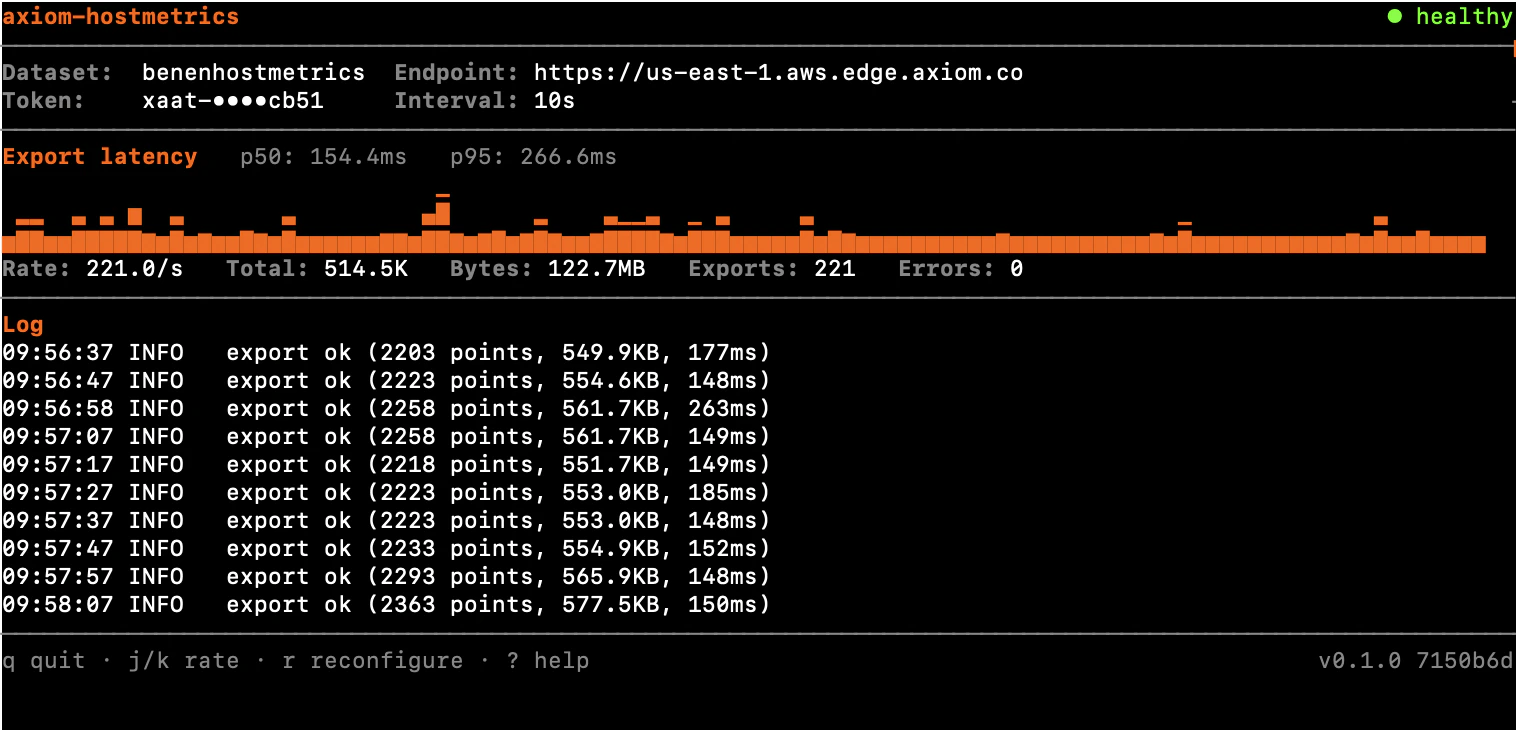
[axiom-hostmetrics](https://github.com/axiomhq/axiom-hostmetrics) is a small CLI that scrapes host metrics (CPU, memory, disk, network, and more) using the OpenTelemetry `hostmetricsreceiver` and ships them to Axiom via OTLP/HTTP. It’s a fast way to get real metrics data flowing so you can explore MetricsDB and MPL without setting up a full OTel Collector.
Install with Homebrew:
```sh theme={null}
brew install axiomhq/tap/axiom-hostmetrics
```
Or install with Go:
```sh theme={null}
go install github.com/axiomhq/axiom-hostmetrics/cmd/axiom-hostmetrics@latest
```
Run `axiom-hostmetrics` with no arguments to launch a setup wizard that asks for your dataset, API token, and endpoint, then starts streaming metrics immediately.
 ## Query metrics
You can query metric data in one of the following ways:
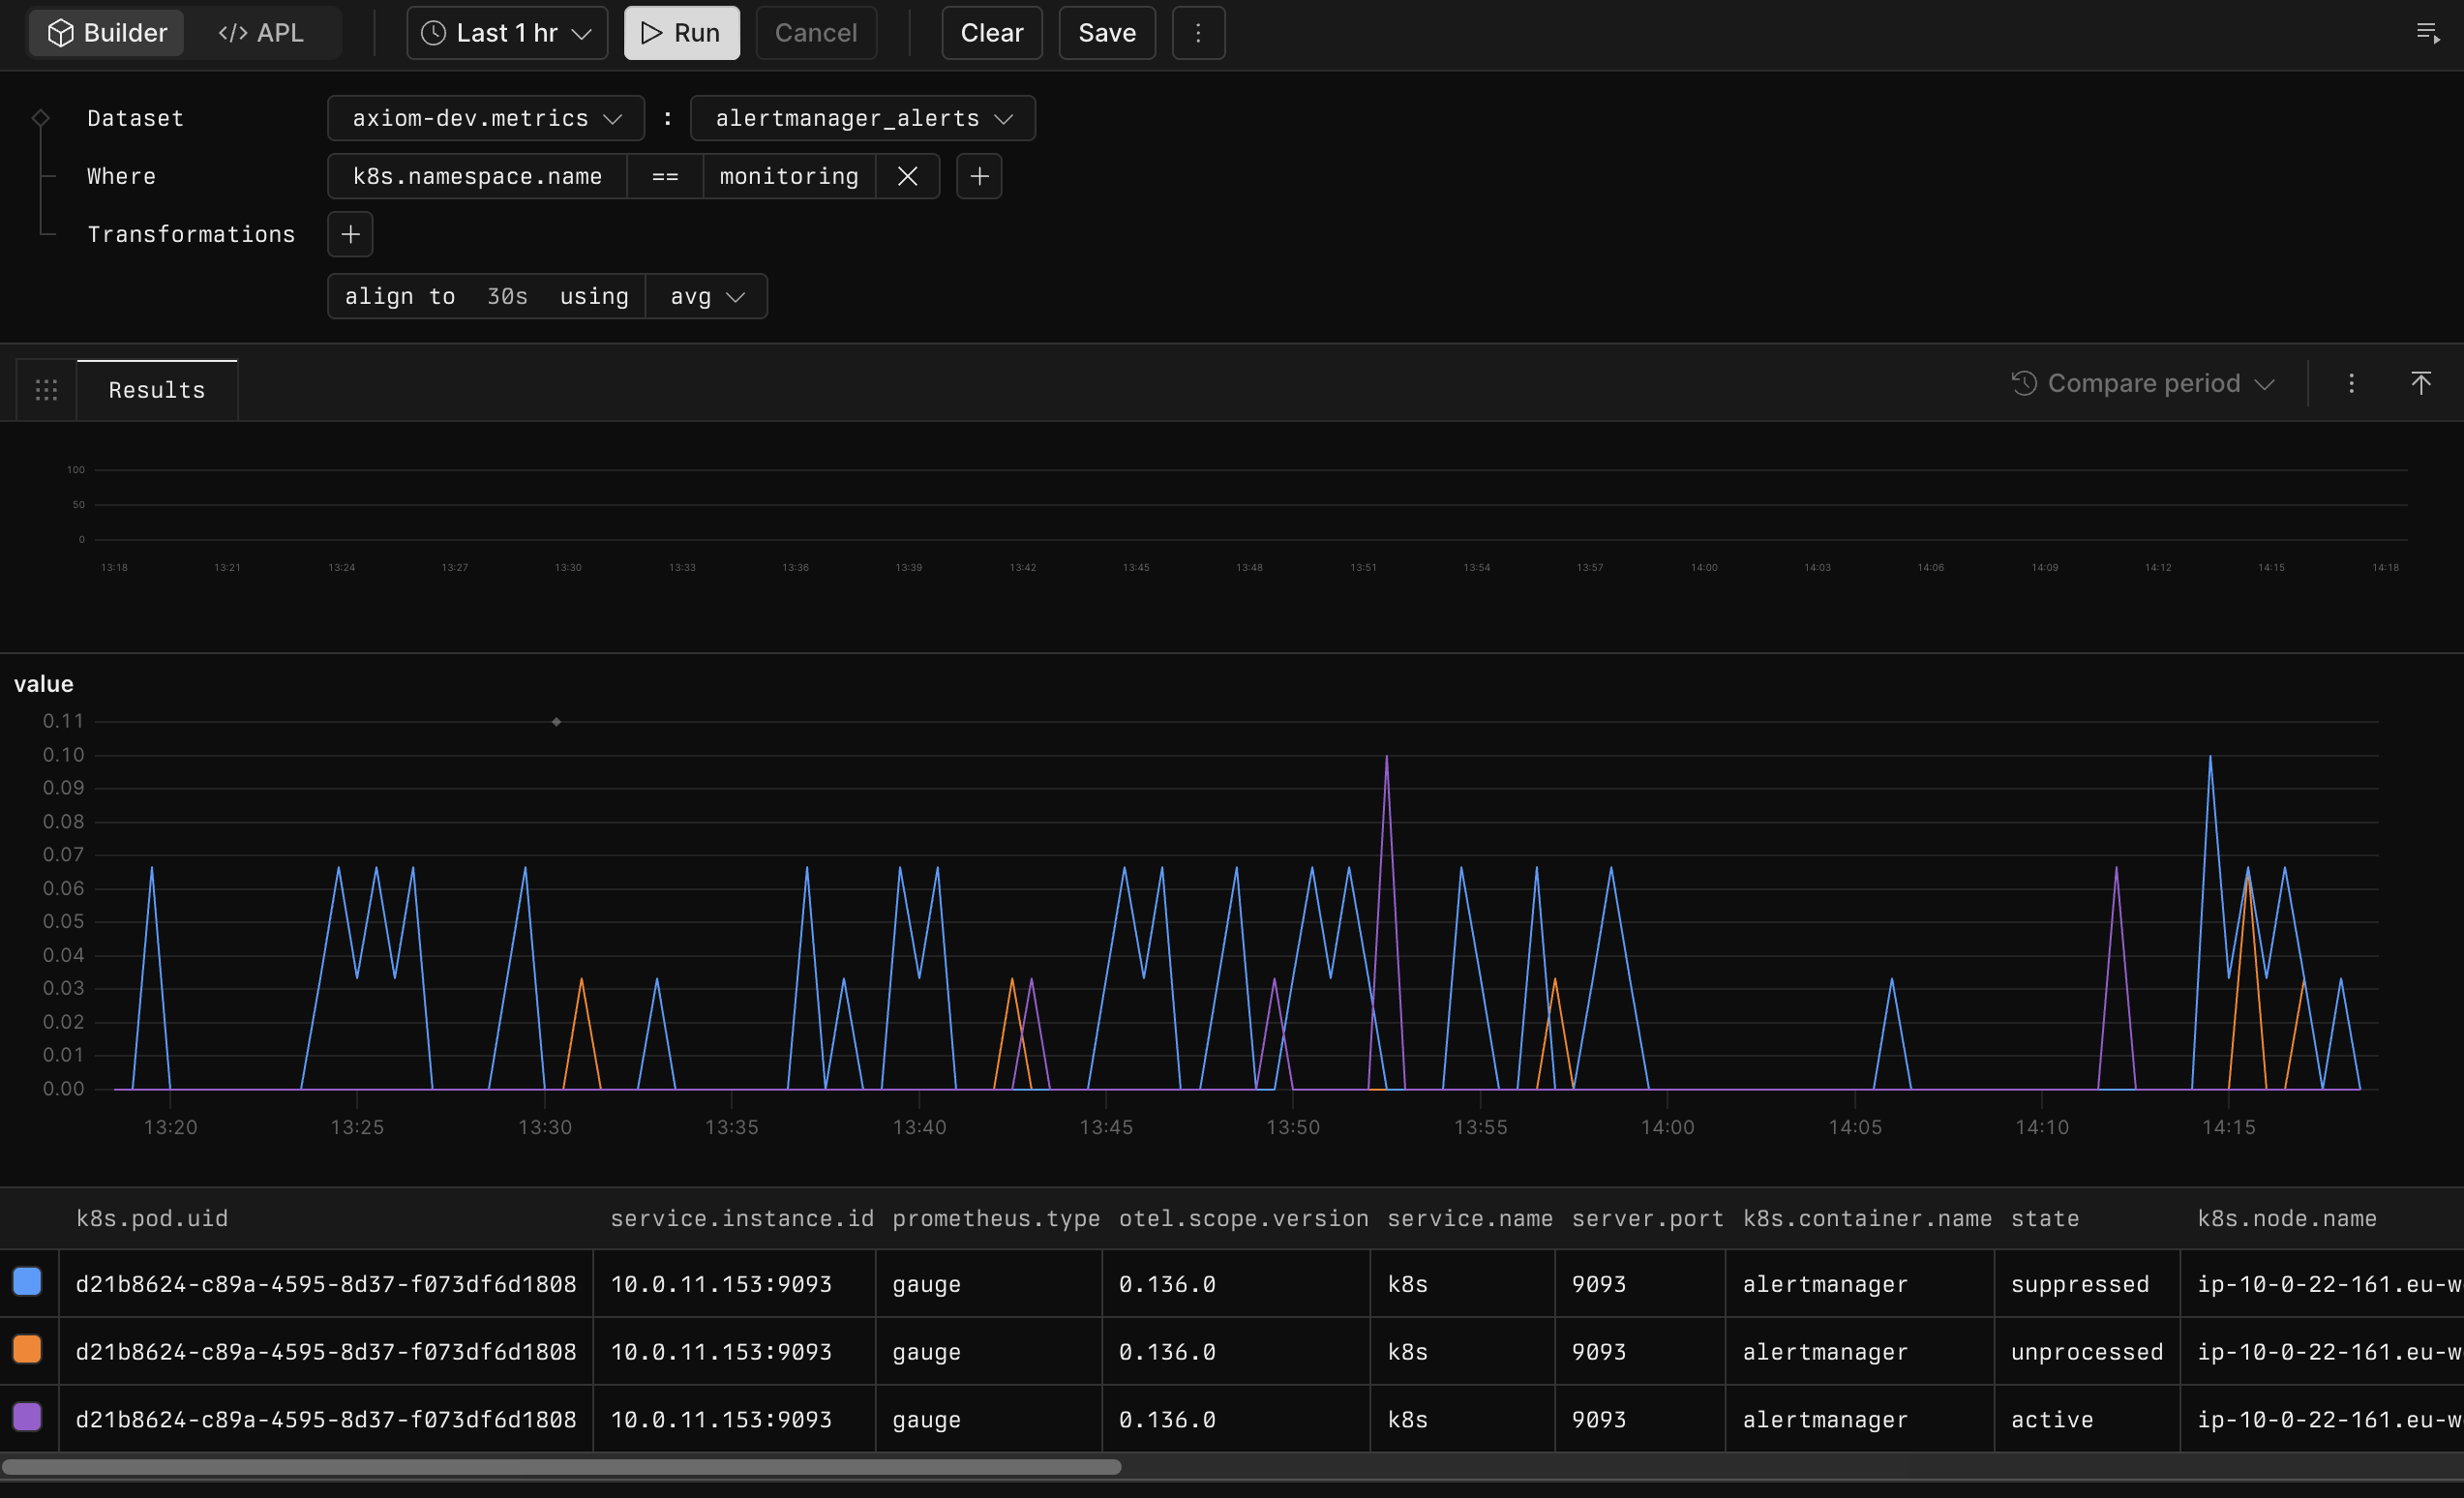
* **Builder**: A visual interface for building queries step by step. For more information, see [Query data using Builder](/query-data/explore).
* **MPL**: A text-based query language (Metrics Processing Language) for writing expressive queries directly. For more information, see [Query metrics using MPL](/mpl/introduction) and [Sample queries](/mpl/sample-queries).
Support for MPL (Metrics Processing Language) is currently in public preview. For more information, see [Feature states](/platform-overview/roadmap#feature-states).
* **Skills**: Use the [Query metrics skill](/console/intelligence/skills/query-metrics) to give AI agents the ability to query your metrics data via API.
* **MCP**: Use the [Axiom MCP server](console/intelligence/mcp-server) to allow an MCP-compatible client to query your metrics data.
## Query metrics
You can query metric data in one of the following ways:
* **Builder**: A visual interface for building queries step by step. For more information, see [Query data using Builder](/query-data/explore).
* **MPL**: A text-based query language (Metrics Processing Language) for writing expressive queries directly. For more information, see [Query metrics using MPL](/mpl/introduction) and [Sample queries](/mpl/sample-queries).
Support for MPL (Metrics Processing Language) is currently in public preview. For more information, see [Feature states](/platform-overview/roadmap#feature-states).
* **Skills**: Use the [Query metrics skill](/console/intelligence/skills/query-metrics) to give AI agents the ability to query your metrics data via API.
* **MCP**: Use the [Axiom MCP server](console/intelligence/mcp-server) to allow an MCP-compatible client to query your metrics data.
 ## Migrate PromQL queries
You can translate your existing PromQL queries to MPL with minimal changes. MPL also offers features not available in PromQL, such as native support for non-string tag types and custom transformation pipelines.
For more information, see [Migrate PromQL queries to Axiom](/mpl/migrate-metrics).
## Dashboards and monitors
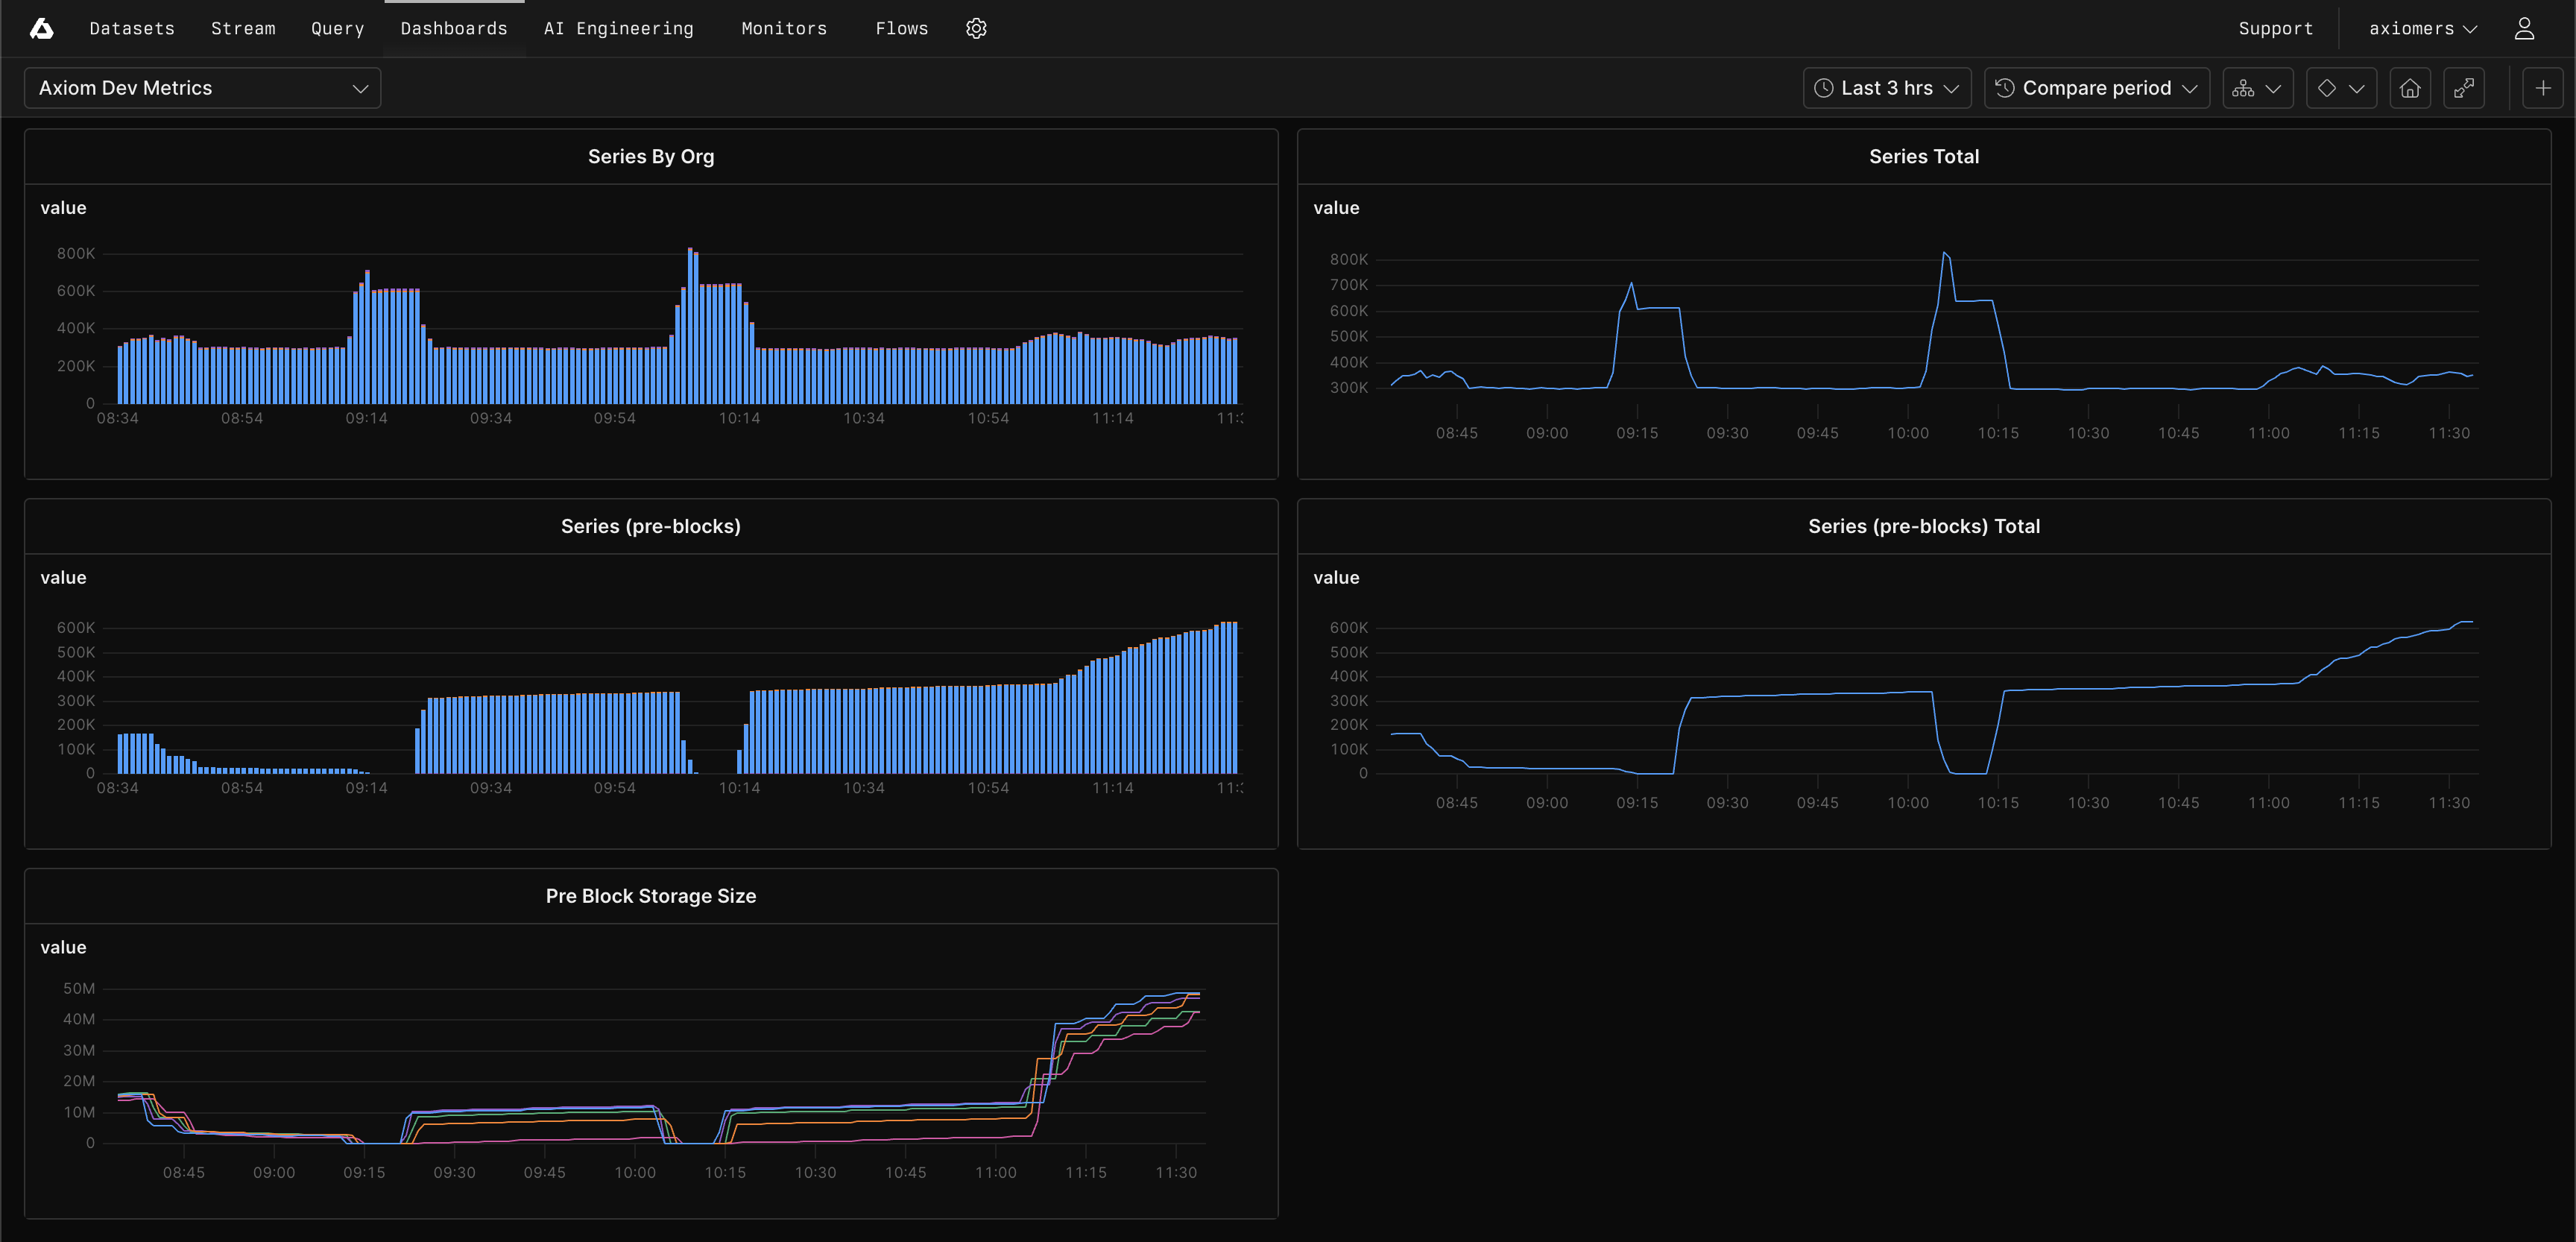
You can use OTel metrics in dashboards and monitors the same way you use other data types.
* Build visualizations using metrics queries.
* Set alerts on derived metrics such as error rate or latency percentiles.
* Combine multiple signals in a single panel.
For more information, see [Dashboards](/dashboards/overview) and [Monitors](/monitor-data/monitors).
## Migrate PromQL queries
You can translate your existing PromQL queries to MPL with minimal changes. MPL also offers features not available in PromQL, such as native support for non-string tag types and custom transformation pipelines.
For more information, see [Migrate PromQL queries to Axiom](/mpl/migrate-metrics).
## Dashboards and monitors
You can use OTel metrics in dashboards and monitors the same way you use other data types.
* Build visualizations using metrics queries.
* Set alerts on derived metrics such as error rate or latency percentiles.
* Combine multiple signals in a single panel.
For more information, see [Dashboards](/dashboards/overview) and [Monitors](/monitor-data/monitors).
 ## Design choices and constraints
MetricsDB makes intentional architectural trade-offs to optimize for the most common metrics use cases while maintaining exceptional performance at scale.
### Query scope
You can query one dataset per query.
### Supported data types
MetricsDB focuses on the core OpenTelemetry metric types that cover the vast majority of observability scenarios.
Axiom supports the following OpenTelemetry metric types:
* **Gauge**: Point-in-time measurements. For example, CPU usage or temperature.
* **Histogram**: Distribution of values with configurable buckets. For example, request latency.
* **Sum**: Sum of values. For example, request count.
* **Summary**: Summary of values. For example, request latency.
Axiom doesn’t currently support the following data types:
* Exponential histograms
* `bytes`, `kvlist`, and `array` tag value types
* Exemplar, baggage, and context data
* Nanosecond-precision timestamps
### Data model optimizations
MetricsDB applies the following transformations to improve query performance and reduce storage costs:
* **Timestamp precision**: Truncate nanosecond timestamps to second precision. MetricsDB is built for use cases where second-level granularity is sufficient, and this optimization significantly improves compression ratios and query speed.
* **Unified tag namespace**: Flatten resource, scope, and metric tags into a single namespace. This simplification makes queries more straightforward and enables faster dimensional filtering. You don’t need to remember which tags came from which scope.
* **Unit normalization**: Convert the `unit` attribute to `otel.metric.unit` for consistent handling across all metric types.
* **Histogram handling**: Assume equal-width histograms and don’t preserve histogram metadata. This trade-off supports the most common histogram analysis patterns (percentiles, distribution visualization) while reducing storage requirements.
These design choices reflect real-world metrics usage patterns. If your use case requires capabilities not currently supported, [contact Axiom](https://axiom.co/contact) to discuss your requirements. Your feedback helps shape MetricsDB’s evolution.
## Design choices and constraints
MetricsDB makes intentional architectural trade-offs to optimize for the most common metrics use cases while maintaining exceptional performance at scale.
### Query scope
You can query one dataset per query.
### Supported data types
MetricsDB focuses on the core OpenTelemetry metric types that cover the vast majority of observability scenarios.
Axiom supports the following OpenTelemetry metric types:
* **Gauge**: Point-in-time measurements. For example, CPU usage or temperature.
* **Histogram**: Distribution of values with configurable buckets. For example, request latency.
* **Sum**: Sum of values. For example, request count.
* **Summary**: Summary of values. For example, request latency.
Axiom doesn’t currently support the following data types:
* Exponential histograms
* `bytes`, `kvlist`, and `array` tag value types
* Exemplar, baggage, and context data
* Nanosecond-precision timestamps
### Data model optimizations
MetricsDB applies the following transformations to improve query performance and reduce storage costs:
* **Timestamp precision**: Truncate nanosecond timestamps to second precision. MetricsDB is built for use cases where second-level granularity is sufficient, and this optimization significantly improves compression ratios and query speed.
* **Unified tag namespace**: Flatten resource, scope, and metric tags into a single namespace. This simplification makes queries more straightforward and enables faster dimensional filtering. You don’t need to remember which tags came from which scope.
* **Unit normalization**: Convert the `unit` attribute to `otel.metric.unit` for consistent handling across all metric types.
* **Histogram handling**: Assume equal-width histograms and don’t preserve histogram metadata. This trade-off supports the most common histogram analysis patterns (percentiles, distribution visualization) while reducing storage requirements.
These design choices reflect real-world metrics usage patterns. If your use case requires capabilities not currently supported, [contact Axiom](https://axiom.co/contact) to discuss your requirements. Your feedback helps shape MetricsDB’s evolution.