> ## Documentation Index
> Fetch the complete documentation index at: https://axiom.co/docs/llms.txt
> Use this file to discover all available pages before exploring further.
# Stream data with Axiom
> The Stream tab enables you to process and analyze high volumes of high-velocity data from a variety of sources in real time.
The Stream tab allows you to inspect individual events and watch as they’re ingested live.
It can be incredibly useful to be able to live-stream events as they’re ingested to know what’s going on in the context of the entire system. Like a supercharged terminal, the Stream tab in Axiom allows you to view streams of events, filter them to only see important information, and finally inspect each individual event.
This section introduces the Stream tab and its components that unlock powerful insights from your data.
## Choose a dataset
The default view is one where you can easily see which datasets are available and also see some recent saved queries in case you want to jump directly into a stream:
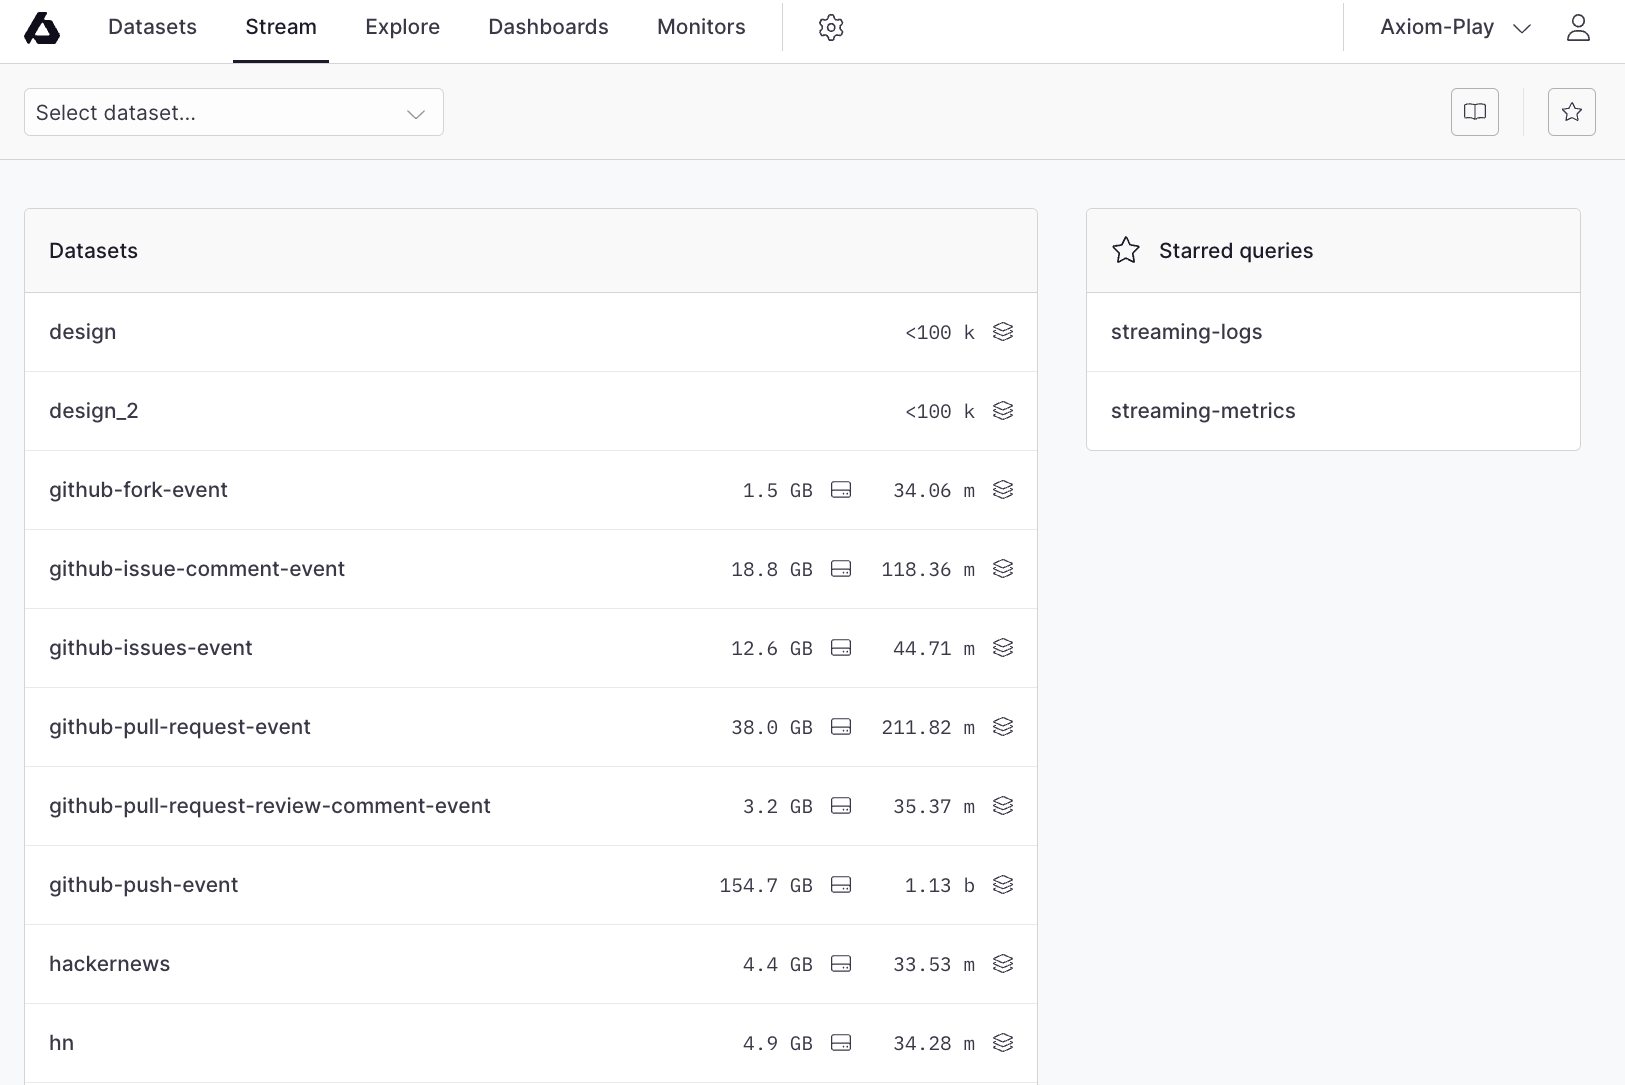 Select a dataset from the list of datasets to continue.
## Event stream
Upon selecting a dataset, you are immediately taken to the live event stream for that dataset:
Select a dataset from the list of datasets to continue.
## Event stream
Upon selecting a dataset, you are immediately taken to the live event stream for that dataset:
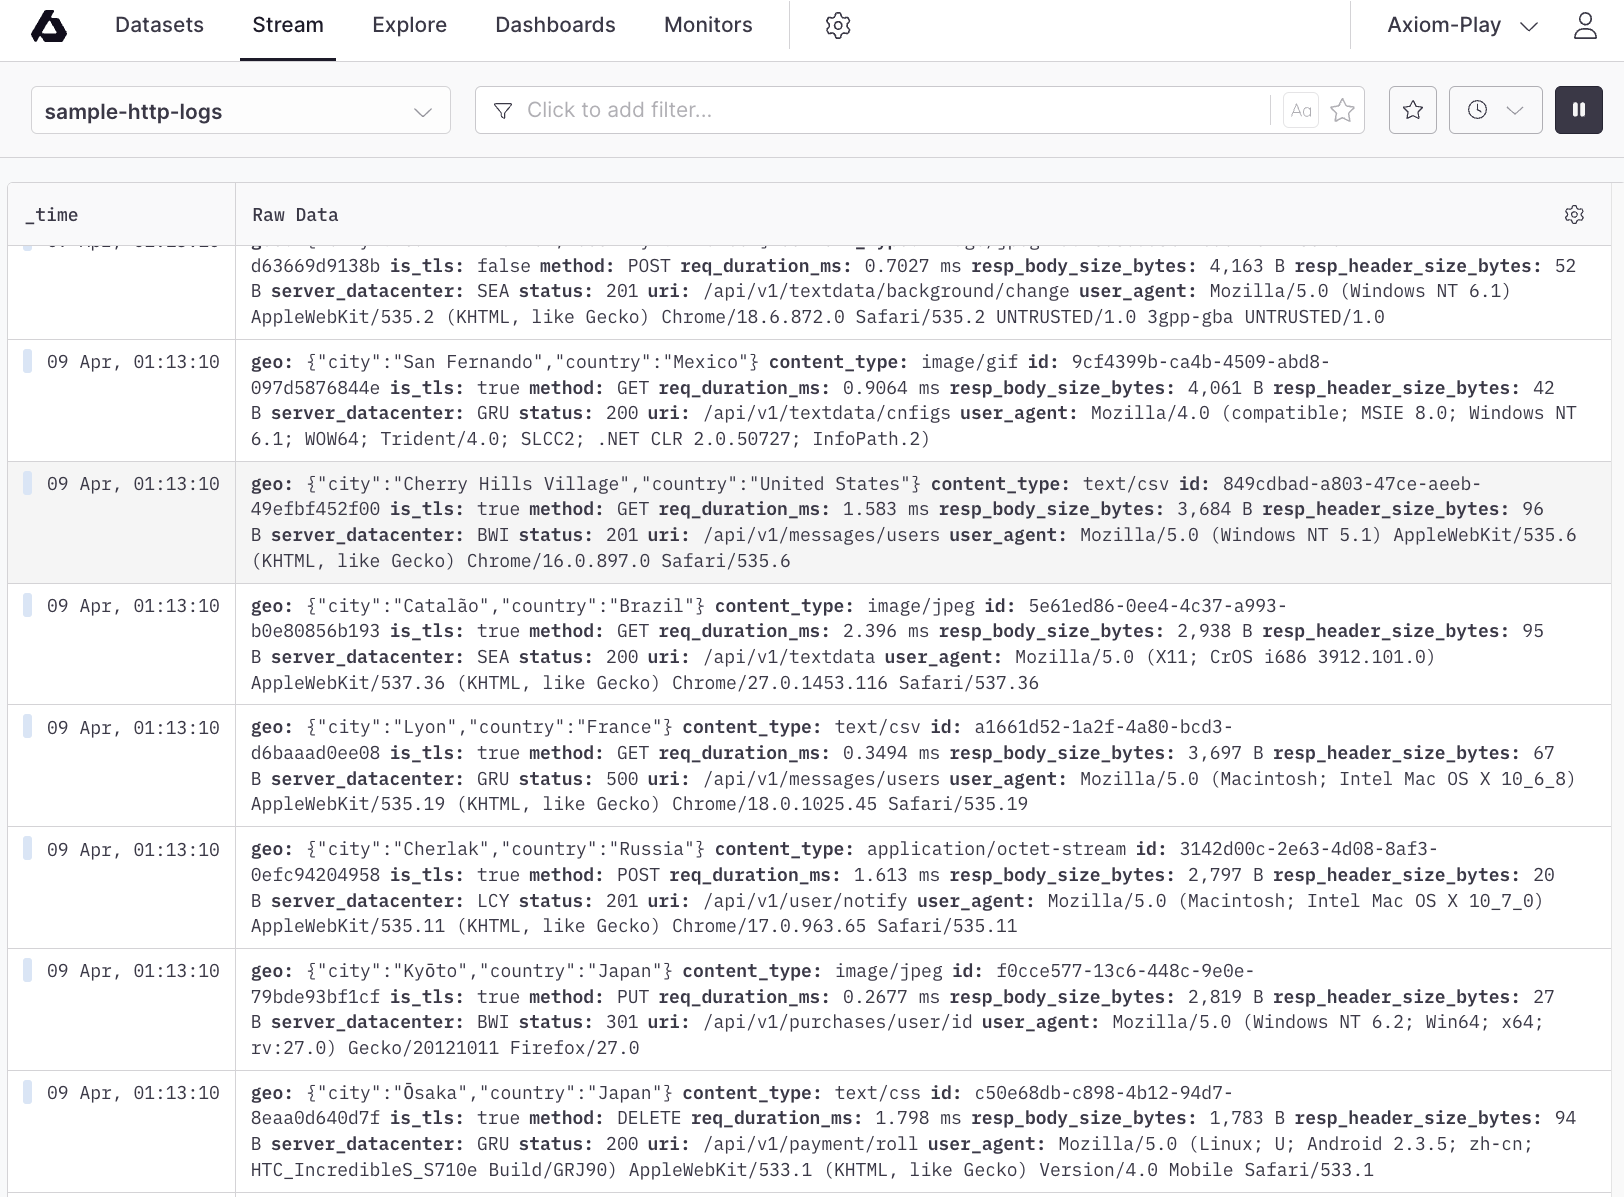 You can click an event to be taken to the event details slide-out:
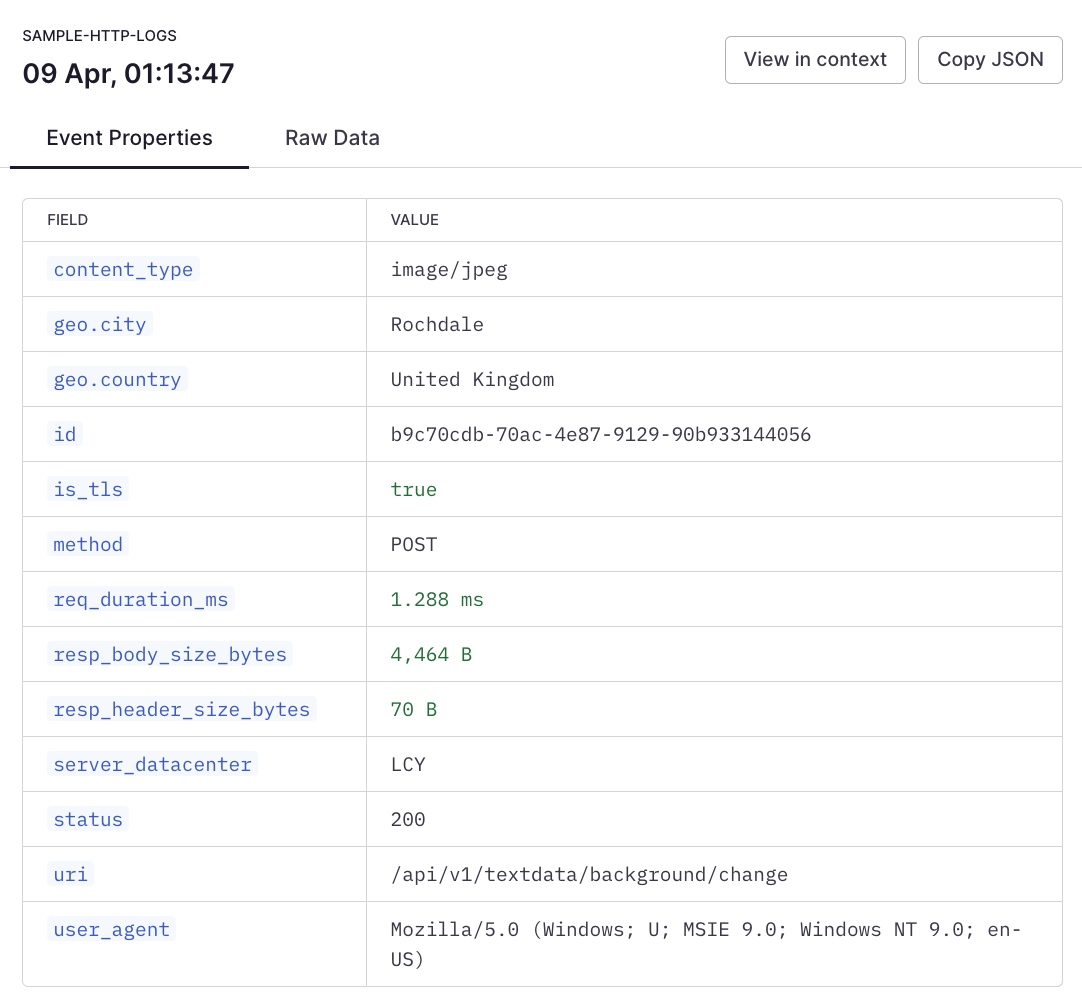 On this slide-out, you can copy individual field values, or copy the entire event as JSON.
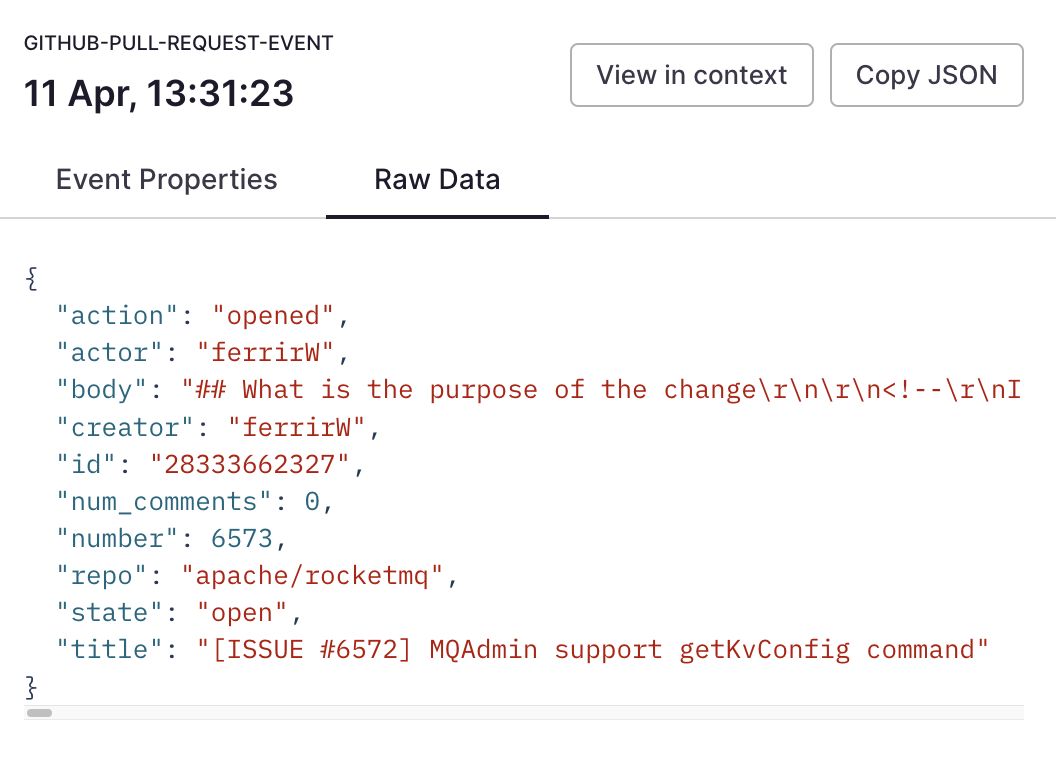
You can view and copy the raw data:
On this slide-out, you can copy individual field values, or copy the entire event as JSON.
You can view and copy the raw data:
 ## Filter data
The Stream tab provides access to a powerful filter builder right on the toolbar:
## Filter data
The Stream tab provides access to a powerful filter builder right on the toolbar:
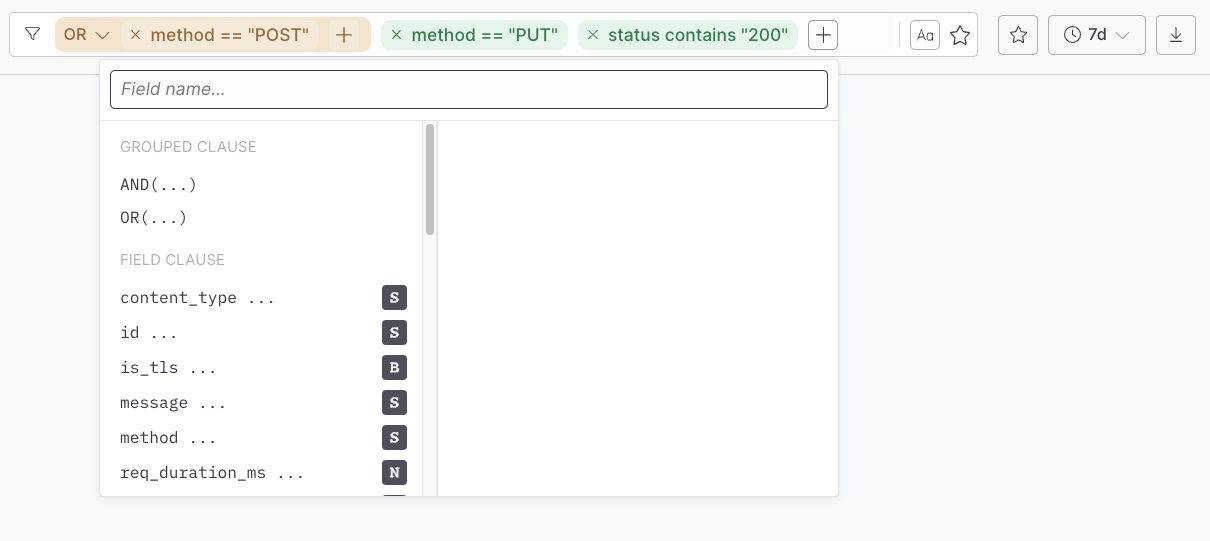 For more information, see the [filters documentation](/dashboard-elements/create#filters).
## Time range selection
The stream has two time modes:
* Live stream (default)
* Time range
Live stream continuously checks for new events and presents them in the stream.
Time range only shows events that fall between a specific start and end date. This can be useful when investigating an issue. The time range menu has some options to quickly choose some time ranges, or you can input a specific range for your search.
When you are ready to return to live streaming, click this button:
For more information, see the [filters documentation](/dashboard-elements/create#filters).
## Time range selection
The stream has two time modes:
* Live stream (default)
* Time range
Live stream continuously checks for new events and presents them in the stream.
Time range only shows events that fall between a specific start and end date. This can be useful when investigating an issue. The time range menu has some options to quickly choose some time ranges, or you can input a specific range for your search.
When you are ready to return to live streaming, click this button:
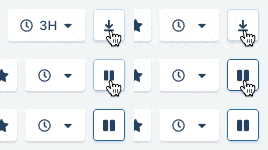 Click the button again to pause the stream.
## View settings
The Stream tab is customizable via the view settings menu:
Click the button again to pause the stream.
## View settings
The Stream tab is customizable via the view settings menu:
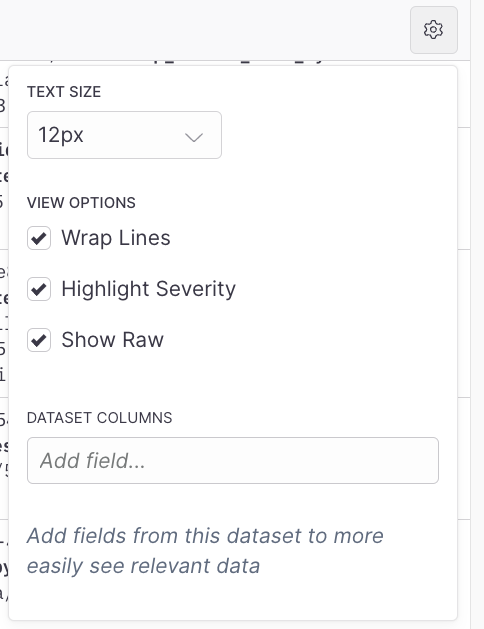 Options include:
* Text size used in the stream
* Wrap lines
* Highlight severity (this is automatically extracted from the event)
* Show the raw event details
* Fields to display in their own column
## Saved queries
The saved queries slide-out is activated via the toolbar:
Options include:
* Text size used in the stream
* Wrap lines
* Highlight severity (this is automatically extracted from the event)
* Show the raw event details
* Fields to display in their own column
## Saved queries
The saved queries slide-out is activated via the toolbar:
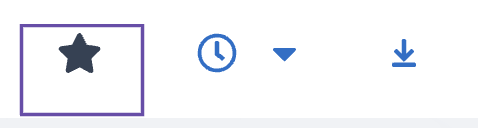 For more information, see [Saved queries](/query-data/datasets#saved-queries).
## Highlight severity
The Stream tab allows you to easily detect warnings and errors in your logs by highlighting the severity of log entries in different colors.
To highlight the severity of log entries:
1. Specify the log level in the data you send to Axiom. For more information, see [Requirements for log level fields](/reference/limits#requirements-for-log-level-fields).
2. In the Stream tab, click in the top right, and then select **Highlight severity**.
As a result, Axiom automatically searches for the words `warn` and `error` in the keys of the fields mentioned in Step 1, and then displays warnings in orange and errors in red.
For more information, see [Saved queries](/query-data/datasets#saved-queries).
## Highlight severity
The Stream tab allows you to easily detect warnings and errors in your logs by highlighting the severity of log entries in different colors.
To highlight the severity of log entries:
1. Specify the log level in the data you send to Axiom. For more information, see [Requirements for log level fields](/reference/limits#requirements-for-log-level-fields).
2. In the Stream tab, click in the top right, and then select **Highlight severity**.
As a result, Axiom automatically searches for the words `warn` and `error` in the keys of the fields mentioned in Step 1, and then displays warnings in orange and errors in red.