LLM observability
Learn how to observe your generative AI apps in production using OpenTelemetry instrumentation and Axiom's auto-provisioned GenAI dashboards.
Axiom provides first-class observability for generative AI applications. Instrument your app using OpenTelemetry and Axiom automatically provisions a GenAI dashboard and waterfall trace view for every dataset containing AI telemetry.
Instrument your app
Axiom offers the following approaches to capture generative AI telemetry:
| Instrumentation approach | Language support | Characteristics |
|---|---|---|
| Axiom AI SDK | TypeScript | Quick setup. Minimal code changes. |
| Manual | Any | More involved setup. Full control over instrumentation. |
Instrumentation with Axiom AI SDK is the right choice for you if you have a TypeScript app and you want the SDK to capture and send traces with the correct semantic conventions.
Manual instrumentation is the right choice for you if you want to use your own tooling or if you use a language other than TypeScript. You need to instrument your app manually to emit traces compatible with Axiom’s LLM observability features.
Both approaches emit identical attributes. This means that all the telemetry analysis features work the same way.
Visualize traces in Console
Visualizing and making sense of this telemetry data is a core part of the Axiom Console experience:
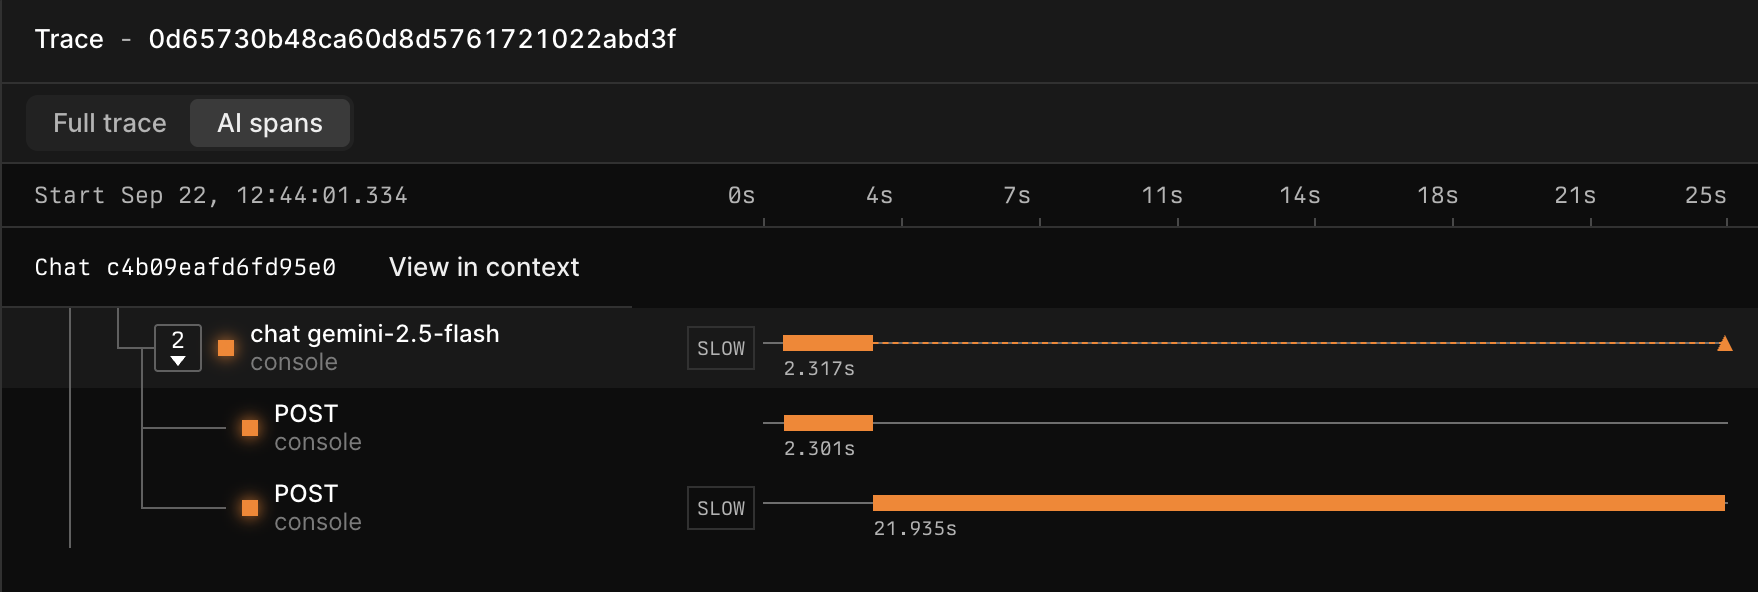
- A dedicated AI traces waterfall view visualizes single and multi-step LLM workflows, with clear input/output inspection at each stage.
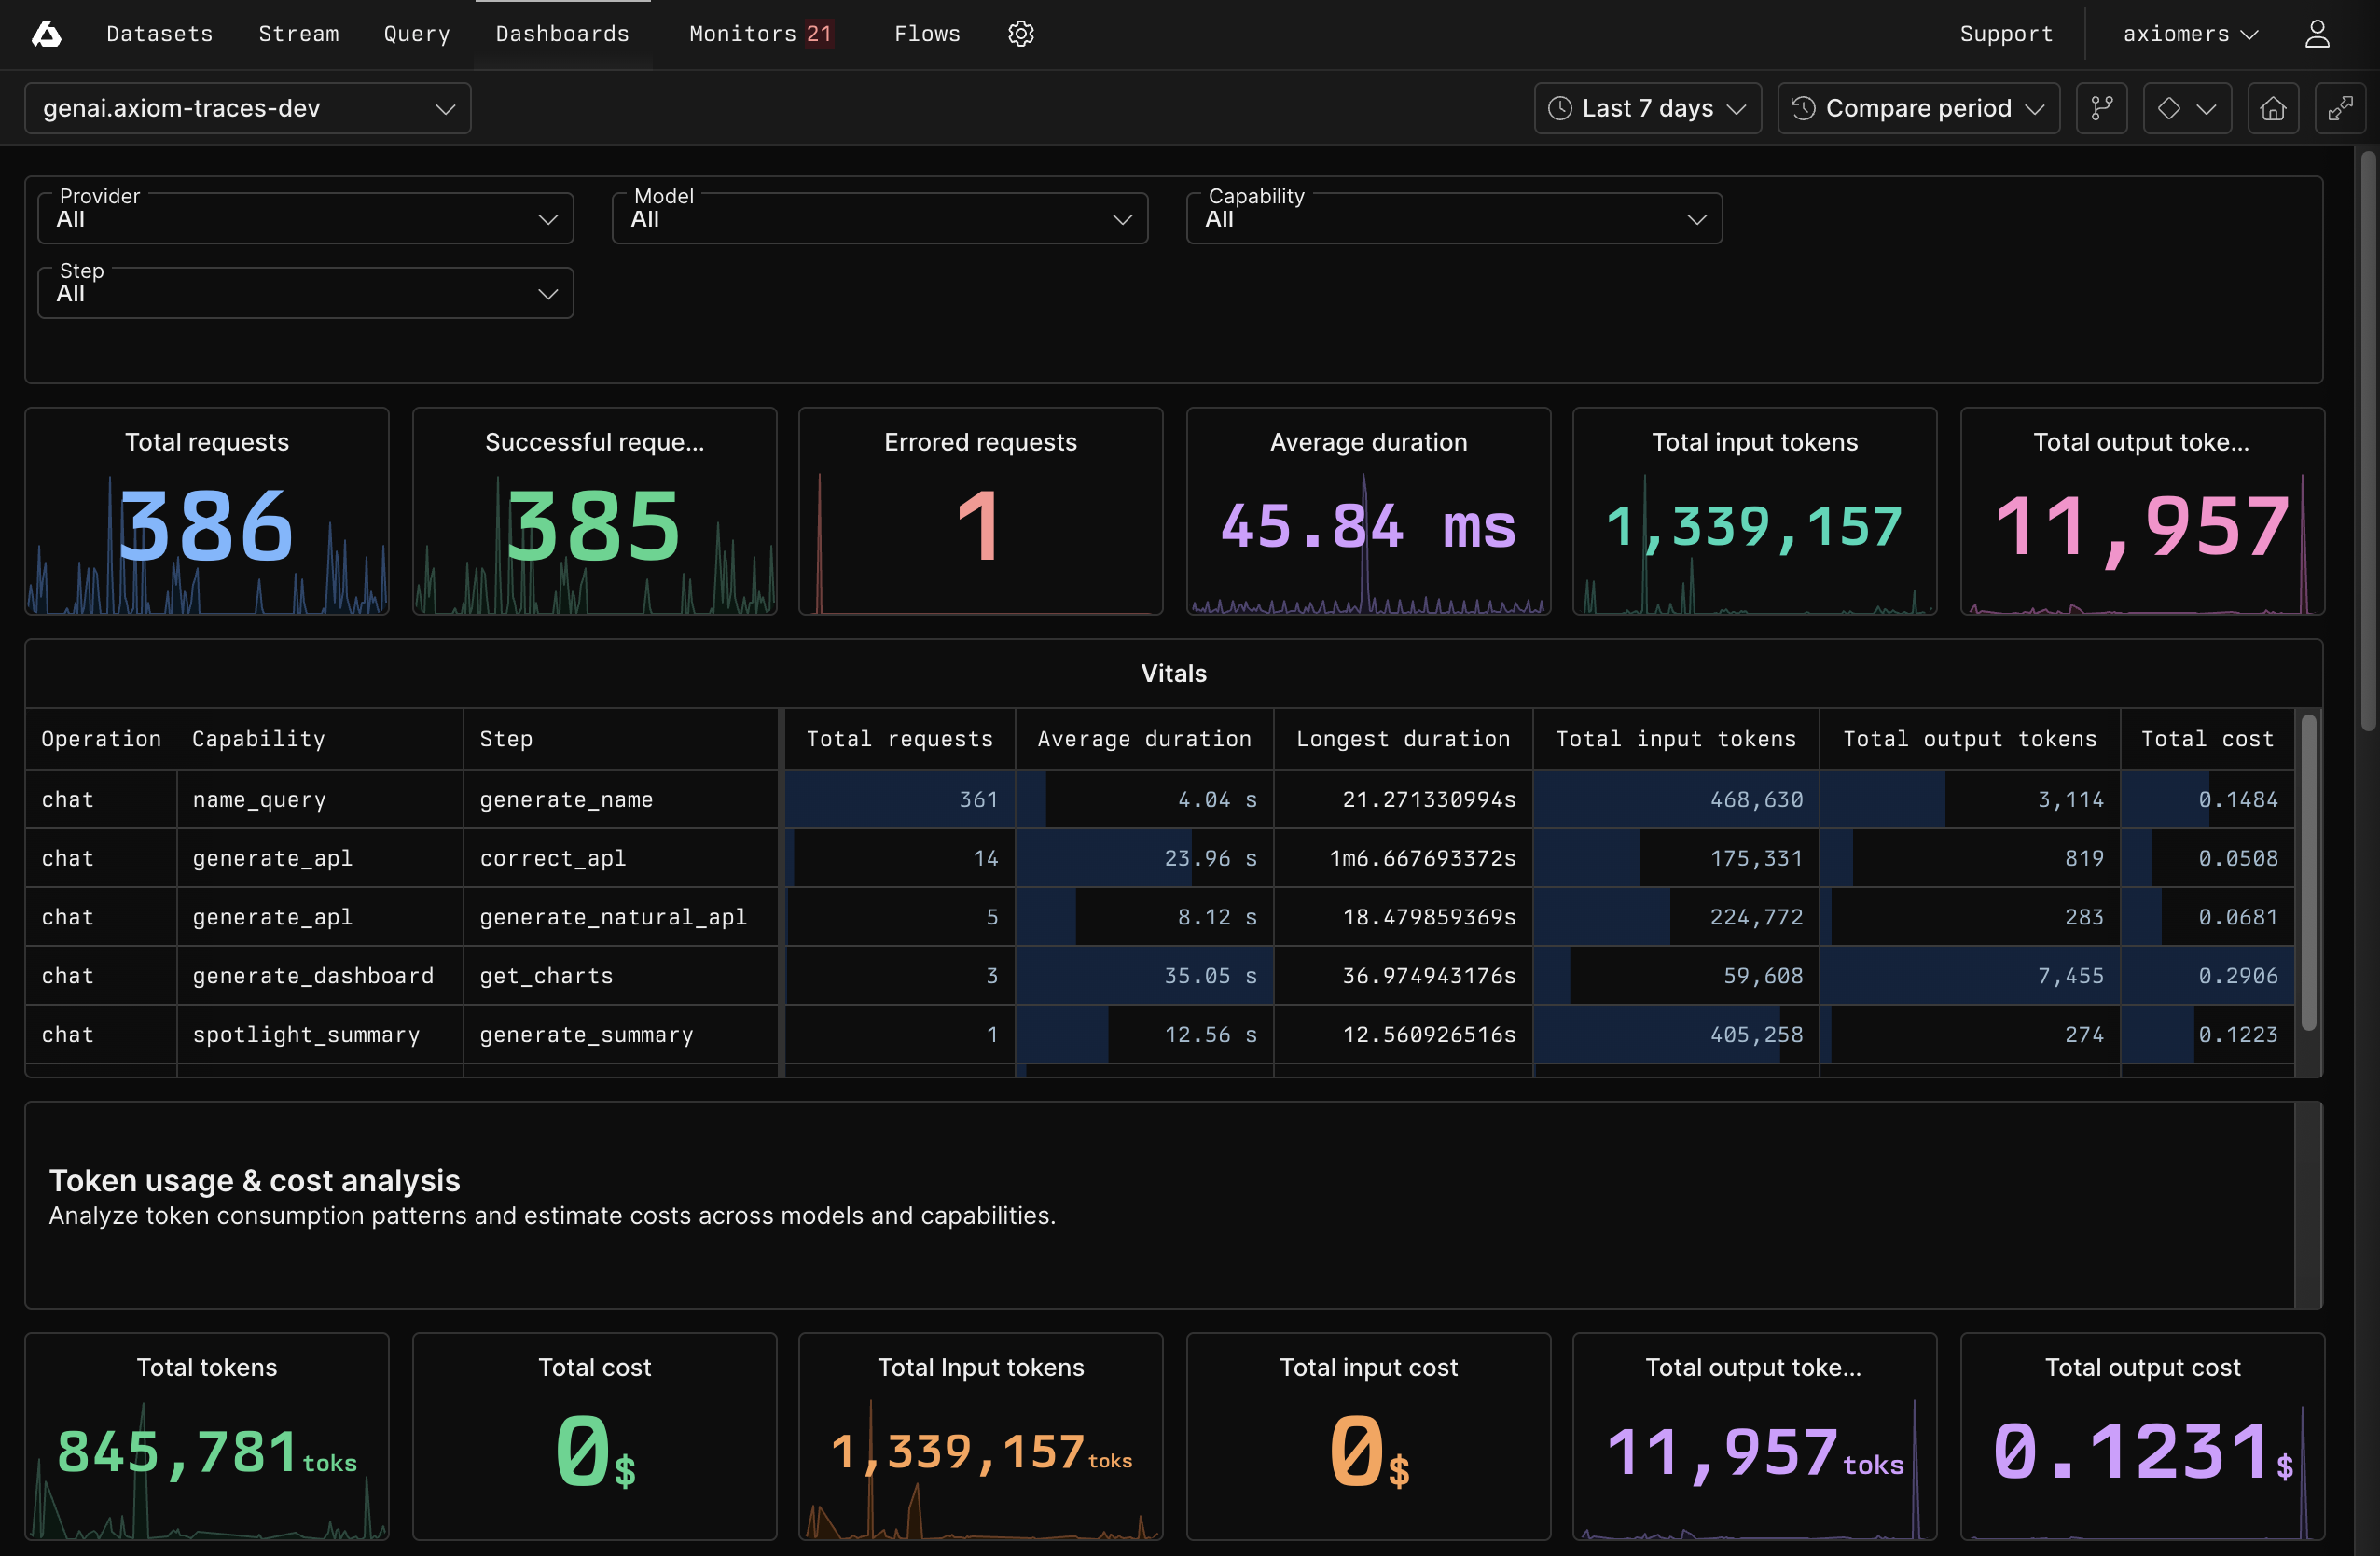
- A pre-built GenAI OTel dashboard automatically appears for any dataset receiving AI telemetry. It features elements for tracking cost per invocation, time-to-first-token, call counts by model, and error rates.
Access AI traces waterfall view
-
Click the Query tab.
-
Create an APL query about your GenAI dataset. For example:
-
In the list of trace IDs, click the trace you want to explore.
-
Explore how spans within the trace are related to each other in the waterfall view. To only display AI spans, click AI spans in the top left.
Access GenAI dashboard
Axiom automatically creates the GenAI dashboard if the field attributes.gen_ai.operation.name is present in your data.
To access the GenAI dashboard:
- Click the Dashboards tab.
- Click the dashboard Generative AI Overview (DATASET_NAME) where
DATASET_NAMEis the name of your GenAI dataset.
The GenAI dashboard provides you with important insights about your GenAI app such as:
- Vitals about requests, broken down by operation, capability, and step.
- Token usage and cost analysis
- Error analysis
- Comparison of performance and reliability of different AI models
What’s next?
- Use GenAI APL functions to query and analyze your LLM data.
- See GenAI attributes for the full list of OpenTelemetry attributes Axiom recognizes.