Send OpenTelemetry data from a Python app to Axiom
This guide explains how to send OpenTelemetry data from a Python app to Axiom using the Python OpenTelemetry SDK.
This guide explains how to send OpenTelemetry data from a Python app to Axiom using the Python OpenTelemetry SDK.
Prerequisites
Prerequisites
- Create an Axiom account.
- Create a dataset in Axiom where you send your data.
- Create an API token in Axiom with permissions to ingest data to the dataset you have created.
- Install Python version 3.7 or higher.
Install required dependencies
To install the required Python dependencies, run the following code in your terminal:
Install dependencies with requirements file
Alternatively, if you use a requirements.txt file in your Python project, add these lines:
Then run the following code in your terminal to install dependencies:
Create an app.py file
Create an app.py file with the following content. This file creates a basic HTTP server using Flask. It also demonstrates the usage of span links to establish relationships between spans across different traces.
Create an exporter.py file
Create an exporter.py file with the following content. This file establishes an OpenTelemetry configuration and sets up an exporter that sends trace data to Axiom.
For more information on the libraries imported by the exporter.py file, see the Reference below.
Run the app
Run the following code in your terminal to run the Python project:
macOS/Linux
Windows
In your browser, go to http://127.0.0.1:8080/rolldice to interact with your Python app. Each time you load the page, the app displays a random number and sends the collected traces to Axiom.
Observe the telemetry data in Axiom
In Axiom, go the Stream tab and click your dataset. This page displays the traces sent to Axiom and enables you to monitor and analyze your app’s performance and behavior.
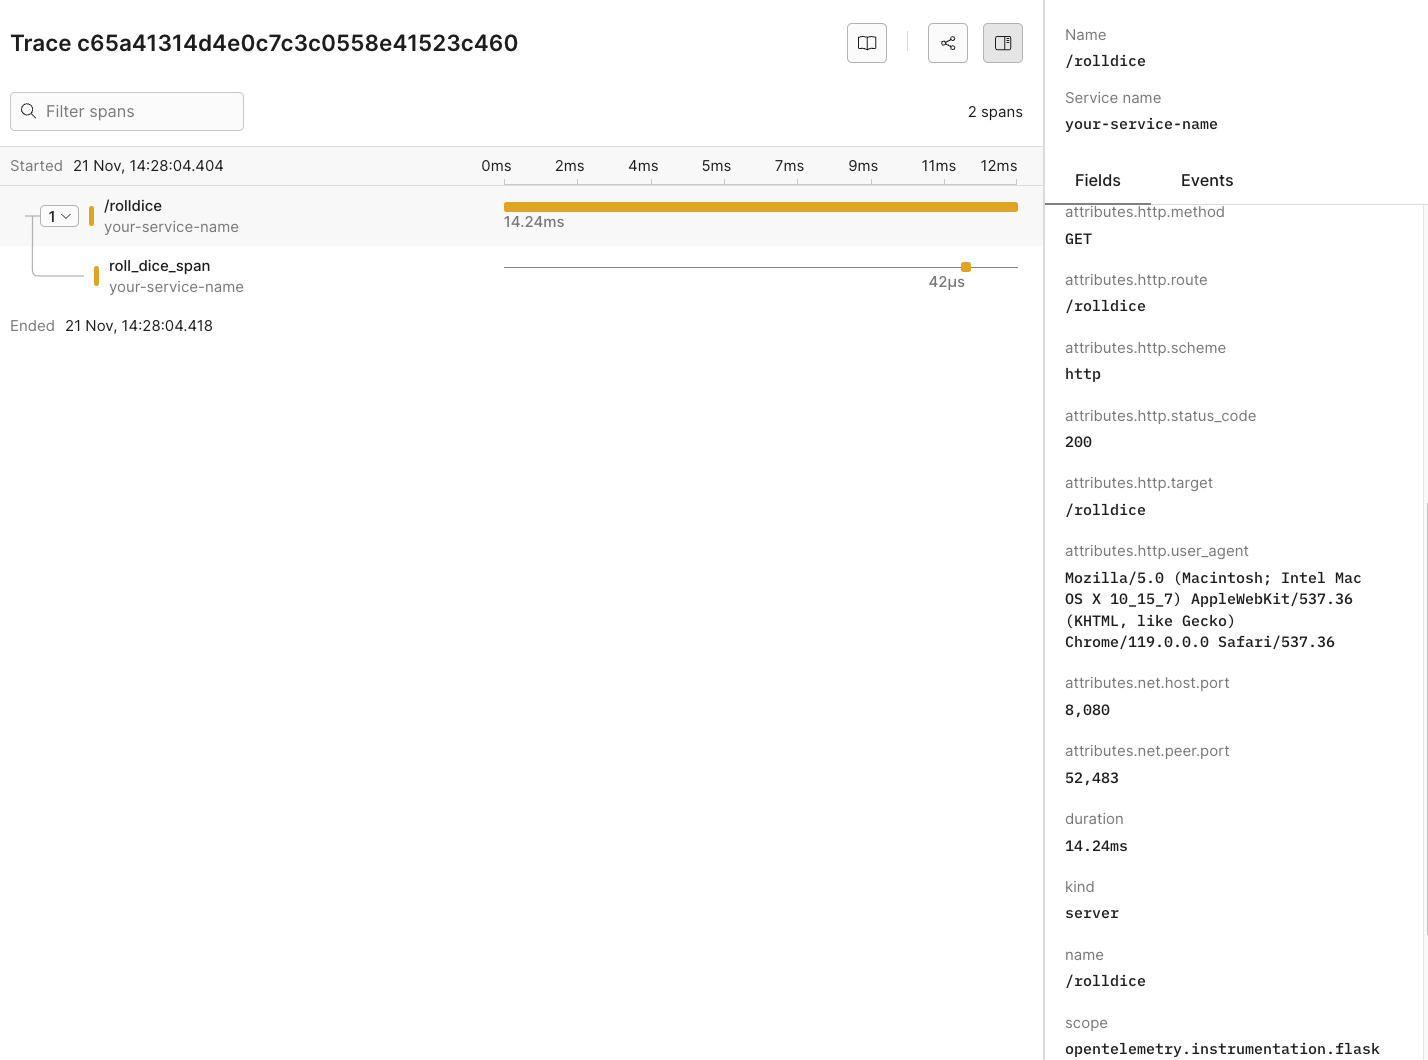
Dynamic OpenTelemetry traces dashboard
In Axiom, go the Dashboards tab and click OpenTelemetry Traces (python). This pre-built traces dashboard provides further insights into the performance and behavior of your app.
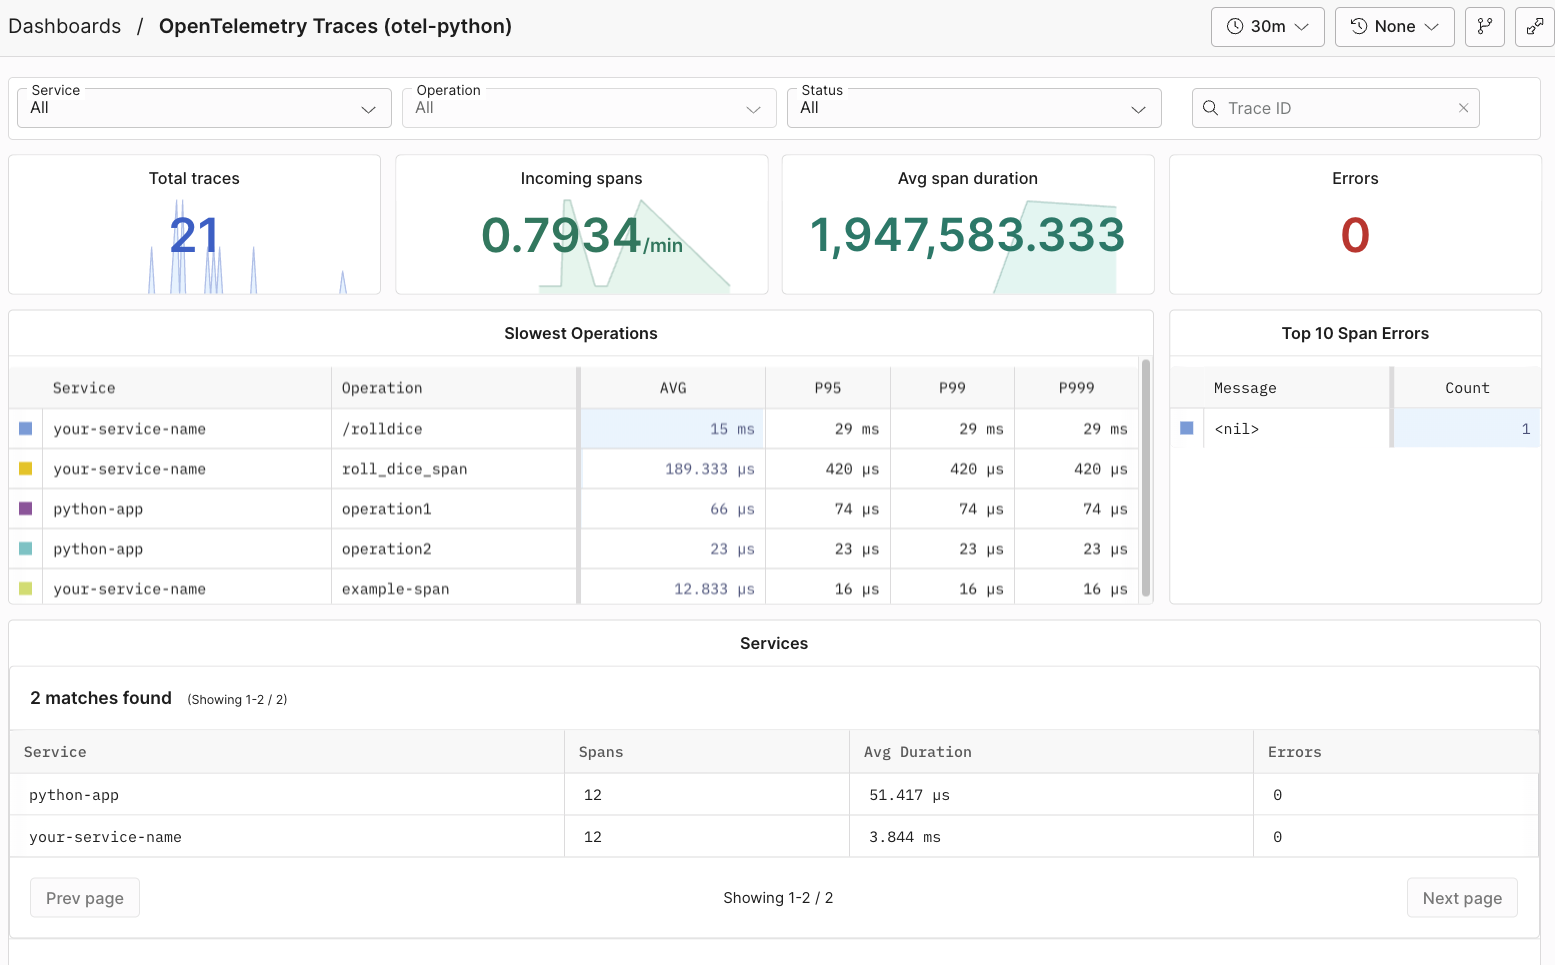
Send data from an existing Python project
Manual instrumentation
Manual instrumentation in Python with OpenTelemetry involves adding code to create and manage spans around the blocks of code you want to trace. This approach allows for precise control over the trace data.
-
Import and configure a tracer at the start of your main Python file. For example, use the tracer from the
exporter.pyconfiguration.python -
Enclose the code blocks in your app that you want to trace within spans. Start and end these spans in your code.
python -
Add relevant metadata and logs to your spans to enrich the trace data, providing more context for your data.
python
Automatic instrumentation
Automatic instrumentation in Python with OpenTelemetry simplifies the process of adding telemetry data to your app. It uses pre-built libraries that automatically instrument the frameworks and libraries.
-
Install the OpenTelemetry packages designed for specific frameworks like Flask or Django.
shell -
Configure your app to use these libraries that automatically generate spans for standard operations.
python
After you set them up, these libraries automatically trace relevant operations without additional code changes in your app.
Reference
List of OpenTelemetry trace fields
| Field Category | Field Name | Description |
|---|---|---|
| Unique Identifiers | ||
| _rowid | Unique identifier for each row in the trace data. | |
| span_id | Unique identifier for the span within the trace. | |
| trace_id | Unique identifier for the entire trace. | |
| Timestamps | ||
| _systime | System timestamp when the trace data was recorded. | |
| _time | Timestamp when the actual event being traced occurred. | |
| HTTP Attributes | ||
| attributes.custom["http.host"] | Host information where the HTTP request was sent. | |
| attributes.custom["http.server_name"] | Server name for the HTTP request. | |
| attributes.http.flavor | HTTP protocol version used. | |
| attributes.http.method | HTTP method used for the request. | |
| attributes.http.route | Route accessed during the HTTP request. | |
| attributes.http.scheme | Protocol scheme (HTTP/HTTPS). | |
| attributes.http.status_code | HTTP response status code. | |
| attributes.http.target | Specific target of the HTTP request. | |
| attributes.http.user_agent | User agent string of the client. | |
| Network Attributes | ||
| attributes.net.host.port | Port number on the host receiving the request. | |
| attributes.net.peer.port | Port number on the peer (client) side. | |
| attributes.custom["net.peer.ip"] | IP address of the peer in the network interaction. | |
| Operational Details | ||
| duration | Time taken for the operation. | |
| kind | Type of span (for example,, server, client). | |
| name | Name of the span. | |
| scope | Instrumentation scope. | |
| service.name | Name of the service generating the trace. |
List of imported libraries
The exporter.py file imports the following libraries:
from opentelemetry import trace
This module creates and manages trace data in your app. It creates spans and tracers which track the execution flow and performance of your app.
from opentelemetry.sdk.trace import TracerProvider
TracerProvider acts as a container for the configuration of your app’s tracing behavior. It allows you to define how spans are generated and processed, essentially serving as the central point for managing trace creation and propagation in your app.
from opentelemetry.sdk.trace.export import BatchSpanProcessor
BatchSpanProcessor is responsible for batching spans before they're exported. This is an important aspect of efficient trace data management as it aggregates multiple spans into fewer network requests, reducing the overhead on your app’s performance and the tracing backend.
from opentelemetry.sdk.resources import Resource, SERVICE_NAME
The Resource class is used to describe your app’s service attributes, such as its name, version, and environment. This contextual information is attached to the traces and helps in identifying and categorizing trace data, making it easier to filter and analyze in your monitoring setup.
from opentelemetry.exporter.otlp.proto.http.trace_exporter import OTLPSpanExporter
The OTLPSpanExporter is responsible for sending your app’s trace data to a backend that supports the OTLP such as Axiom. It formats the trace data according to the OTLP standards and transmits it over HTTP, ensuring compatibility and standardization in how telemetry data is sent across different systems and services.