- Deployments
- Server outages
- Incidents
- Feature flags
Prerequisites
- Create an Axiom account.
- Create a dataset in Axiom where you send your data.
- Send data to your Axiom dataset.
- Create an API token in Axiom with permissions to create, read, update, and delete annotations.
Create annotations
Create annotations in one of the following ways: If you use the Axiom Vercel integration, annotations are automatically created for deployments. Axiom automatically creates an annotation if a monitor triggers.Create annotations with GitHub Actions
You can configure GitHub Actions using YAML syntax. For more information, see the GitHub documentation. To create an annotation when a deployment happens in GitHub, add the following to the end of your GitHub Action file:Replace
API_TOKEN with the Axiom API token you have generated. For added security, store the API token in an environment variable.Replace DATASET_NAME with the name of the Axiom dataset where you send your data.Create annotations using Axiom API
To create an annotation using the Axiom API, use the following API request:Replace
API_TOKEN with the Axiom API token you have generated. For added security, store the API token in an environment variable.Replace DATASET_NAME with the name of the Axiom dataset where you send your data.id field. This is the annotation ID that you can later use to change or delete the annotation.
Get information about annotations
To get information about all datasets in your org, use the following API request:Replace
API_TOKEN with the Axiom API token you have generated. For added security, store the API token in an environment variable.startis an ISO timestamp that specifies the beginning of the time interval.endis an ISO timestamp that specifies the end of the time interval.datasetsis the list of datasets whose annotations you want to get information about. Separate datasets by commas, for exampledatasets=my-dataset1,my-dataset2.
my-dataset:
id field. This is the annotation ID that you can later use to change or delete the annotation. For more information on the other fields, see Annotation object.
To get information about a specific annotation, use the following API request:
Replace
ANNOTATION_ID with the ID of the annotation.Replace API_TOKEN with the Axiom API token you have generated. For added security, store the API token in an environment variable.Change annotations
To change an existing annotation, use the following API request:Replace
ANNOTATION_ID with the ID of the annotation. For more information about how to determine the annotation ID, see Get information about annotations.Replace API_TOKEN with the Axiom API token you have generated. For added security, store the API token in an environment variable.In the payload, specify the properties of the annotation that you want to change. The example above adds an endTime field to the annotation created above. For more information on the allowed fields, see Annotation object.Delete annotations
To delete an existing annotation, use the following API request:Replace
ANNOTATION_ID with the ID of the annotation. For more information about how to determine the annotation ID, see Get information about annotations.Replace API_TOKEN with the Axiom API token you have generated. For added security, store the API token in an environment variable.Annotation object
Annotations are represented as objects with the following fields:datasetsis the list of dataset names for which the annotation appears on charts.idis the unique ID of the annotation.descriptionis an explanation of the event the annotation marks on the charts.timeis an ISO timestamp value that specifies the time the annotation marks on the charts.titleis a summary of the annotation that appears on the charts.typeis the type of the event marked by the annotation. For example, production deployment.urlis the URL relevant for the event marked by the annotation. For example, link to GitHub pull request.- Optional:
endTimeis an ISO timestamp value that specifies the end time of the annotation.
Show and hide annotations on dashboards
To show and hide annotations on a dashboard, follow these steps:- Go to the dashboard where you see annotations. For example, the prebuilt Vercel dashboard automatically shows annotations about deployments.
- Click Toggle annotations.
- Select the datasets whose annotations you want to display on the charts.
Example use case
The example below demonstrates how annotations help you troubleshoot issues in your app or system. Your monitor alerts you about rising form submission errors. You explore this trend and when it started. Right before form submission errors started rising, you see an annotation about a deployment of a new feature to the form. You make the hypothesis that the deployment is the reason for the error and decide to investigate the code changes it introduced.Create annotation
Use the following API request to create an annotation:Replace
API_TOKEN with the Axiom API token you have generated. For added security, store the API token in an environment variable.Create a monitor
In this example, you set up a monitor that alerts you when the number of form submission errors rises. For more information on creating a monitor, see Monitoring and Notifiers.Explore trends
Suppose your monitor sends you a notification about rising form submission errors. You decide to investigate and run a query to display the number of form submission errors over time. Ensure you select a time range that includes the annotation. You get a chart similar to the example below displaying form submission errors and annotations about the time of important events such as deployments.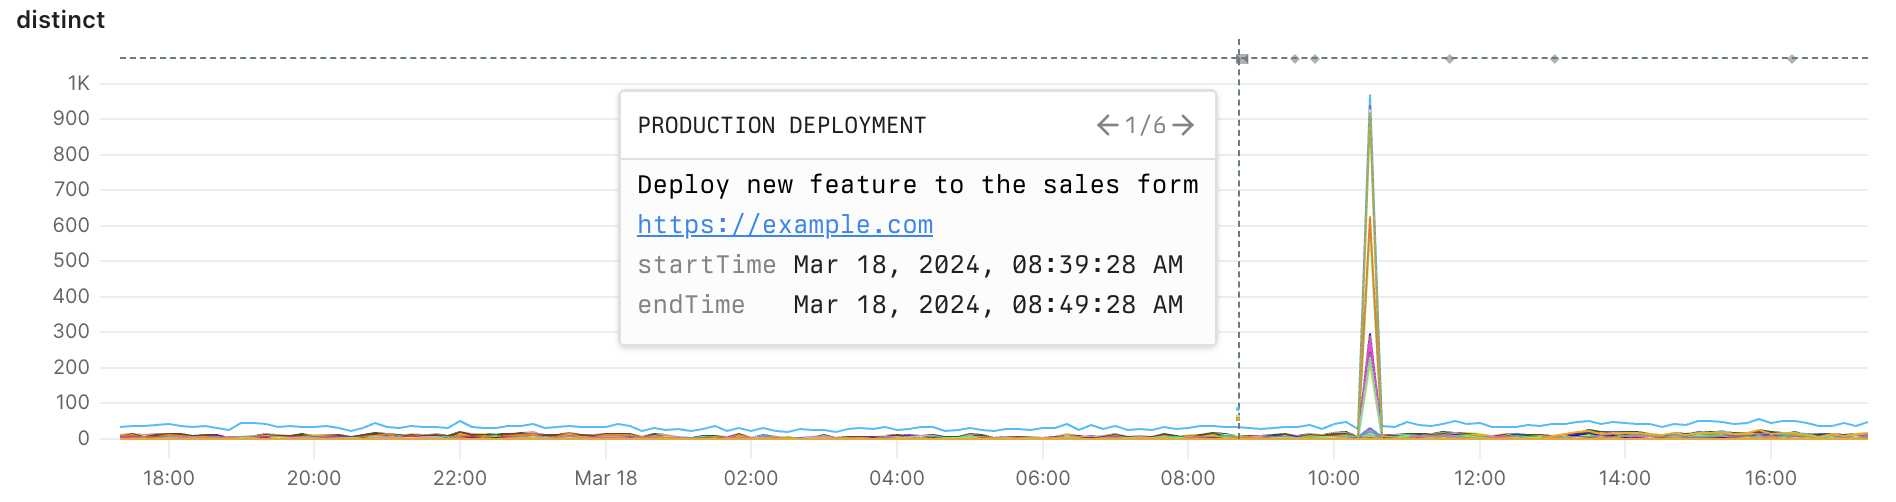
Inspect issue
- From the chart, you see that the number of errors started to rise after the deployment of a new feature to the sales form. This correlation allows you to form the hypothesis that the errors might be caused by the deployment.
- You decide to investigate the deployment by clicking on the link associated with the annotation. The link takes you to the GitHub pull request.
- You inspect the code changes in depth and discover the cause of the errors.
- You quickly fix the issue in another deployment.