We've released user feedback capture for AI engineering, made it easier to visualize metrics data, and added support for exporting query results in formats that work better with your workflows.
User feedback for AI engineering
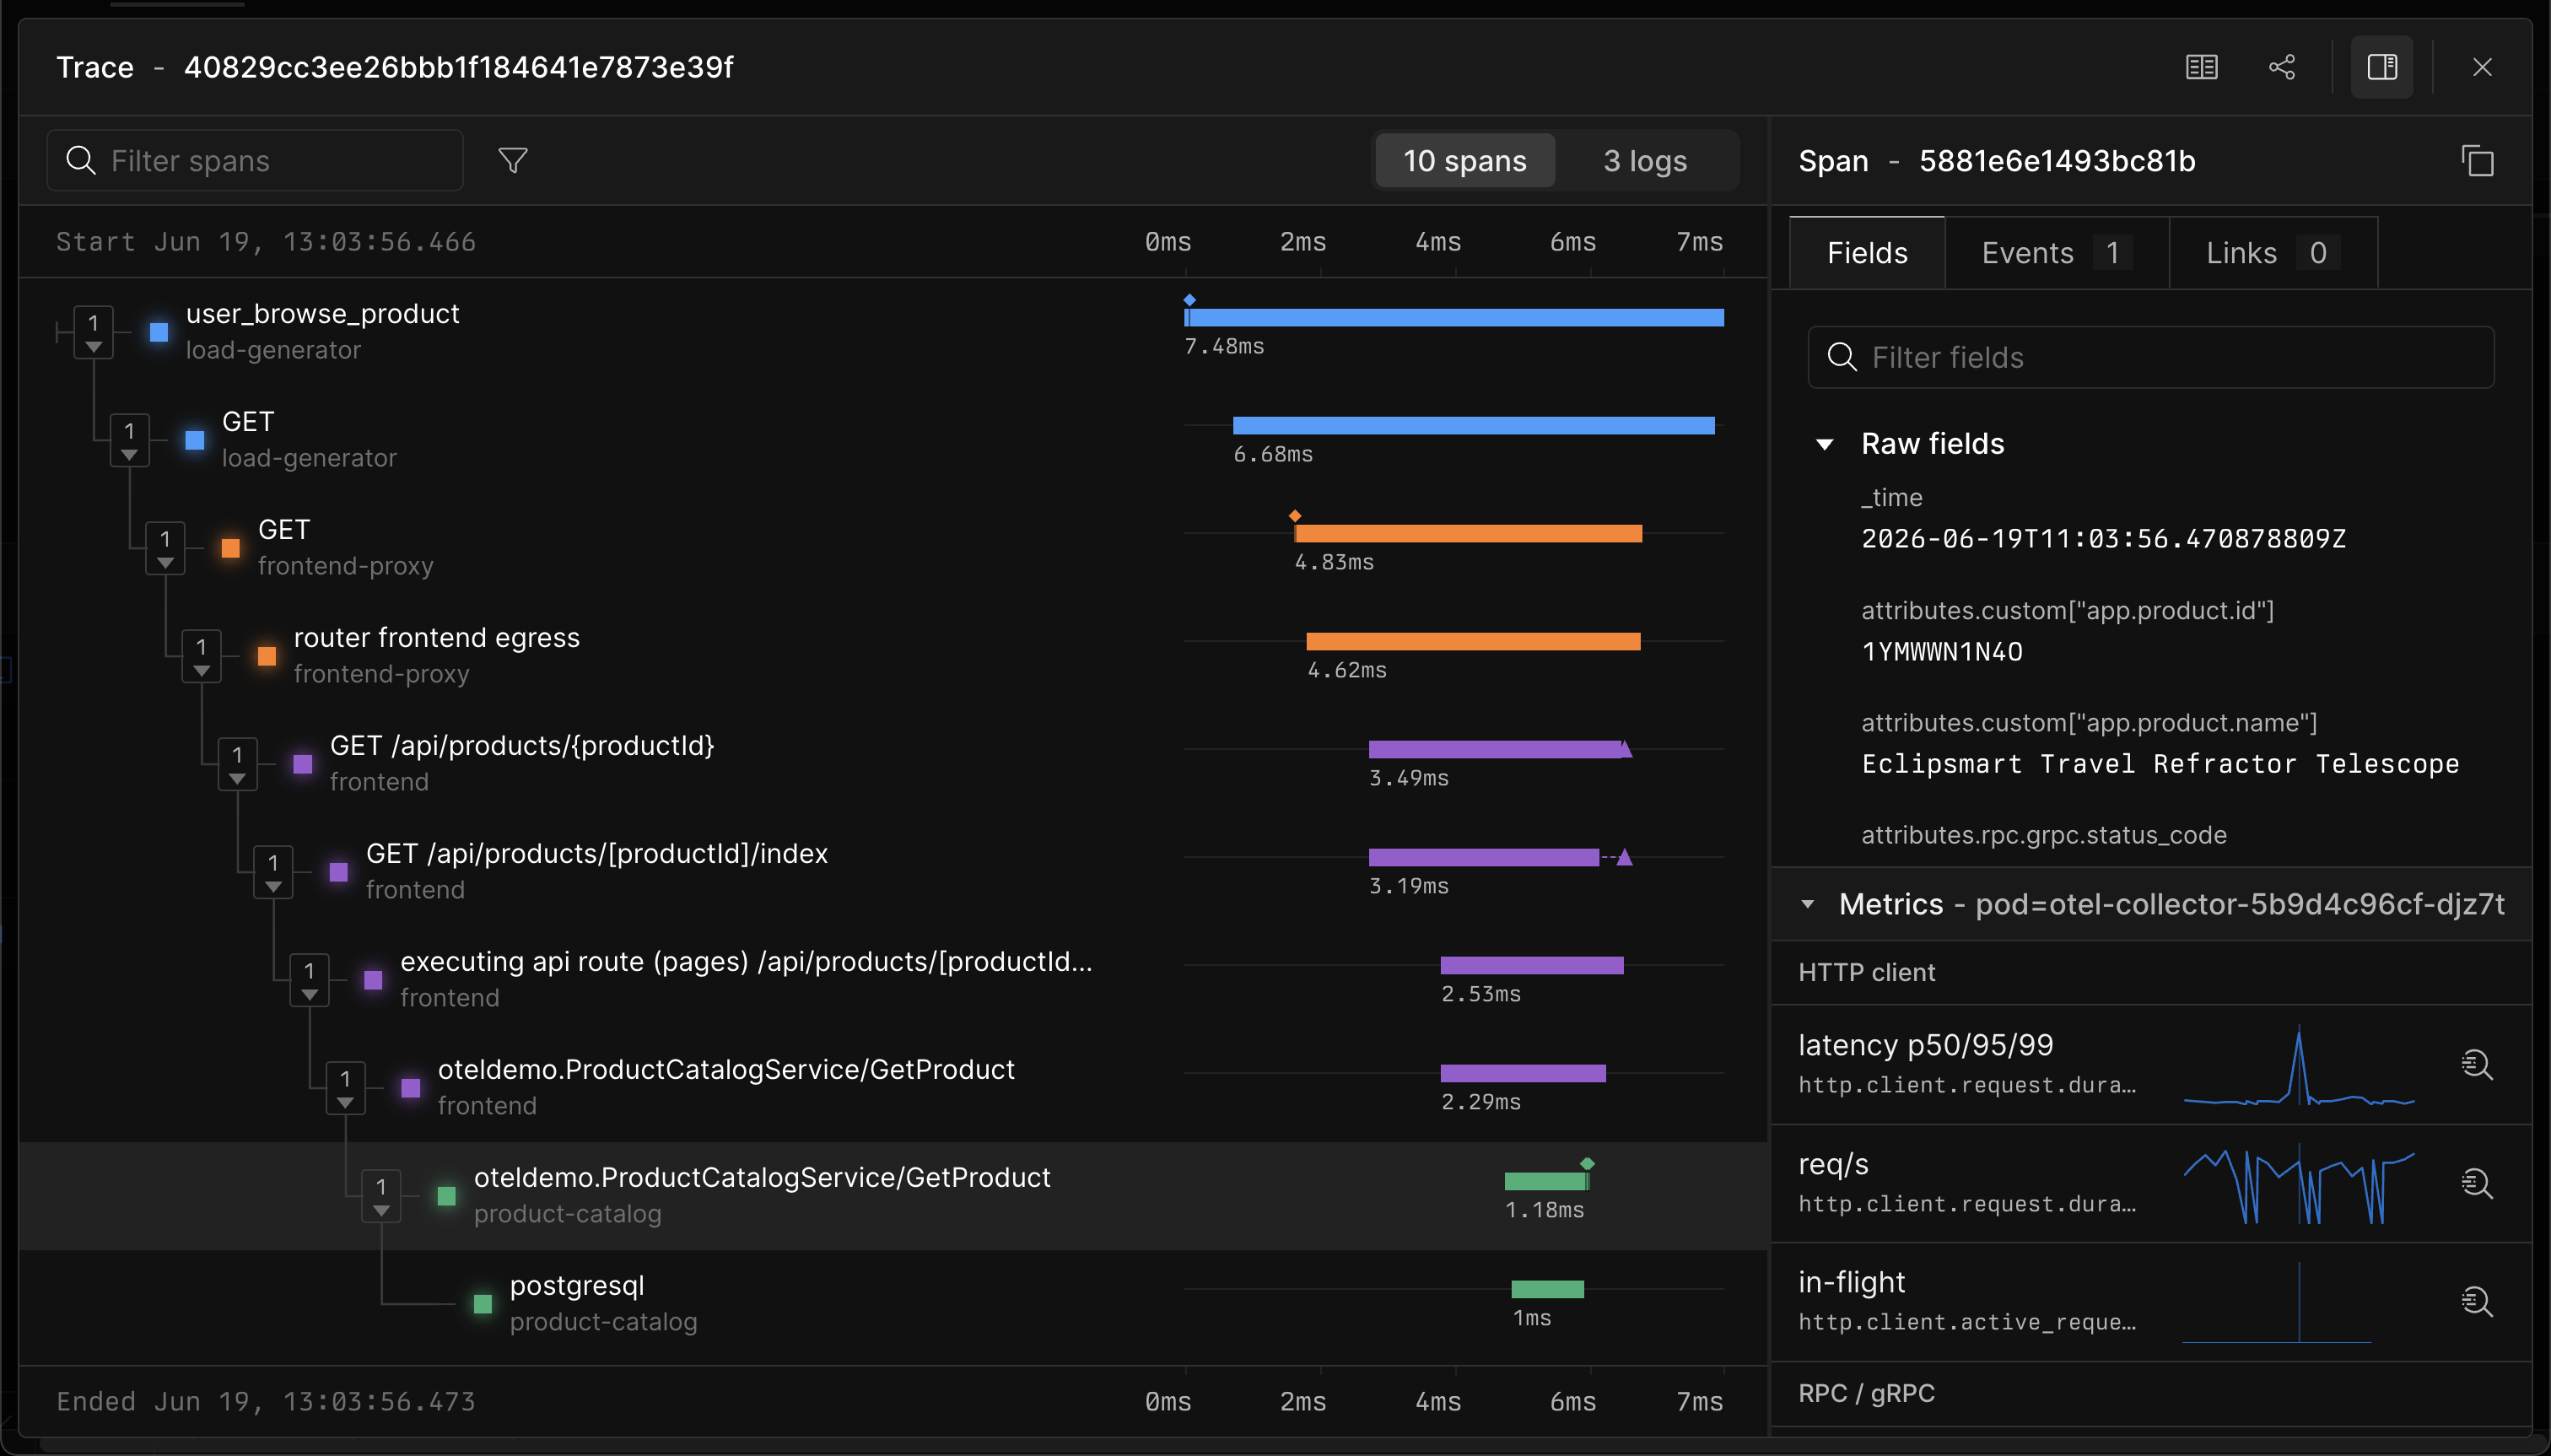
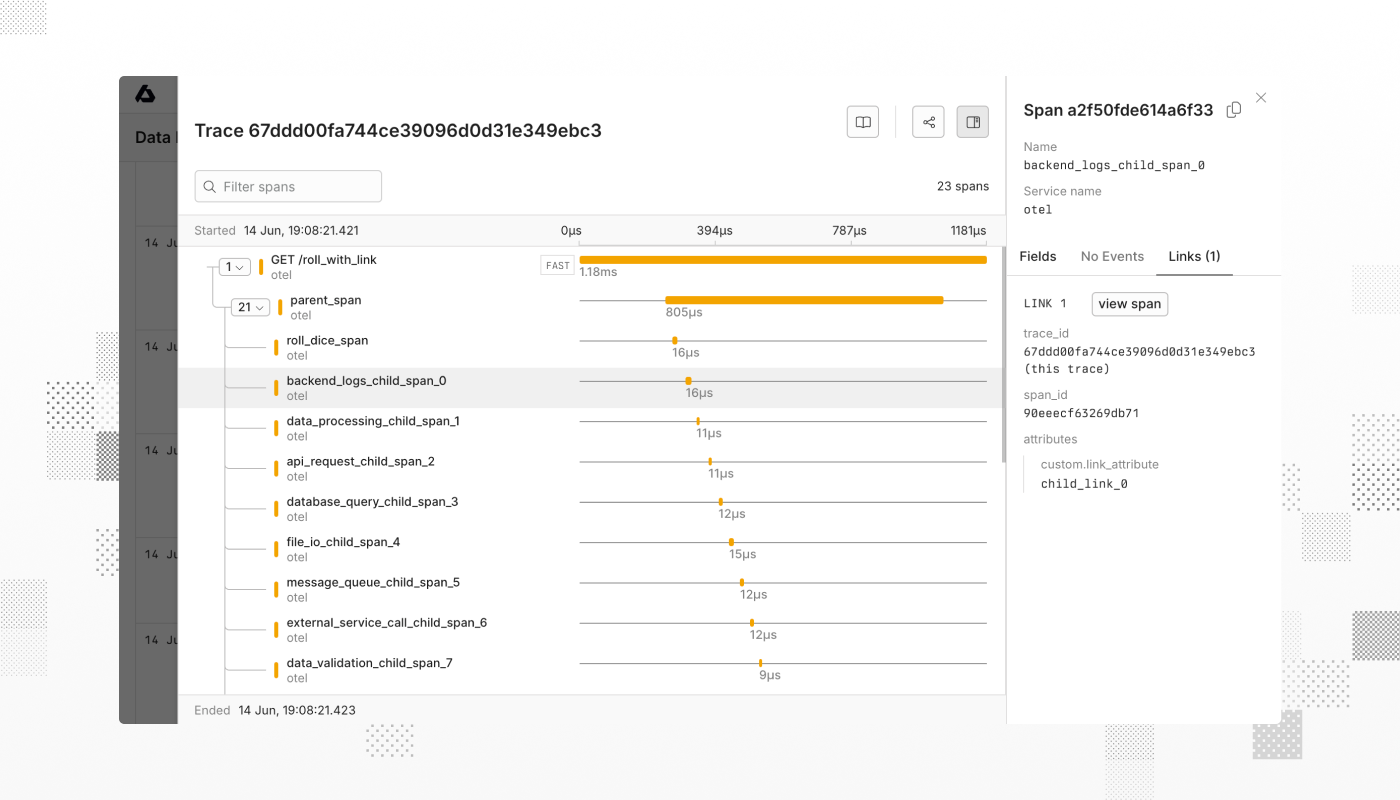
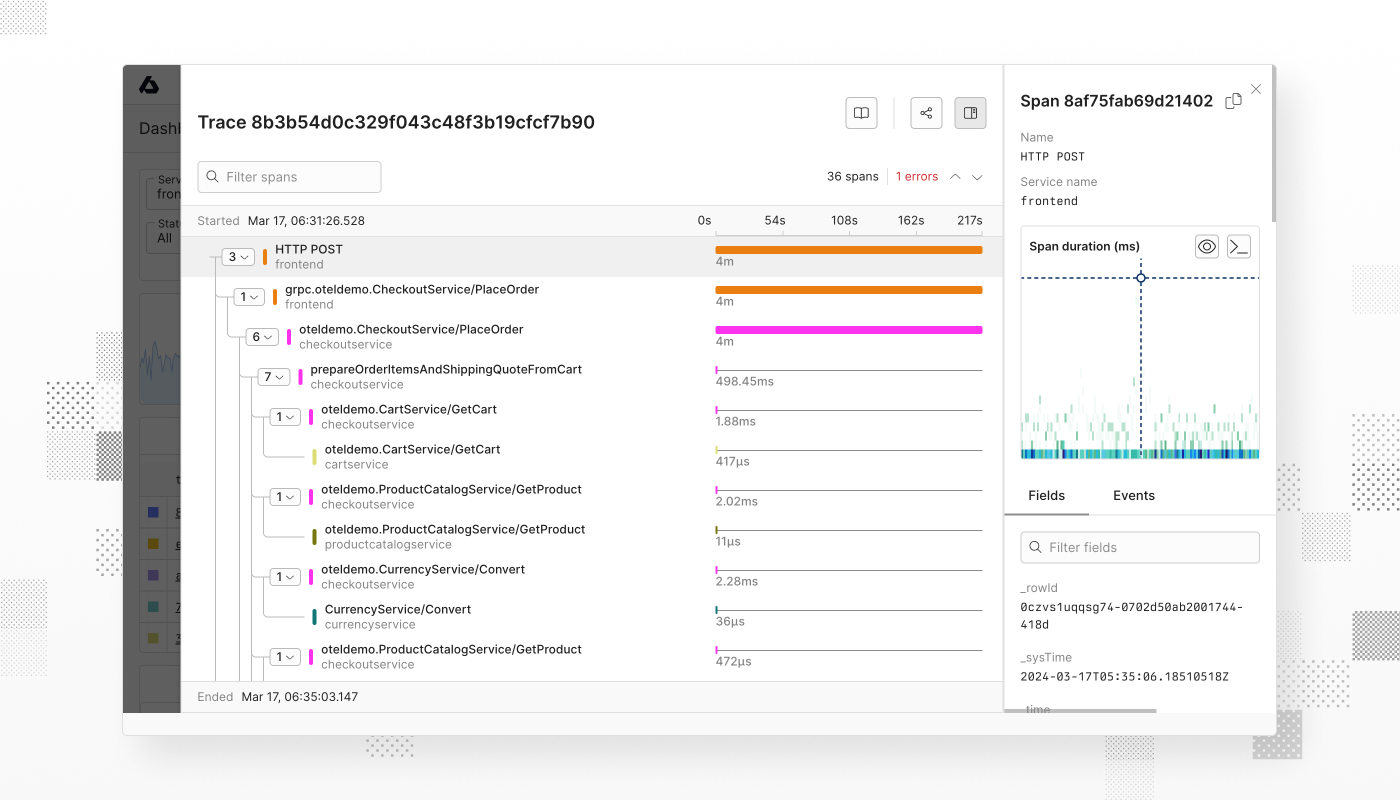
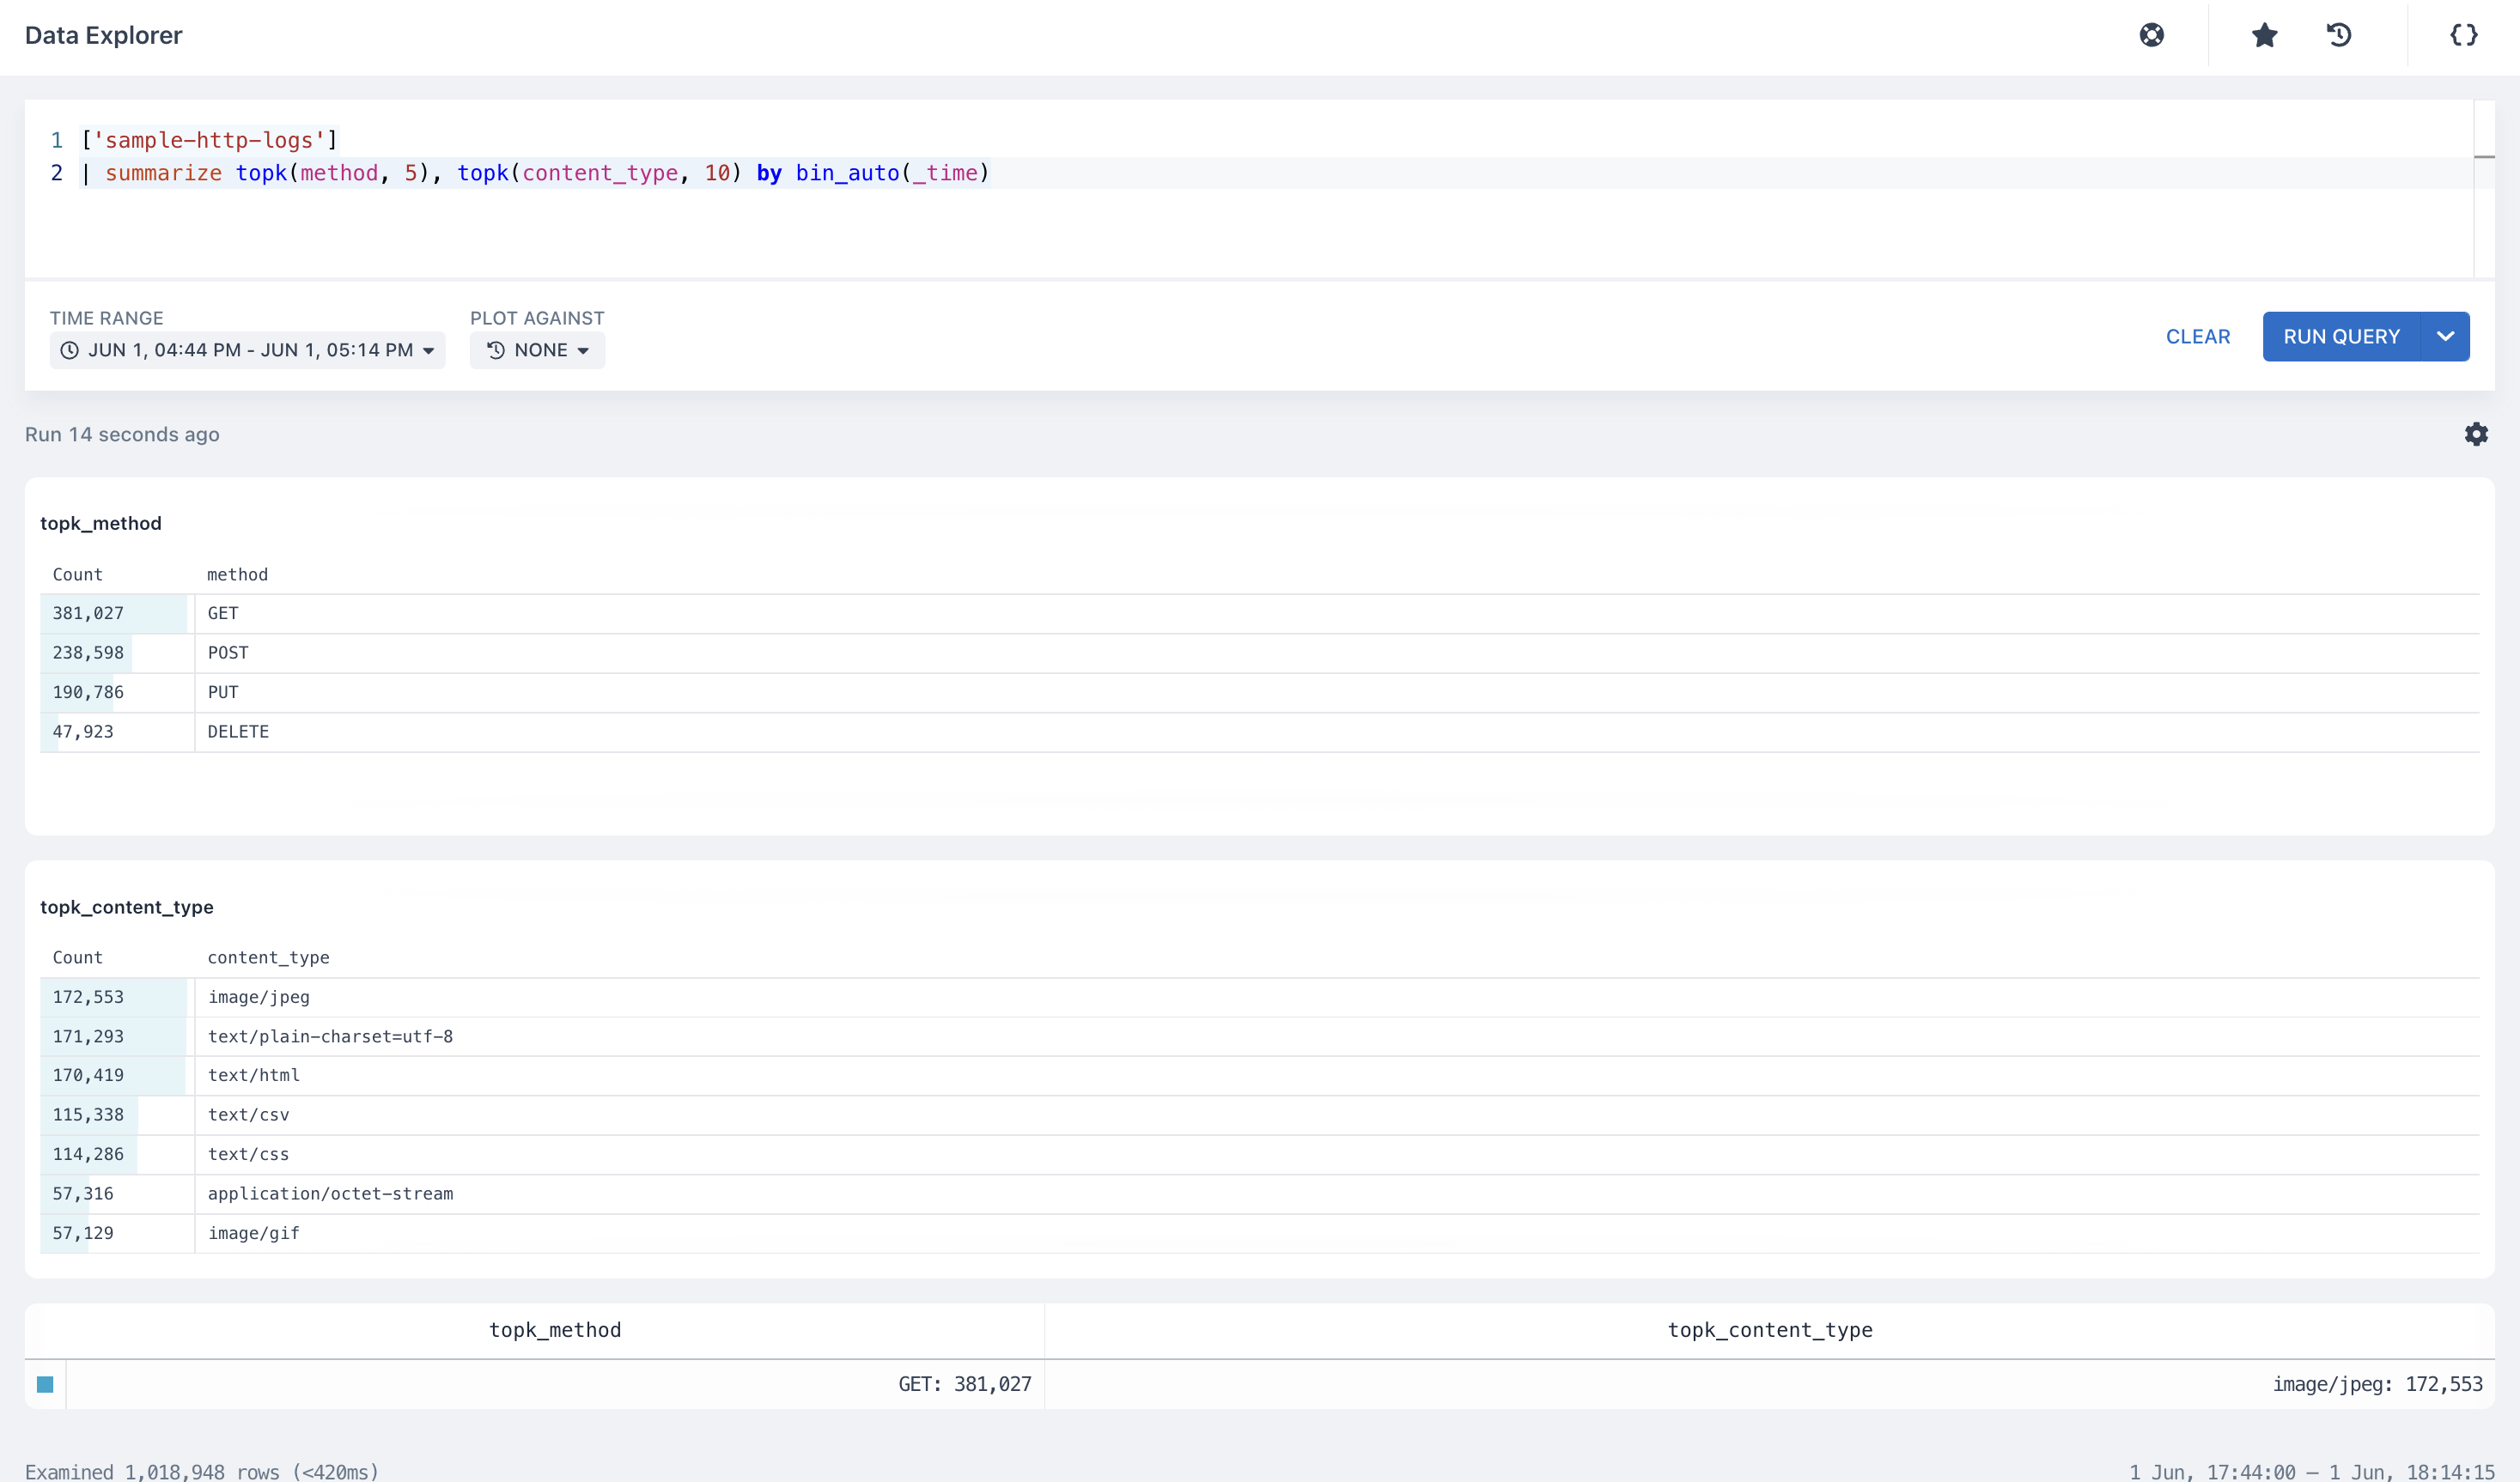
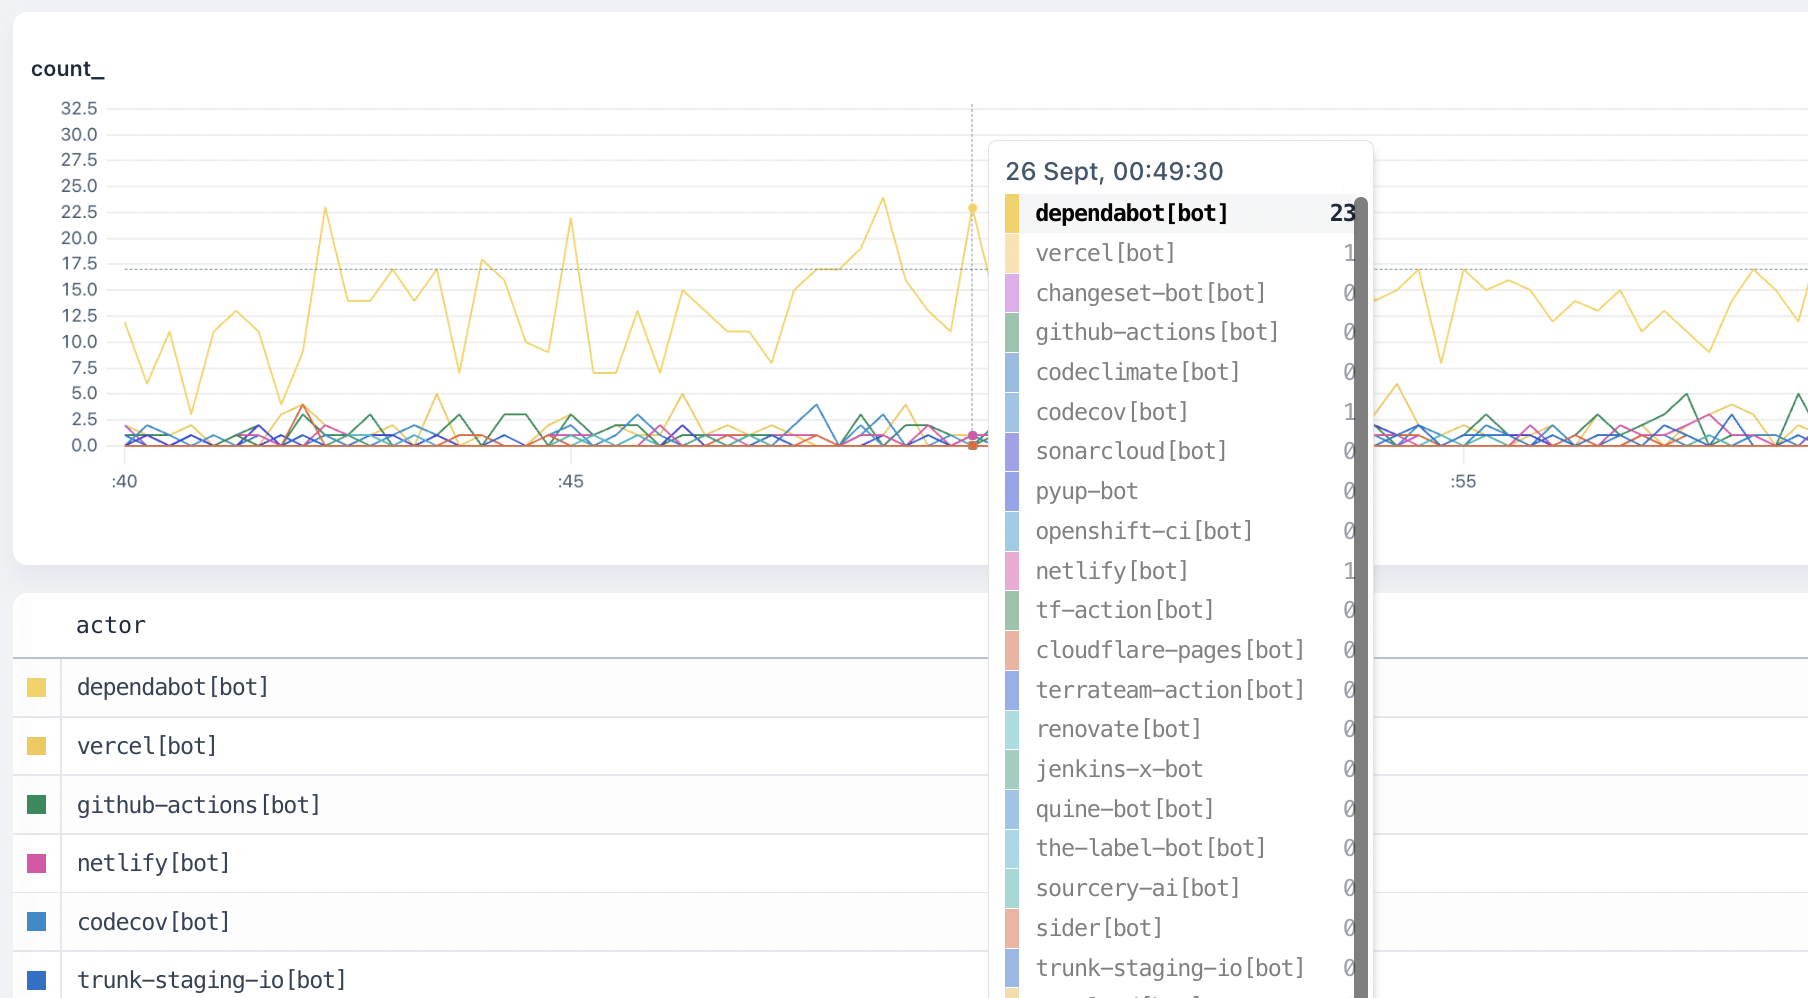
You can now capture user feedback on your AI capabilities and link it directly to traces. When a user gives a thumbs up, leaves a comment, or abandons a response, that signal is stored as a timestamped event connected to the exact AI run that produced it. This lets you correlate user perception with system behavior to understand what went wrong and prioritize high-impact improvements.
Axiom AI SDK supports multiple feedback types including thumbs up/down, numeric ratings, boolean responses, free-form text, and implicit signals like copying or regenerating responses. Feedback events are stored in a dedicated dataset and can be analyzed in both the Query tab and the AI engineering tab.
To learn how to capture user feedback, see User feedback.
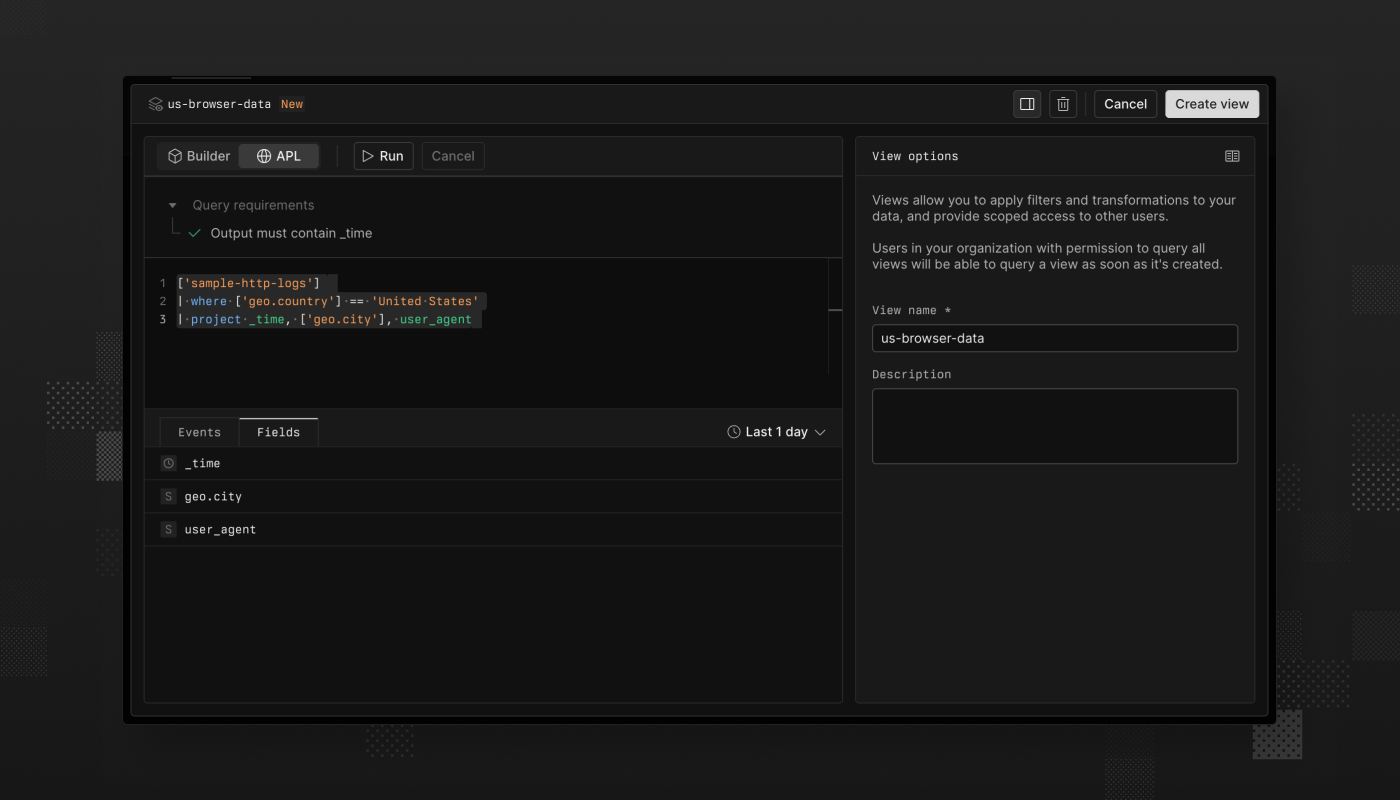
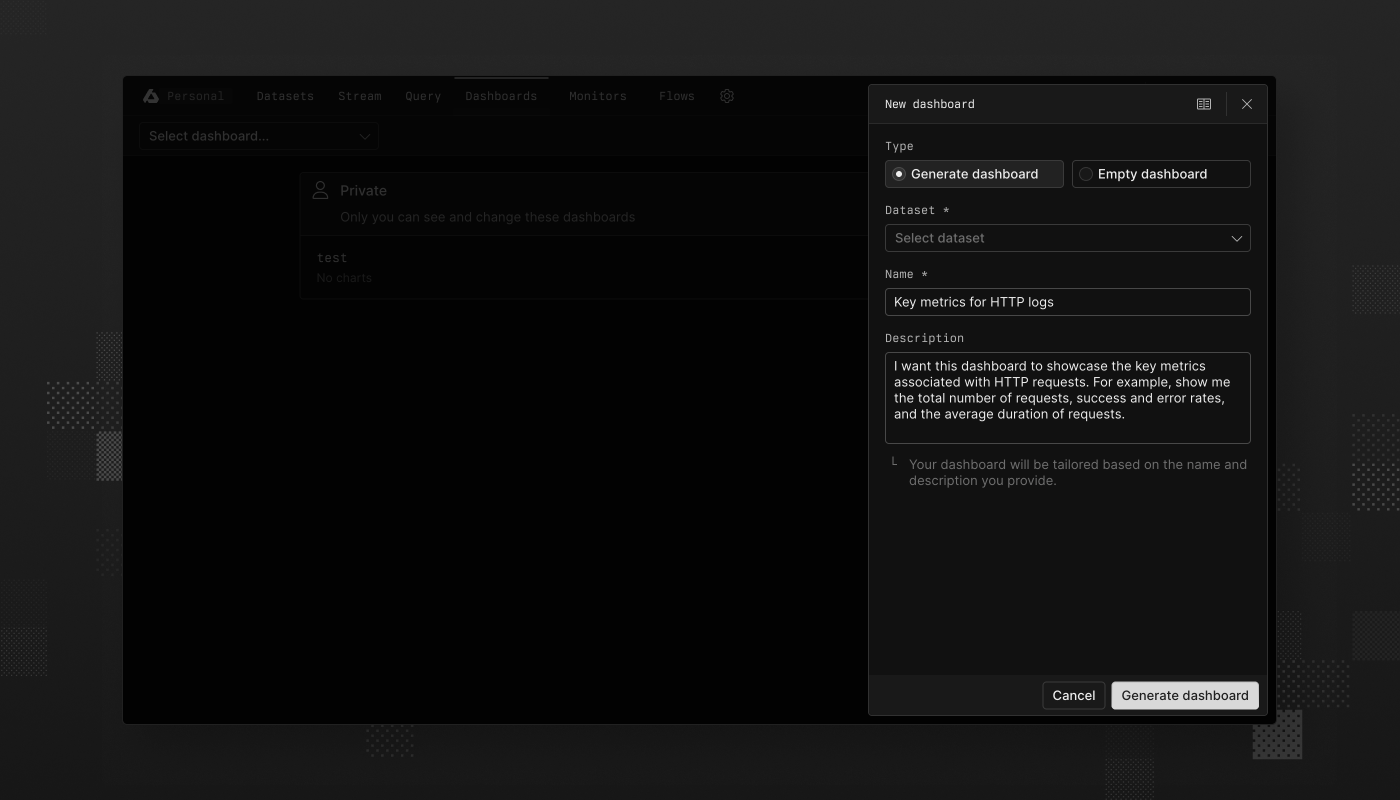
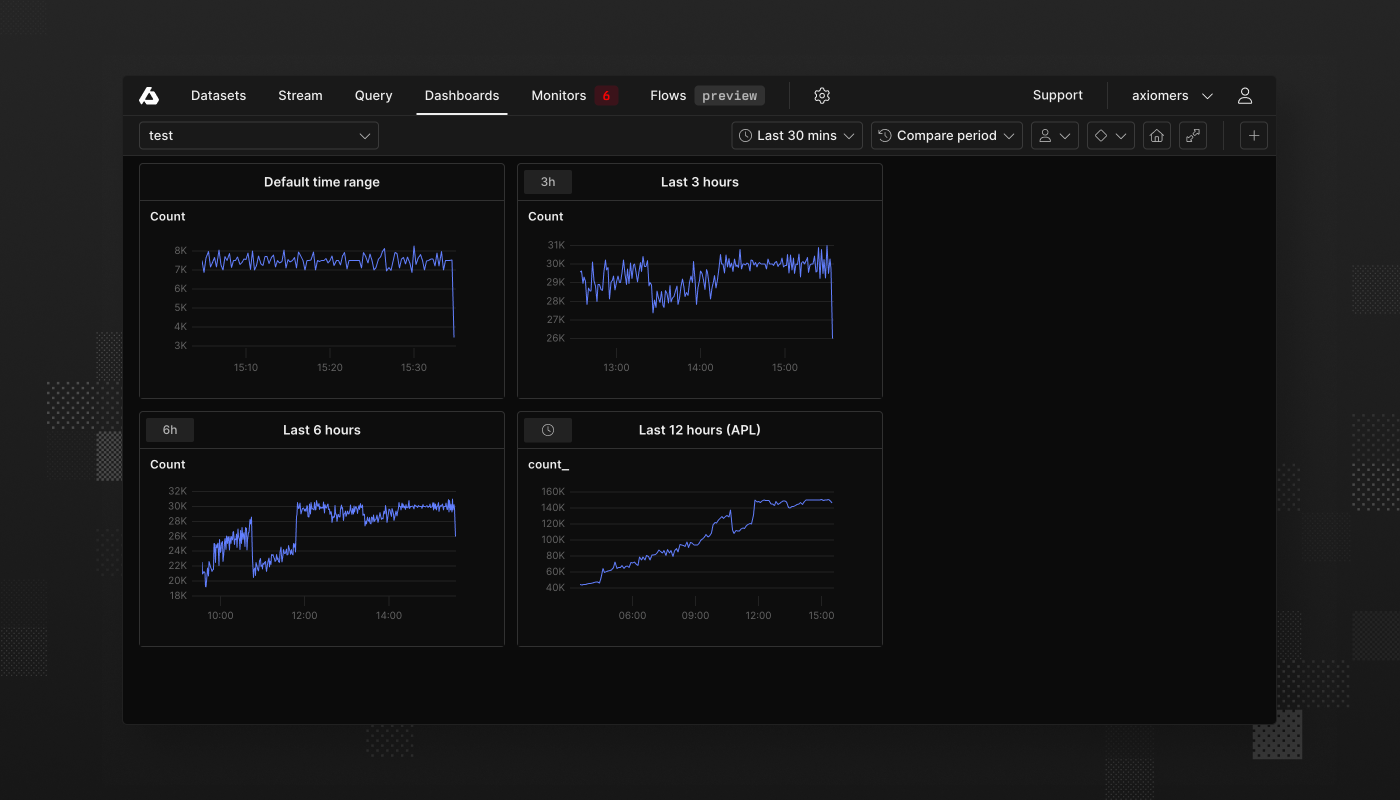
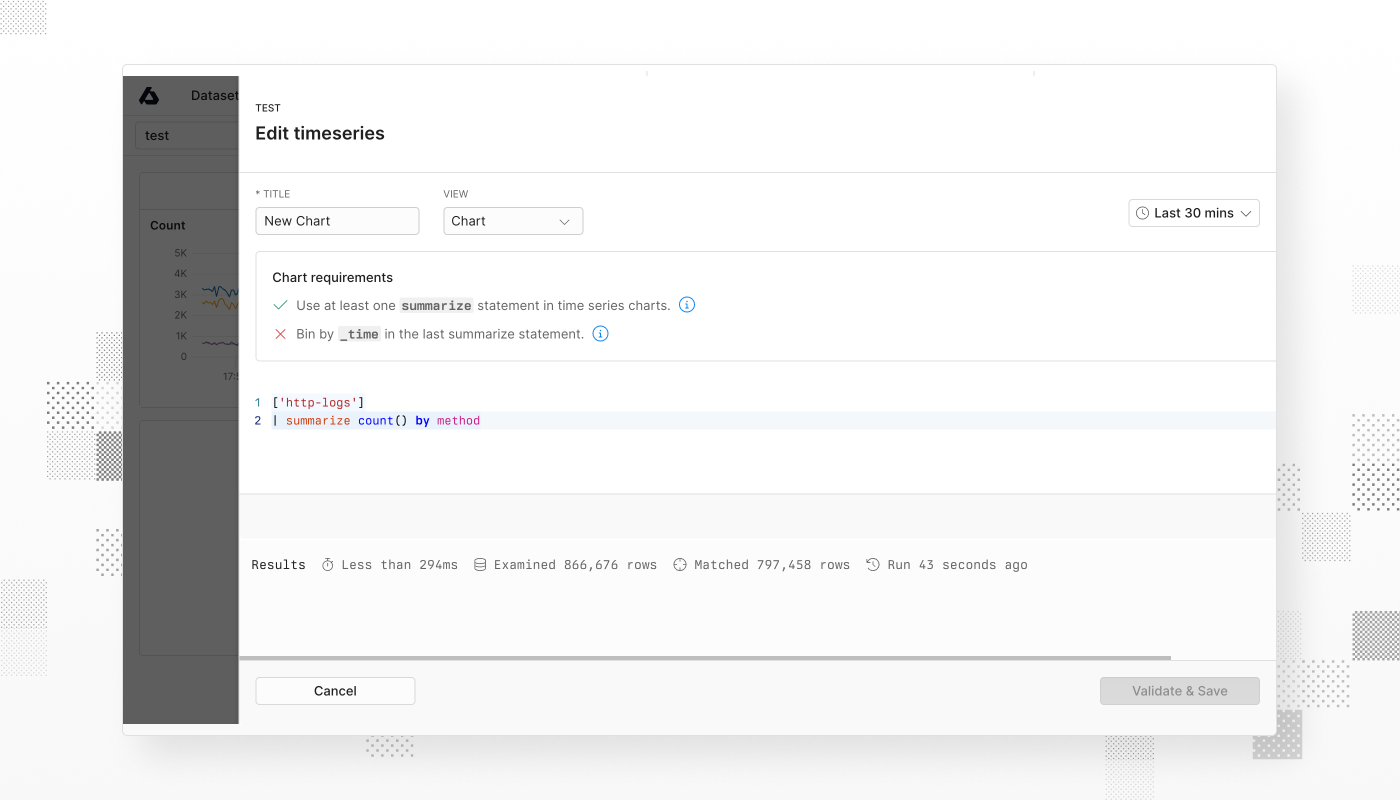
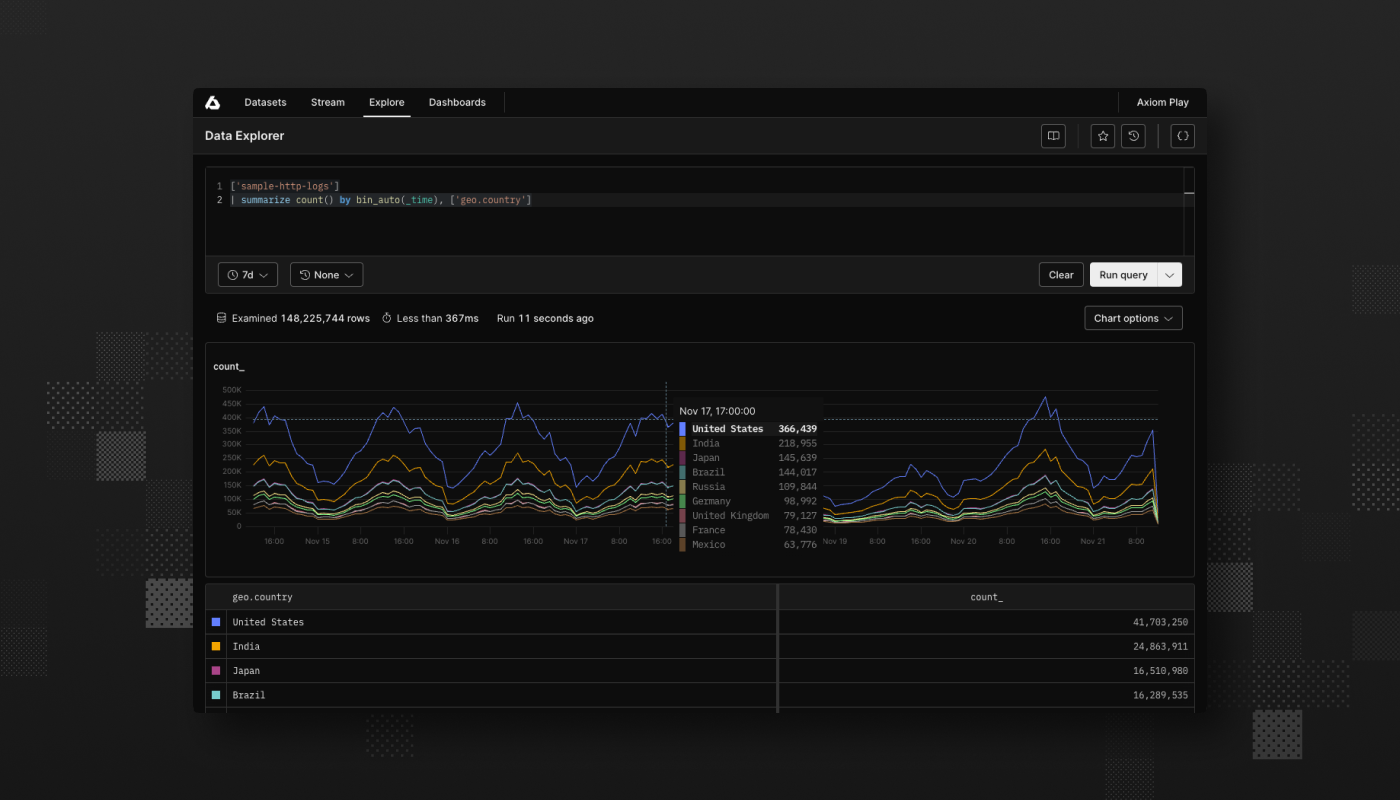
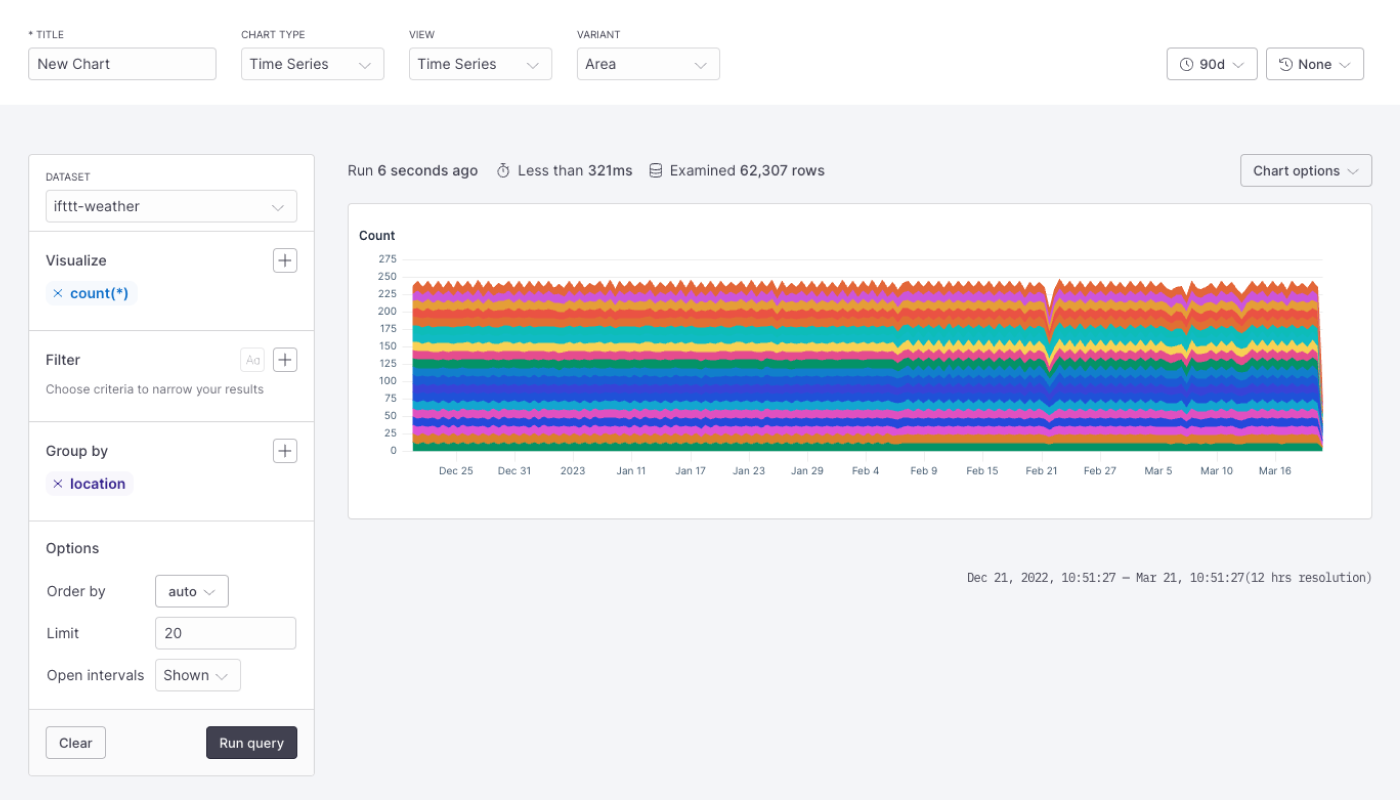
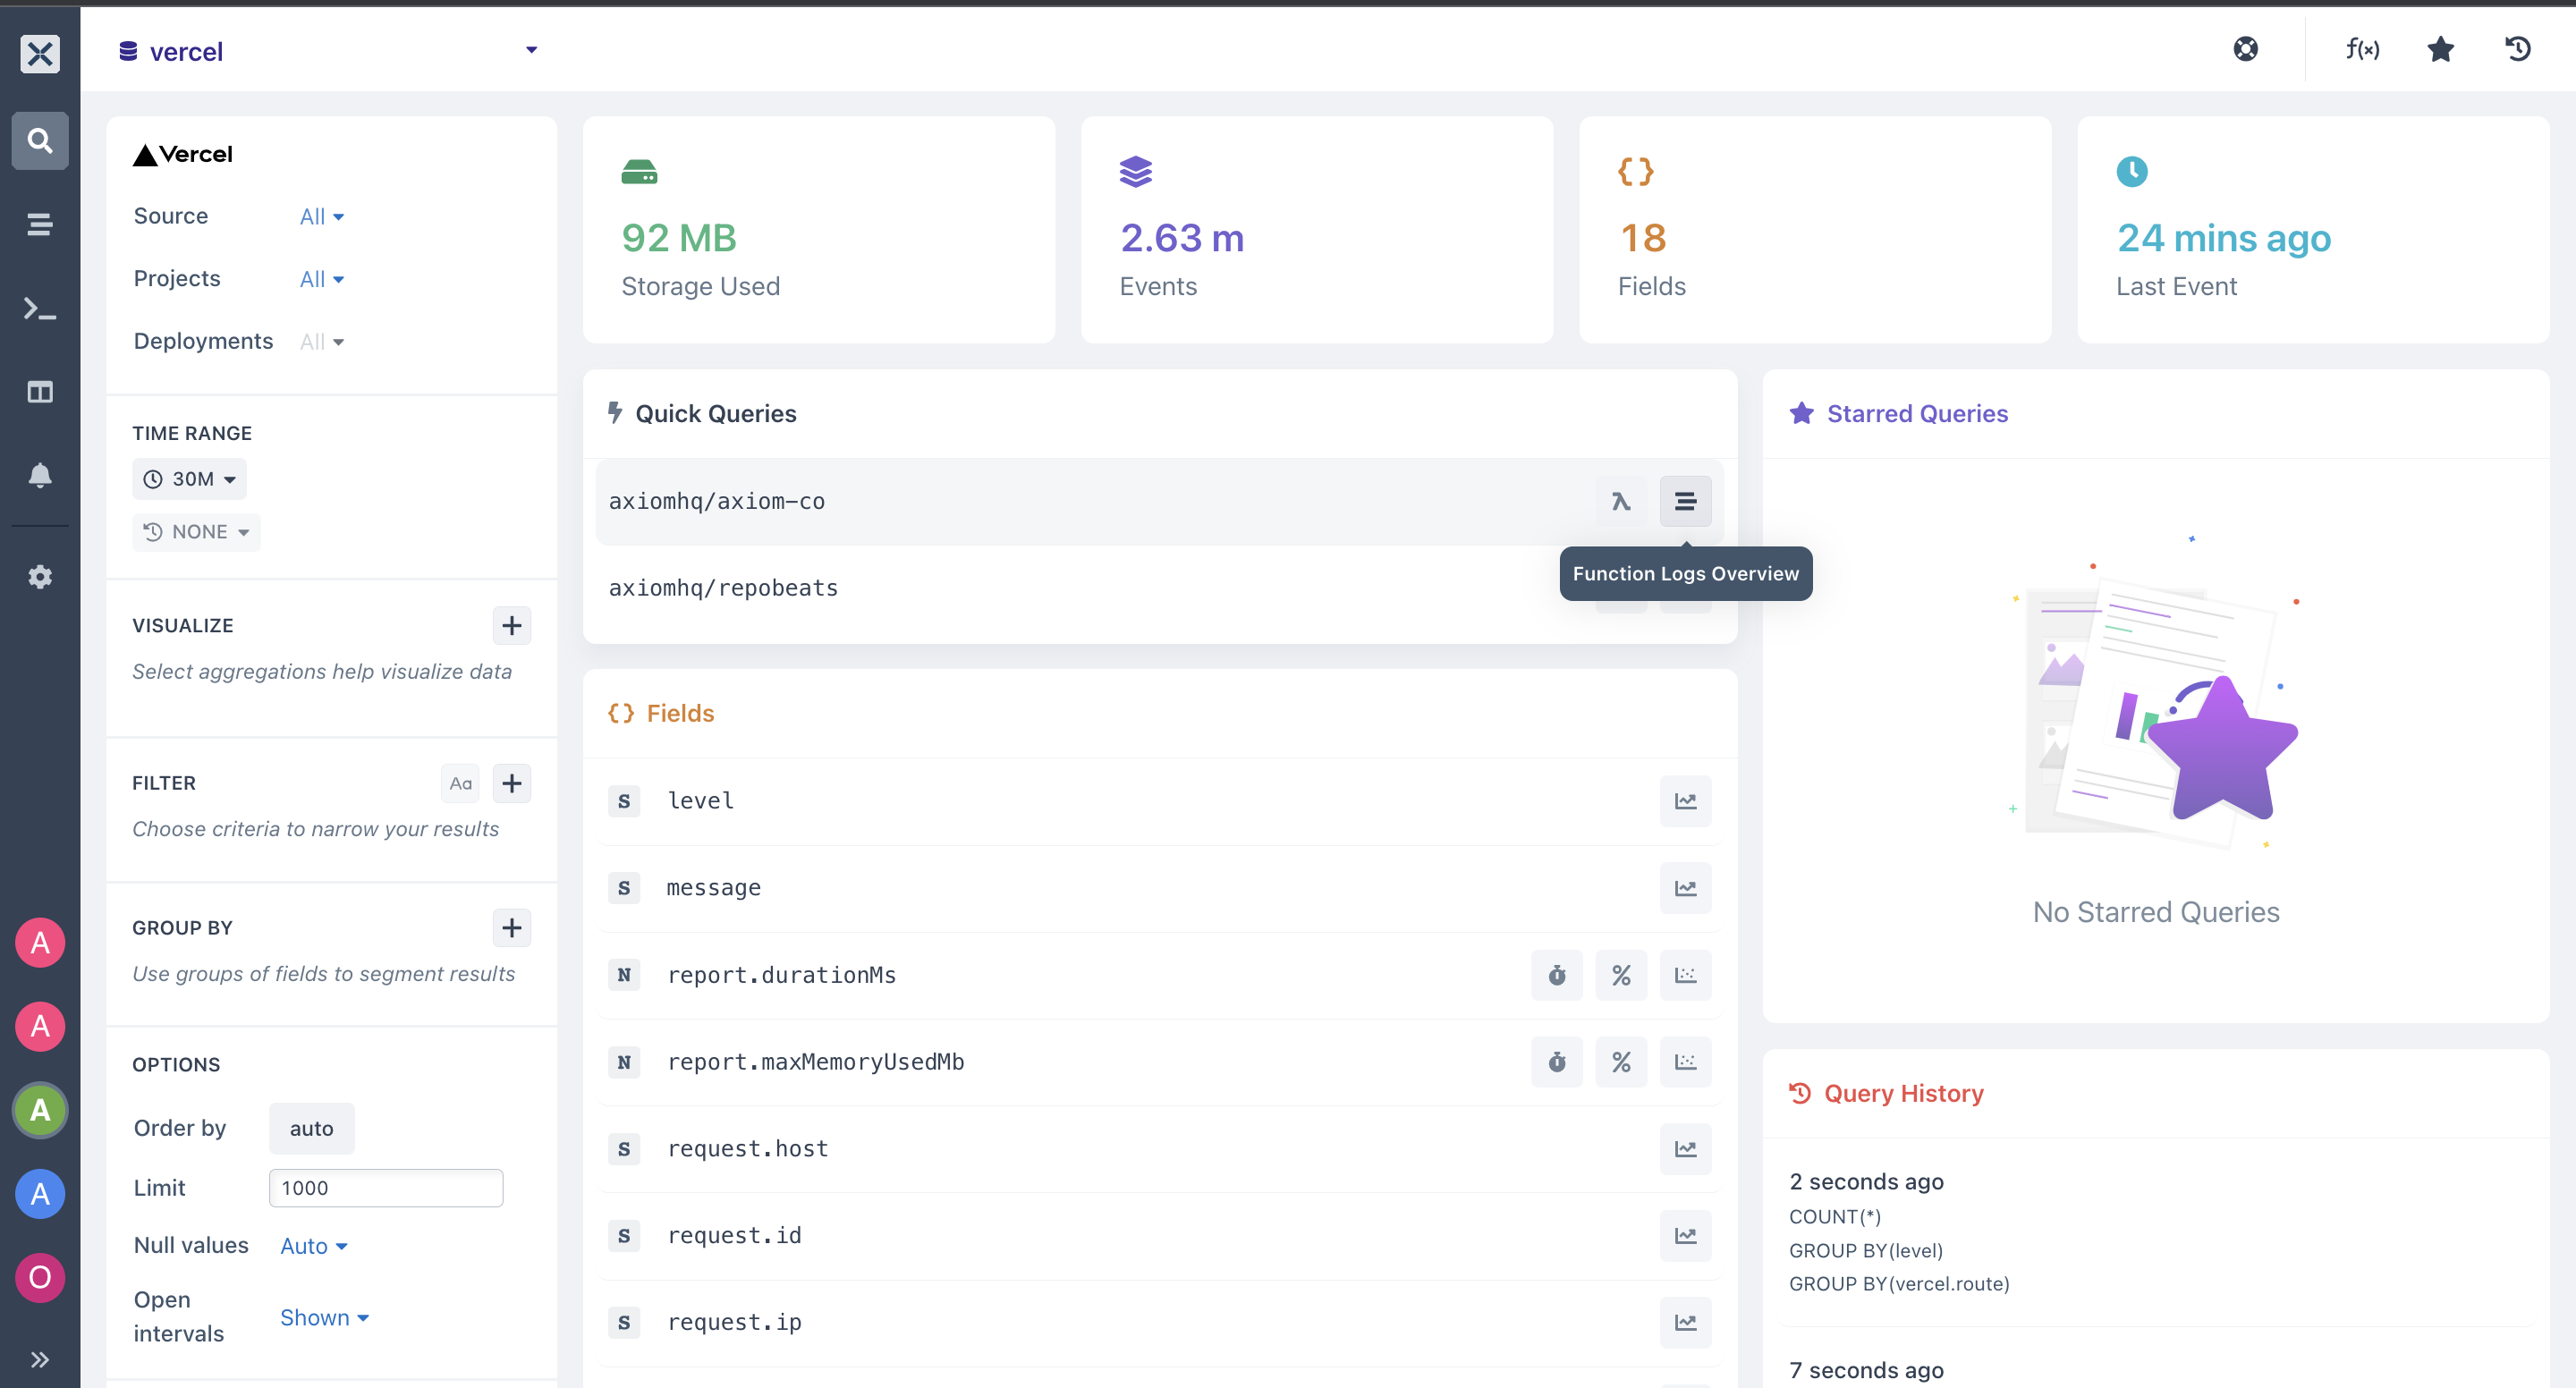
Dashboard generation for metrics datasets
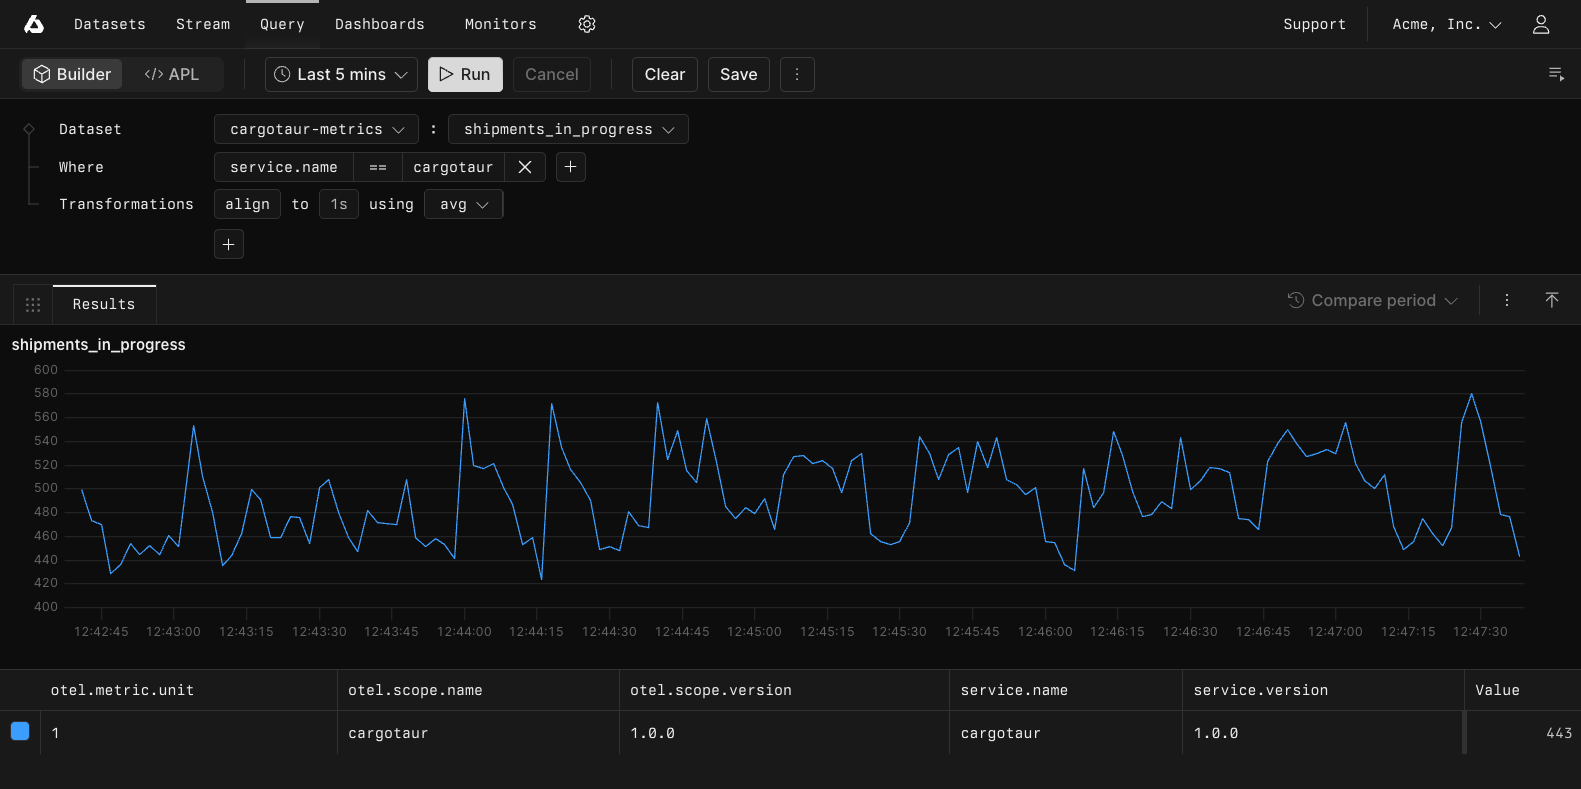
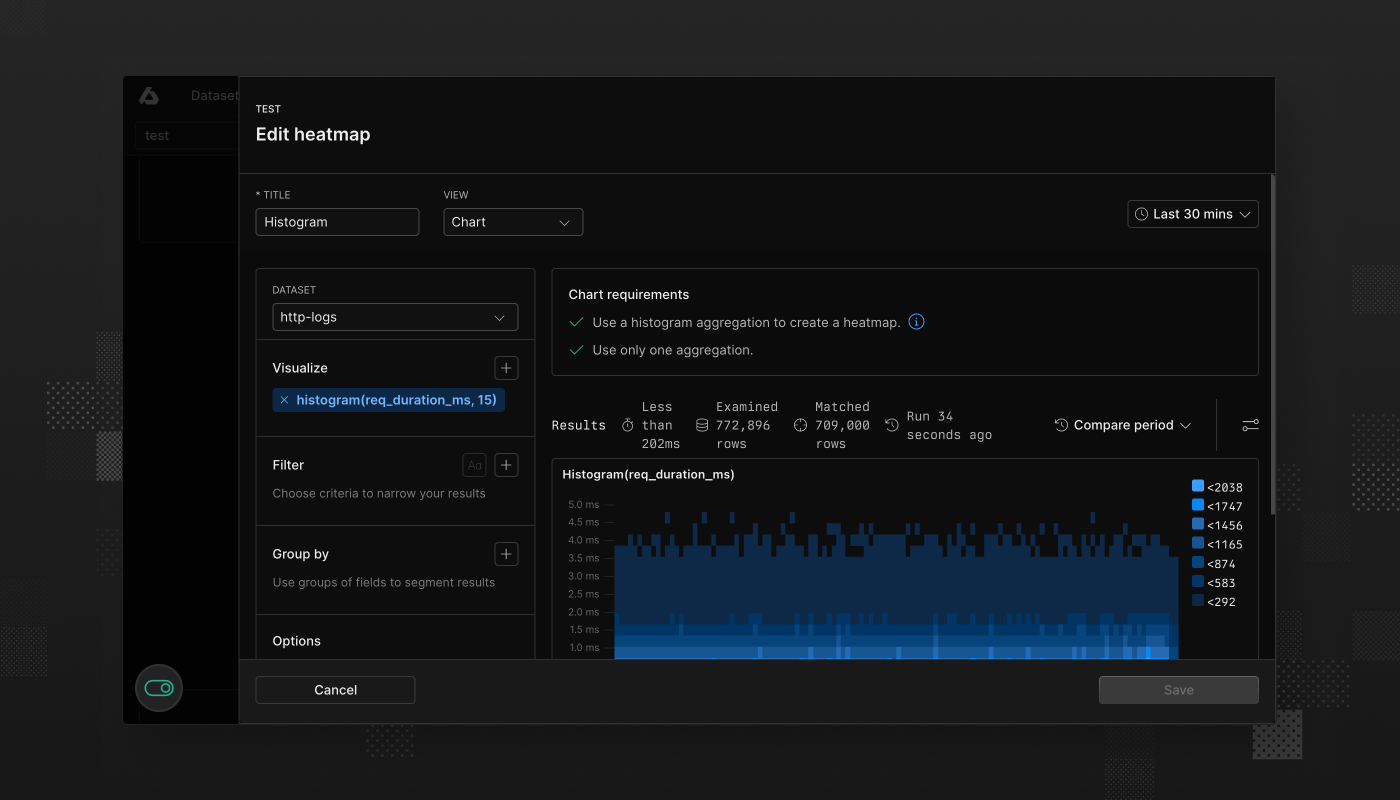
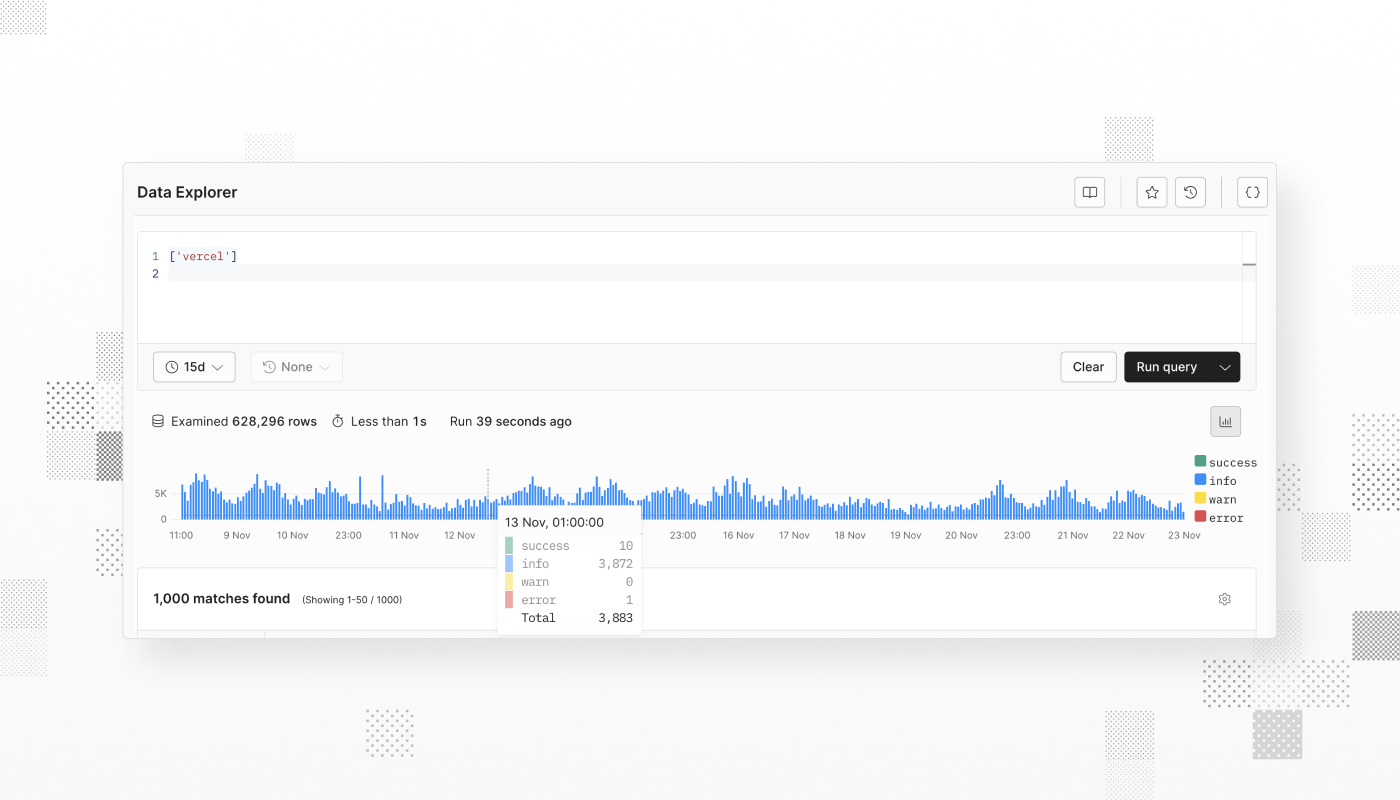
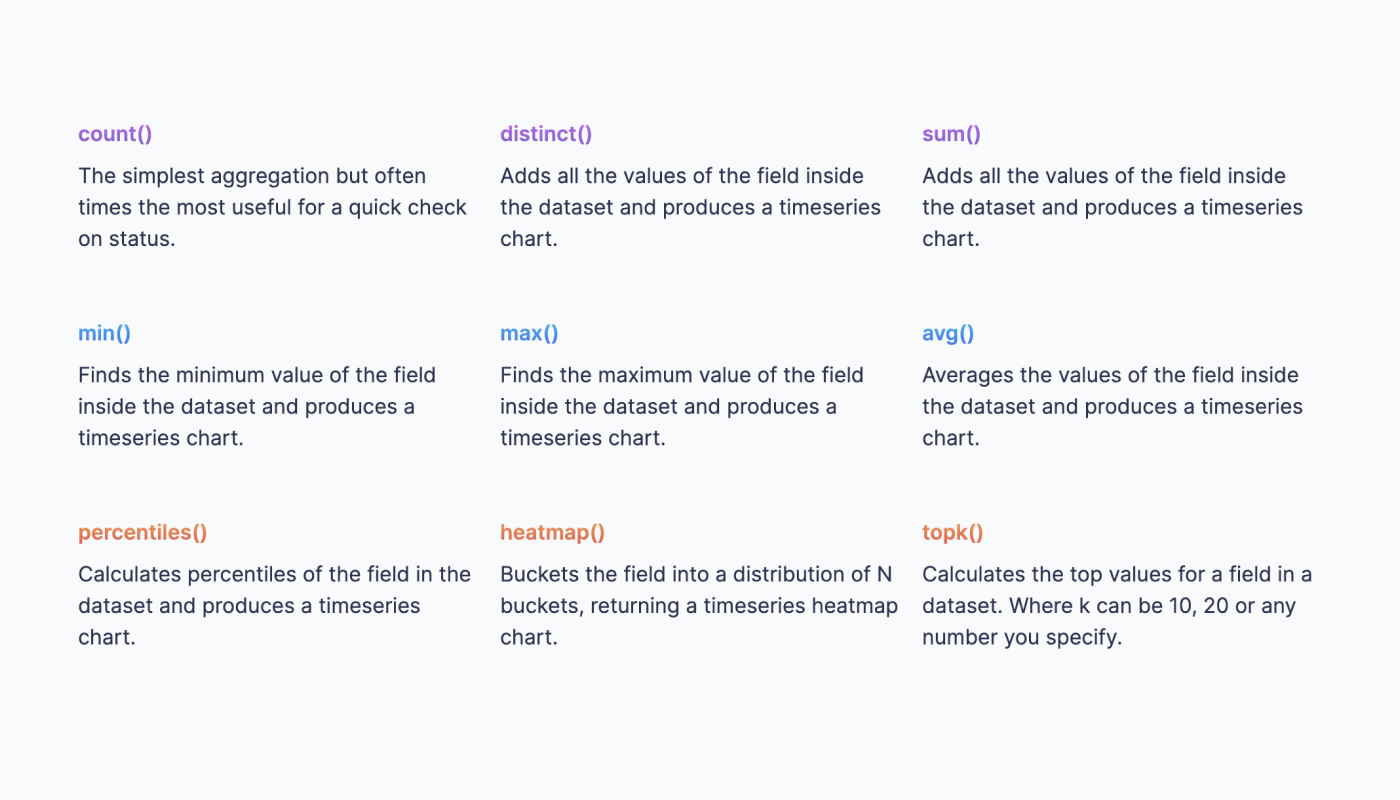
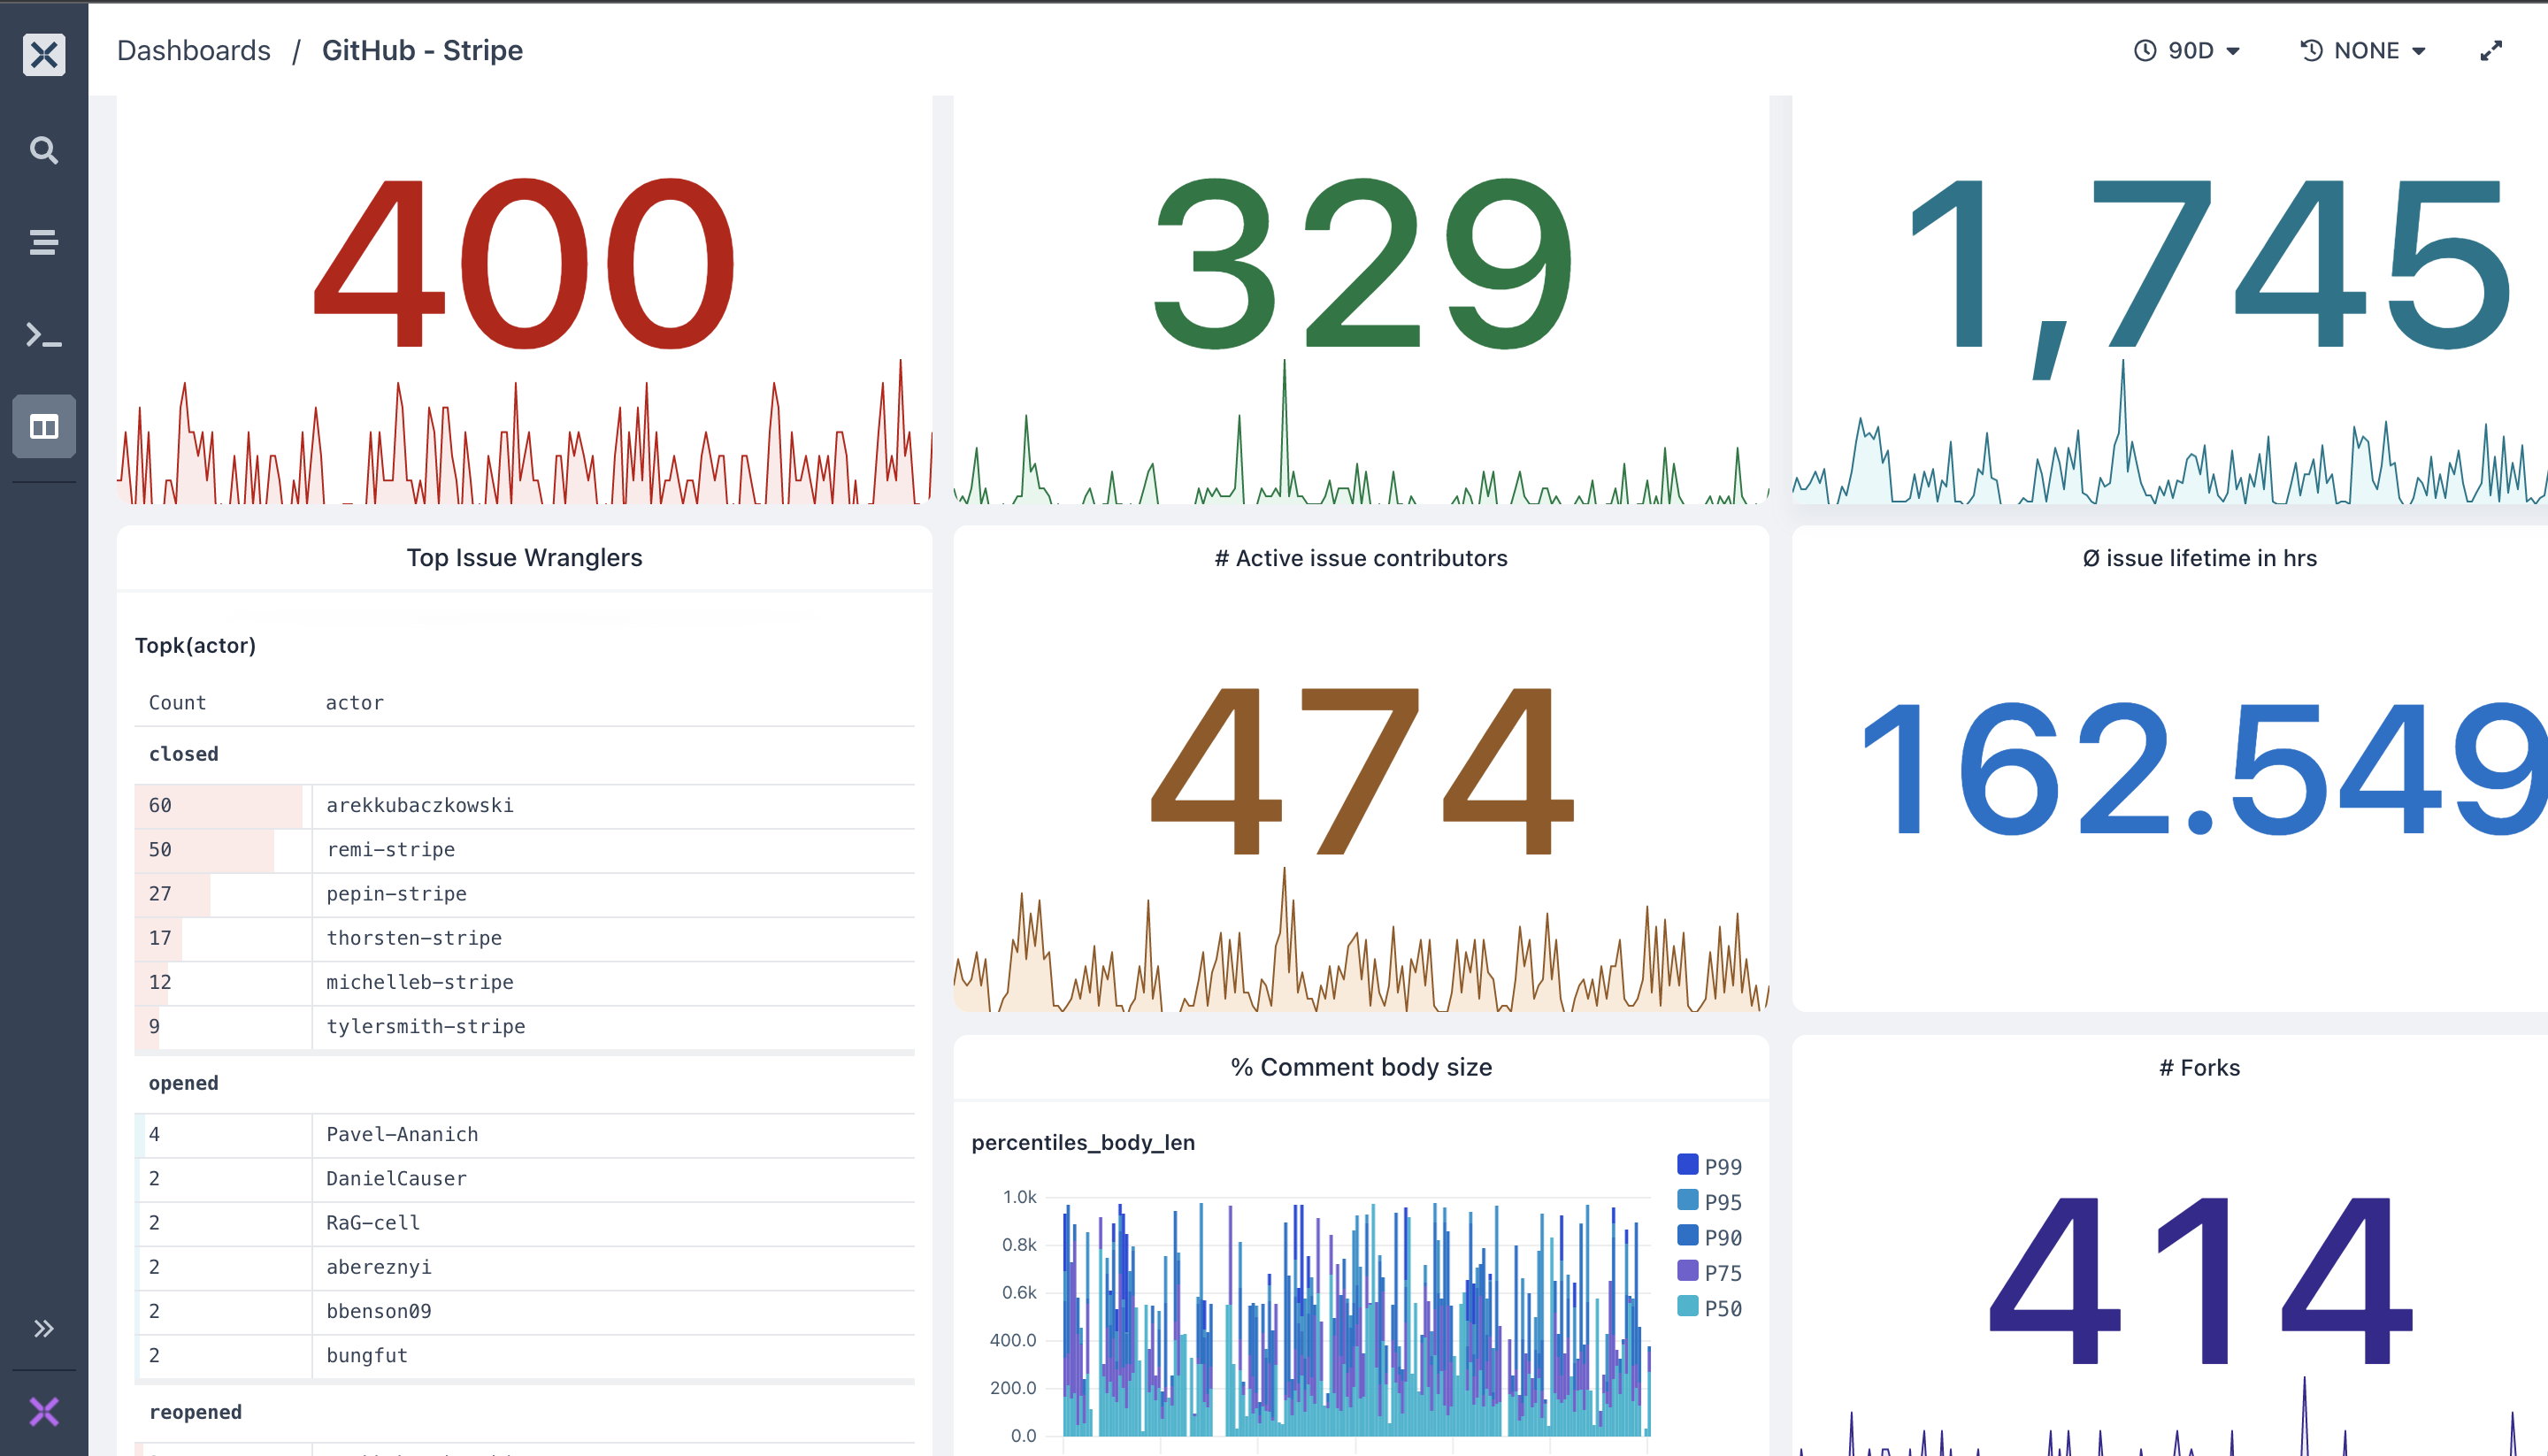
You can now generate dashboards directly from metrics datasets. Previously, AI-powered dashboard generation only worked with logs and traces datasets. Now, when you select a metrics dataset, Axiom automatically detects the dataset kind and generates appropriate visualizations for your metrics.
The generation process is intelligent about chart selection. It uses heatmaps for latency, duration, and size metrics while choosing time series charts for counters, rates, and gauges. The result is a dashboard that makes sense for your specific metrics without requiring manual configuration.
We've improved the metrics experience in many other ways:
Added last aggregation function to the metrics query builder's using clause
Fixed heatmap rendering issues
Fixed chart options interface
Allowed deletion of metrics datasets
Improved value formatting to include units
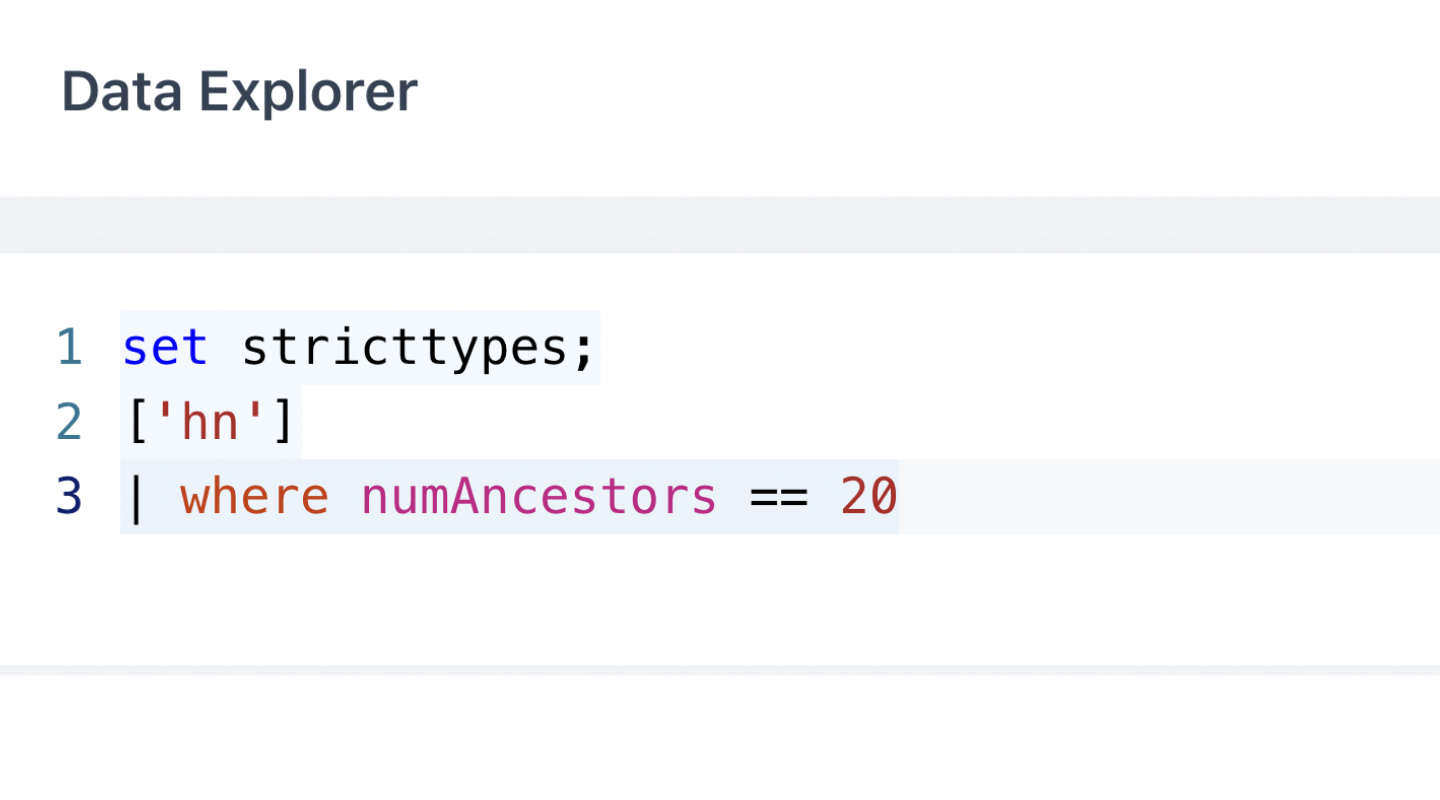
TOON export for query results
Query results can now be exported in TOON format, a structured data format that's more efficient when sharing data with LLMs and other tools. Choose TOON (structured) for hierarchical data or TOON (list) for flat representations, depending on what works best for your use case.
For more information, see Export query.
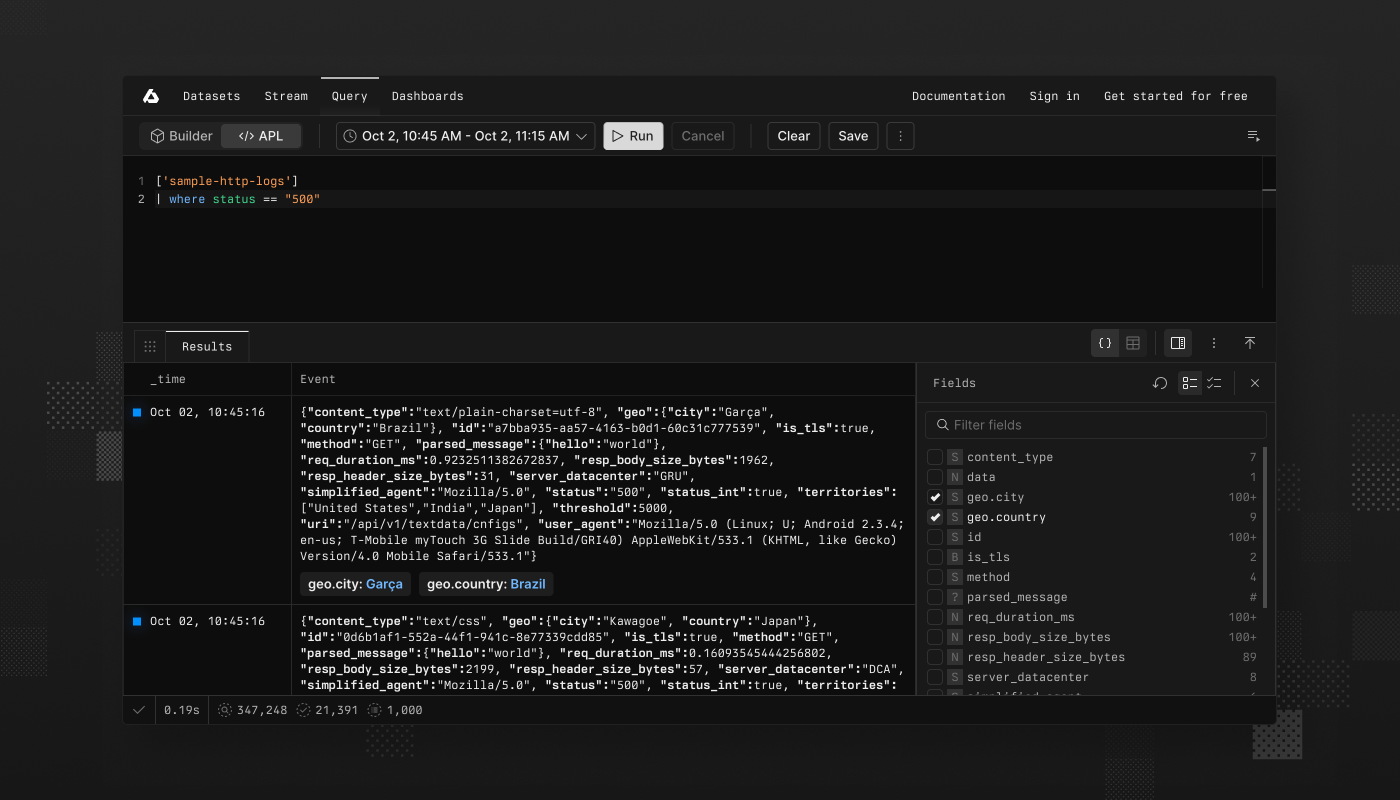
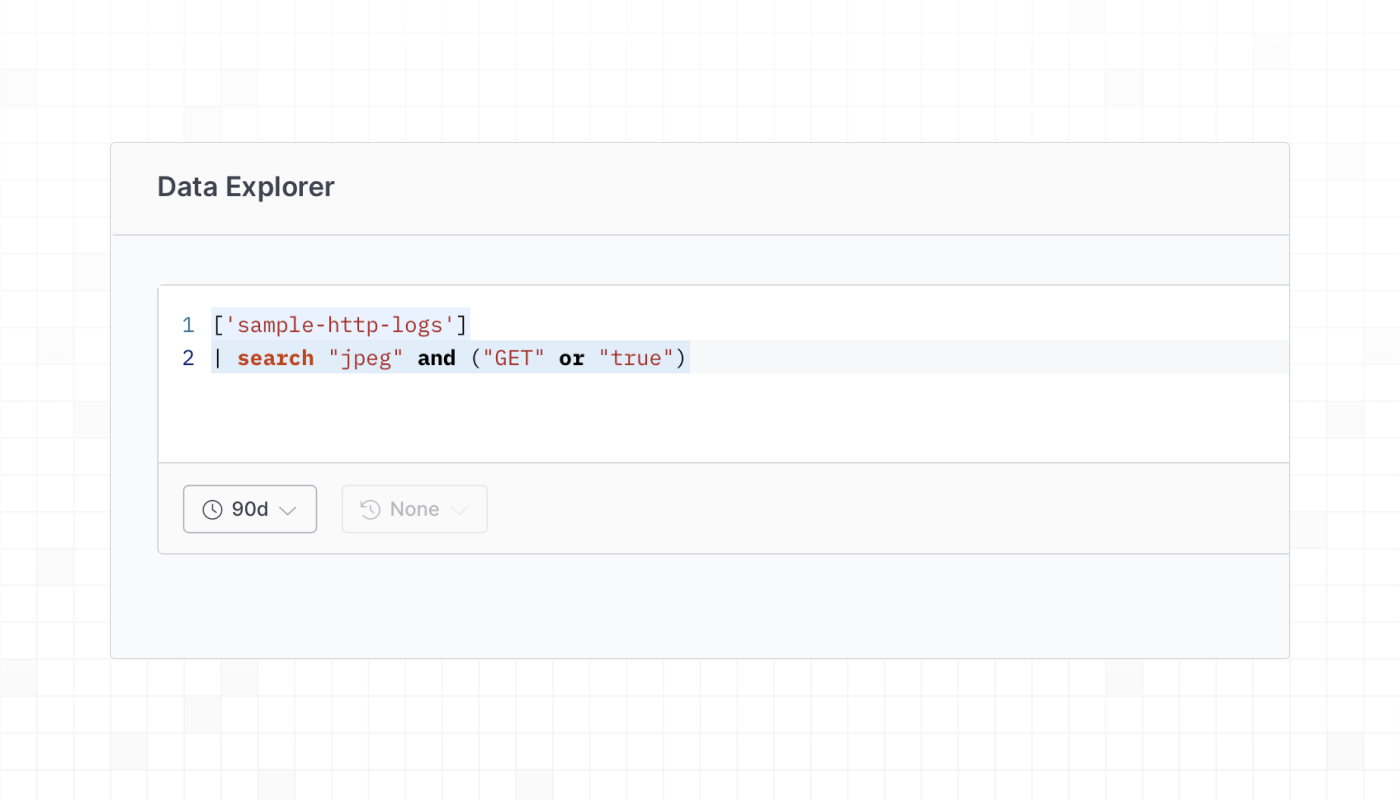
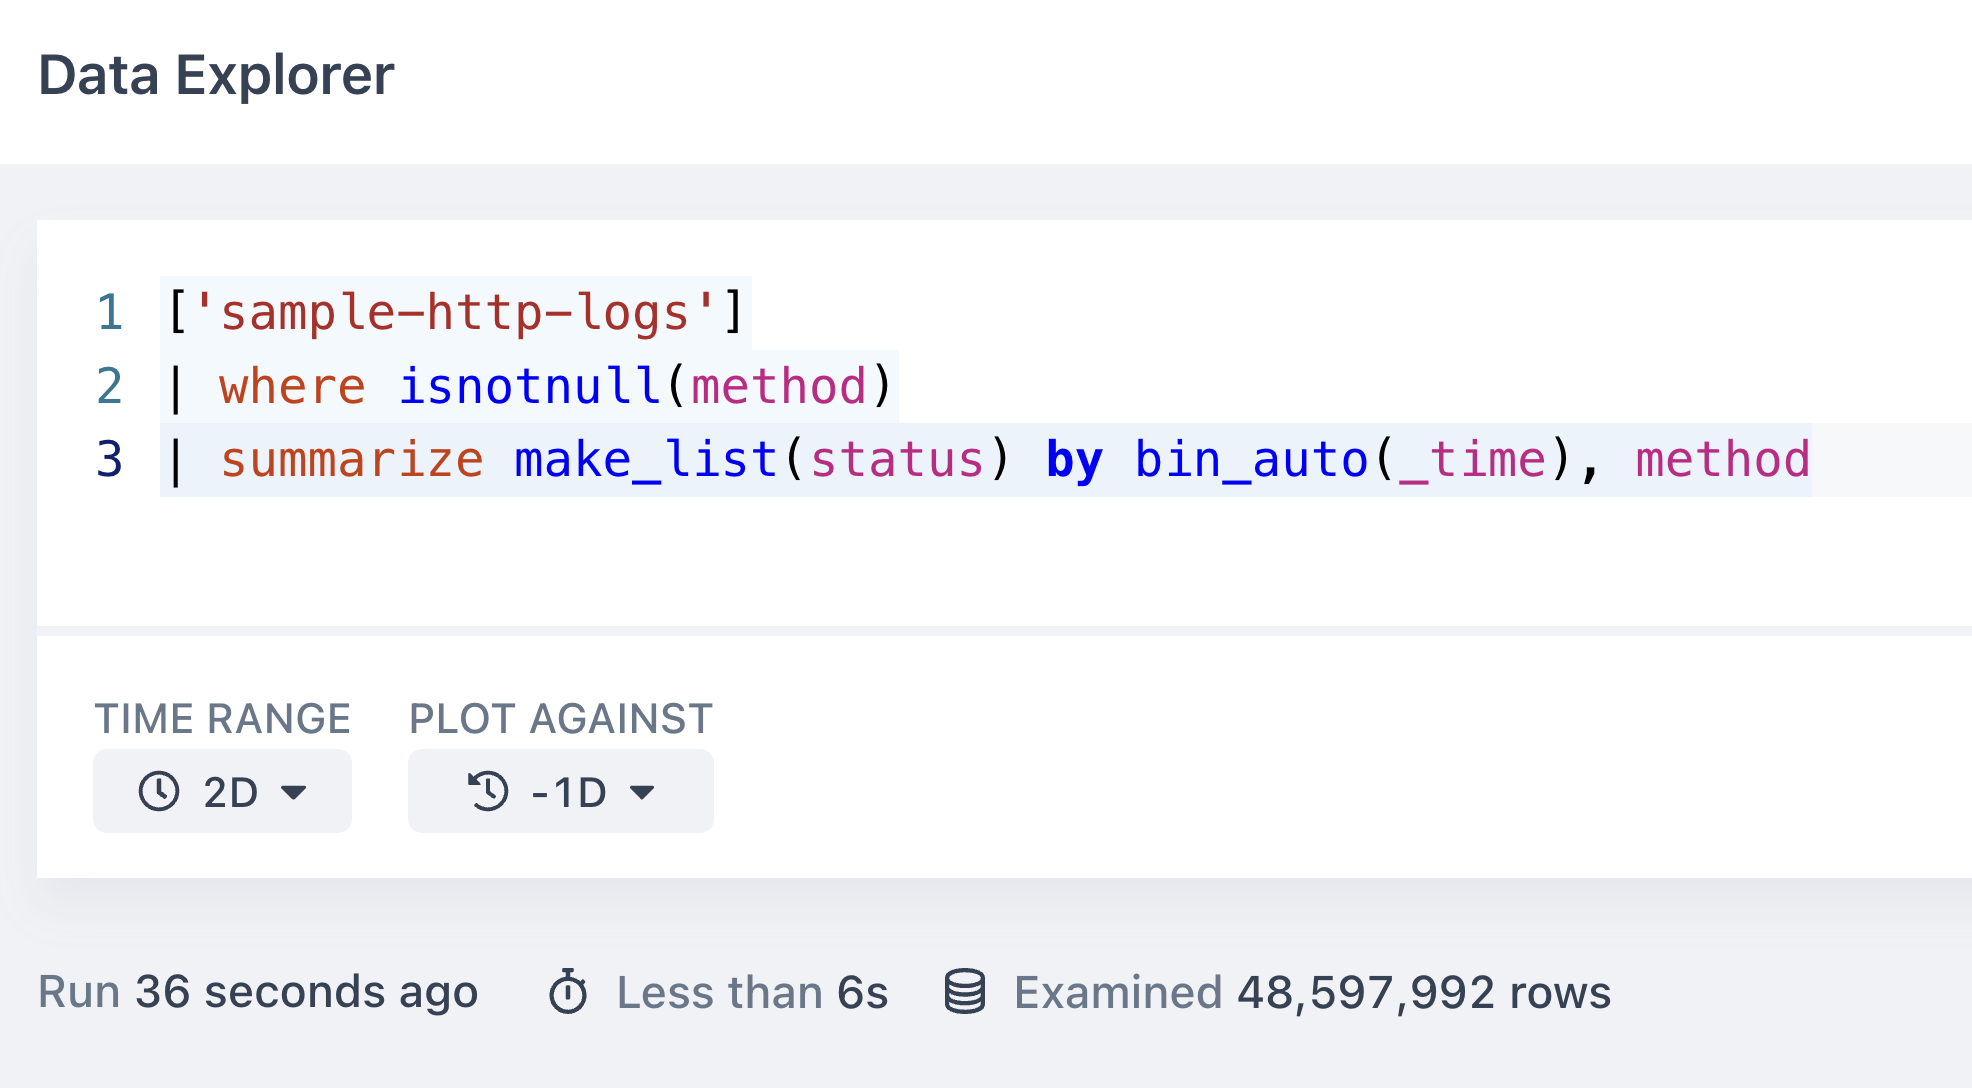
Seamless APL to query builder translation
Switching between APL and the visual query builder is now seamless. Previously, translating complex APL queries to the builder could fail or produce incomplete results. The new translation engine properly handles filters with nested groups, operator precedence, string operations, summarize clauses, ordering, and limits.
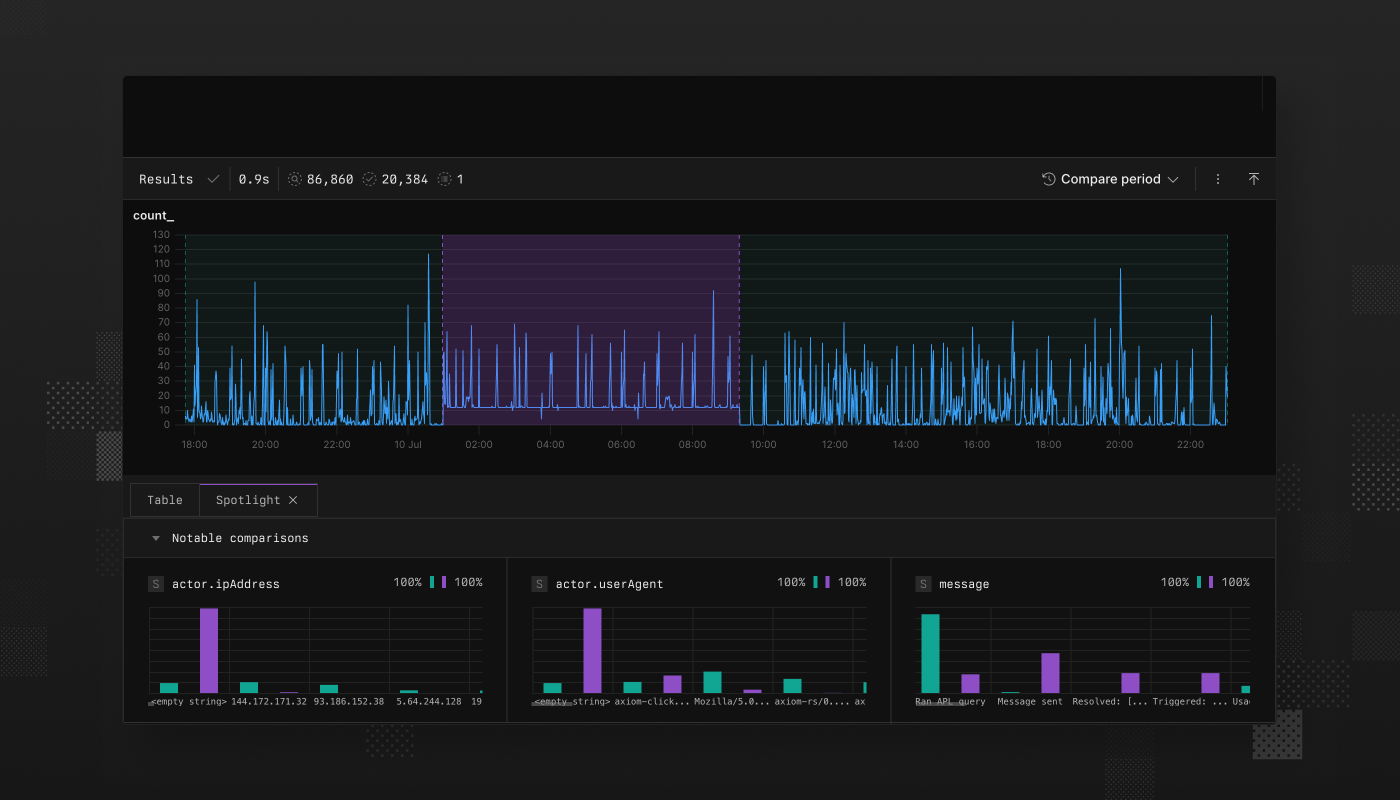
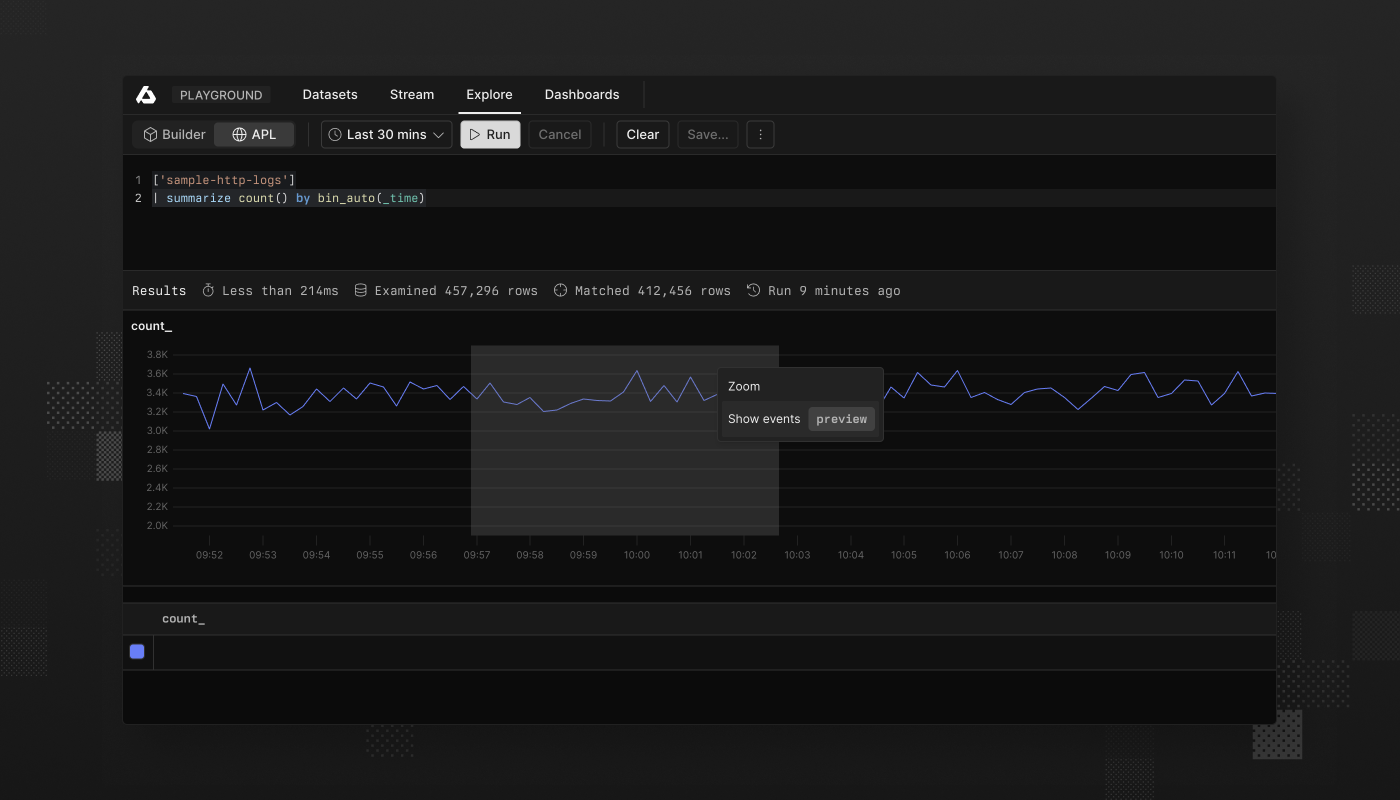
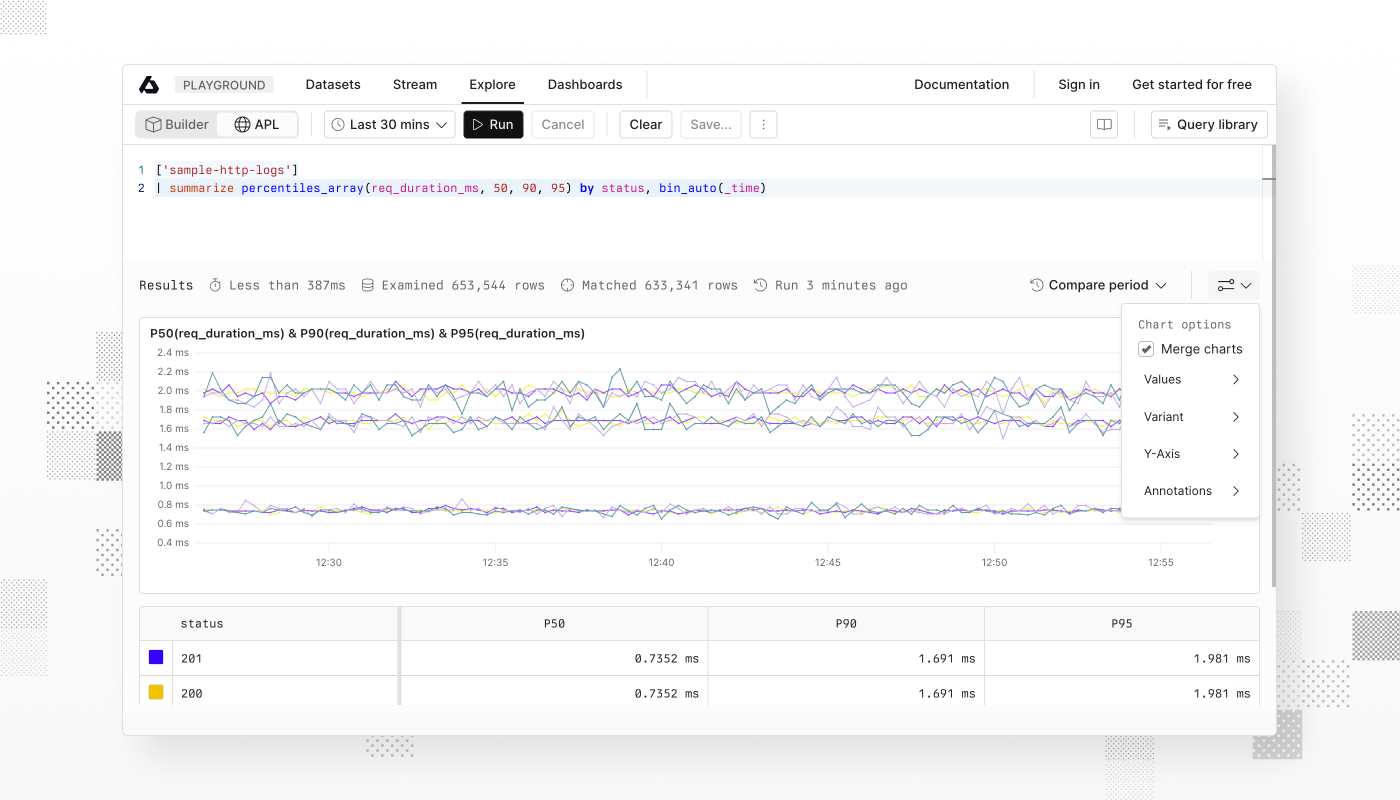
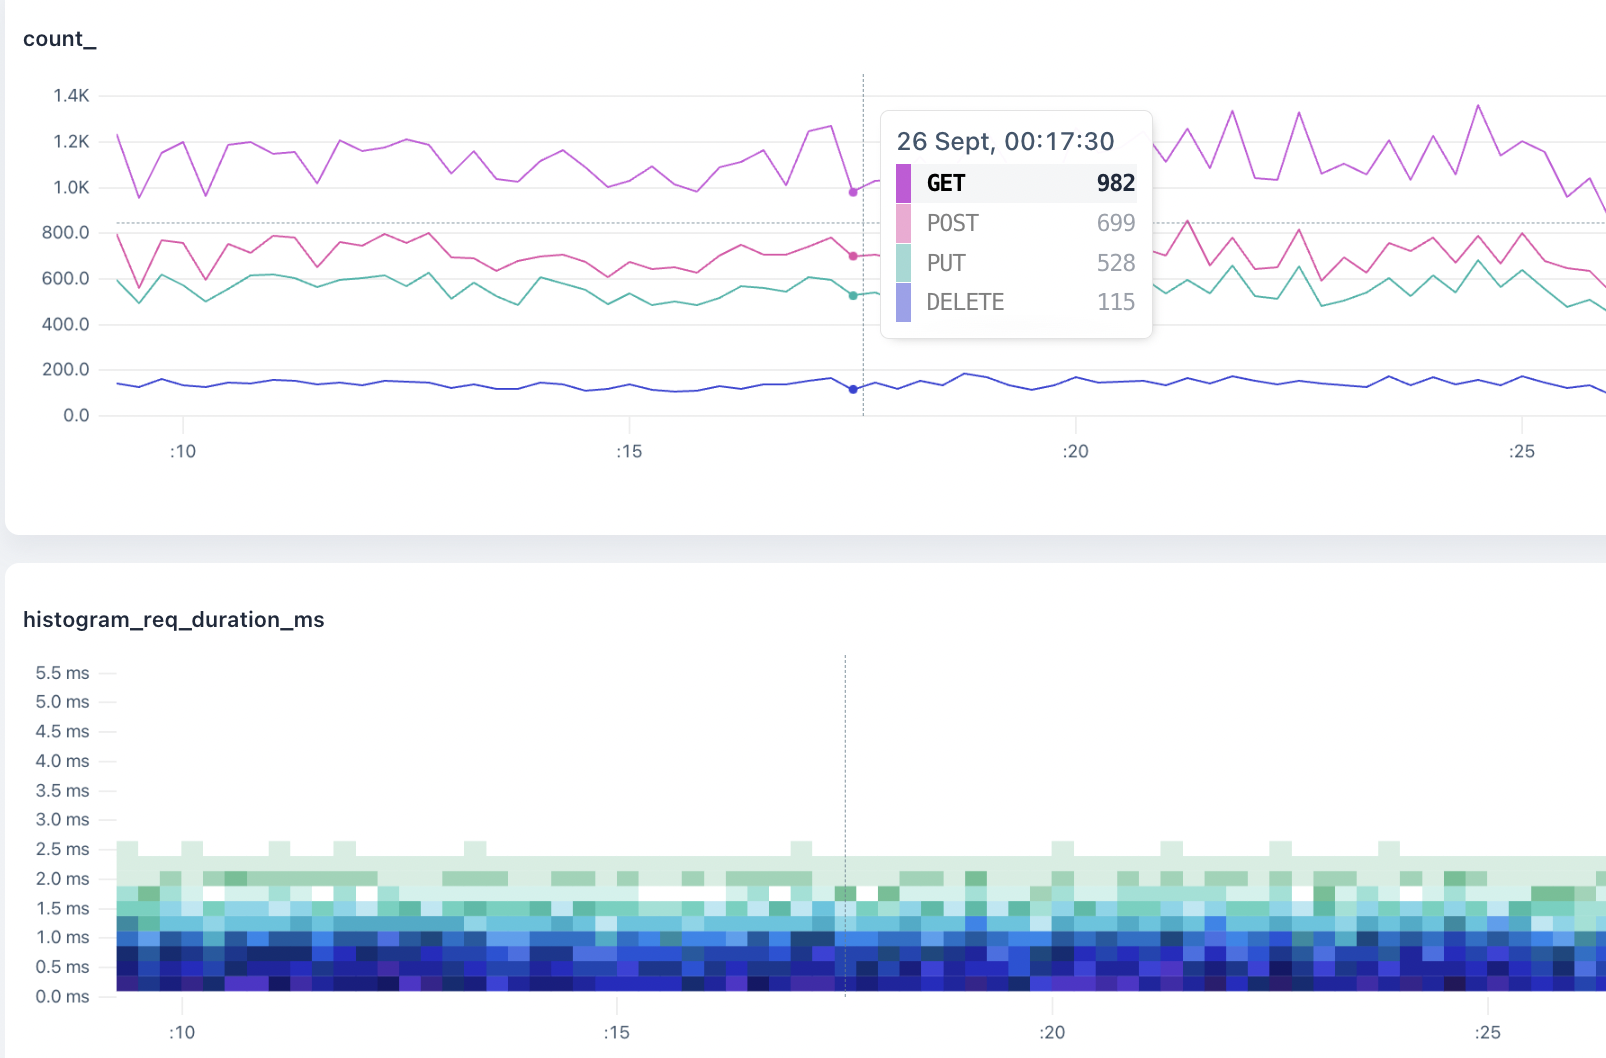
Improved chart rendering
We've fixed several chart rendering issues that affected data visibility and accuracy:
Log scale charts: Values of 1 are now properly visible on logarithmic scale charts. Previously, these values appeared nearly invisible due to how the y-axis minimum was calculated.
Scatter charts: Fixed a rendering error that occurred when scatter charts had null x-axis data.
Heatmap labels: Heatmaps now limit the number of labels displayed to prevent visual clutter.
Canvas supports builder queries
Canvas previously only worked with APL queries. You can now use it with builder queries too, bringing the same powerful visual exploration to your analytics workflows. The canvas automatically validates chart types against your builder configuration and preserves your queries in the URL for easy sharing. Whether you're building complex aggregations or simple filters, Canvas now adapts to your preferred query style.
More of our favorite changes
Improved ingestion reliability with smarter retry limits to prevent cascade failures during high load
When you copy or download query results as JSON, Axiom now automatically strips null values from the output.
Reserved datasets are now protected from accidental editing or deletion