Prerequisites
Create monitor list
- Go to the Dashboards tab and open the dashboard to which you want to add the monitor list.
- Click Add element in the top right corner.
- Click Monitor list from the list.
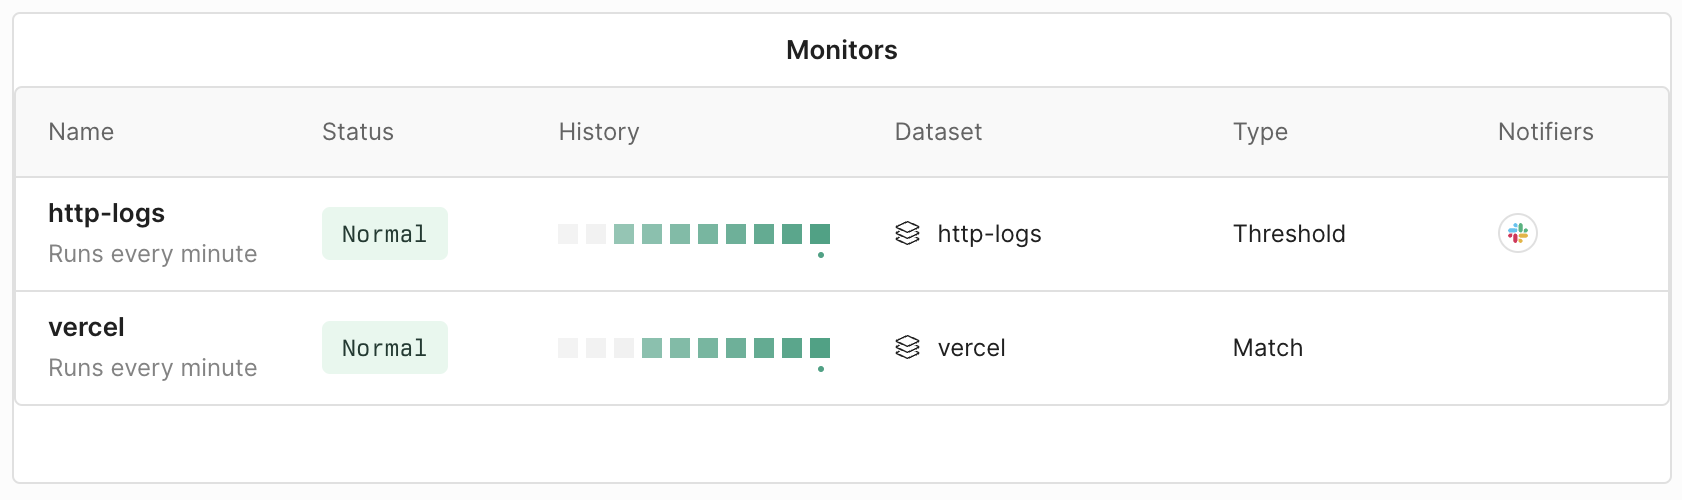
- In Columns, select the type of information you want to display for each monitor:
- Status displays if the monitor state is normal, triggered, or turned off.
- History provides a visual overview of the recent runs of the monitor. Green squares mean normal operation and red squares mean triggered state.
- Dataset is the name of the dataset on which the monitor operates.
- Type is the type of the monitor.
- Notifiers displays the notifiers connected to the monitor.
- From the list, select the monitors you want to display on the dashboard.
- Click Save.