Choose a dataset
The default view is one where you can easily see which datasets are available and also see some recent saved queries in case you want to jump directly into a stream: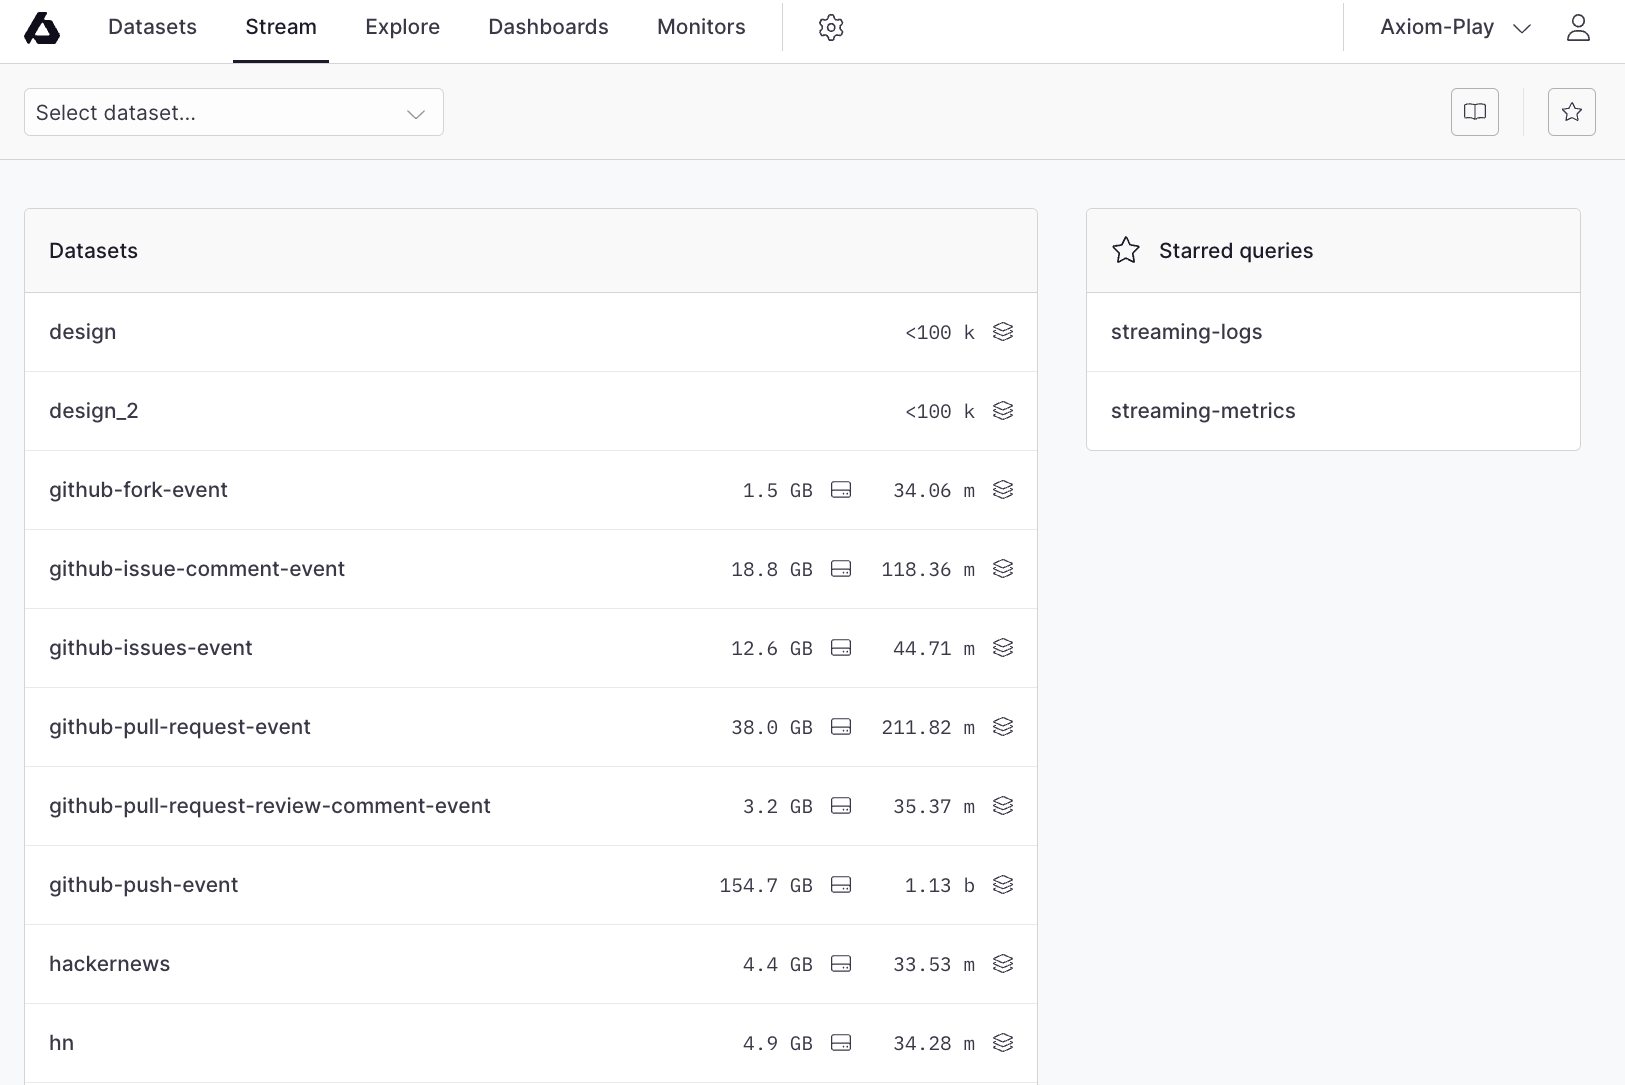
Datasets overview
Event stream
Upon selecting a dataset, you are immediately taken to the live event stream for that dataset: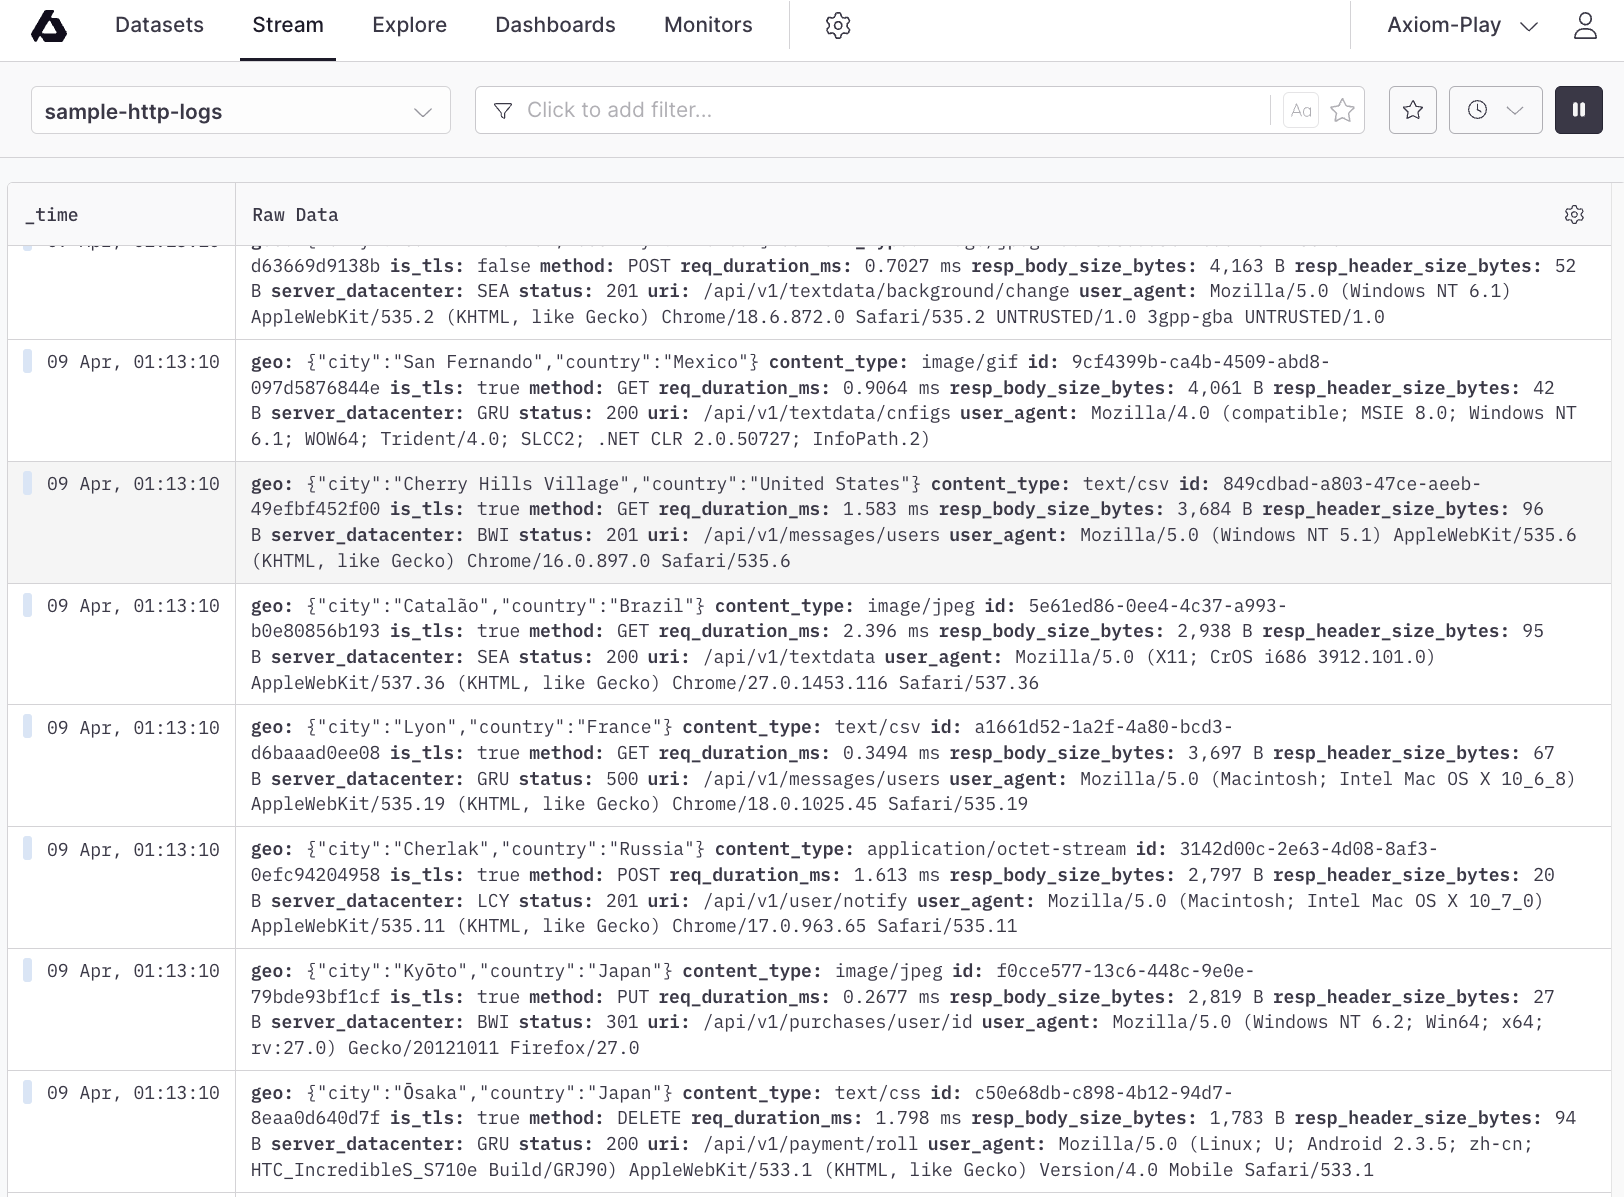
Event stream
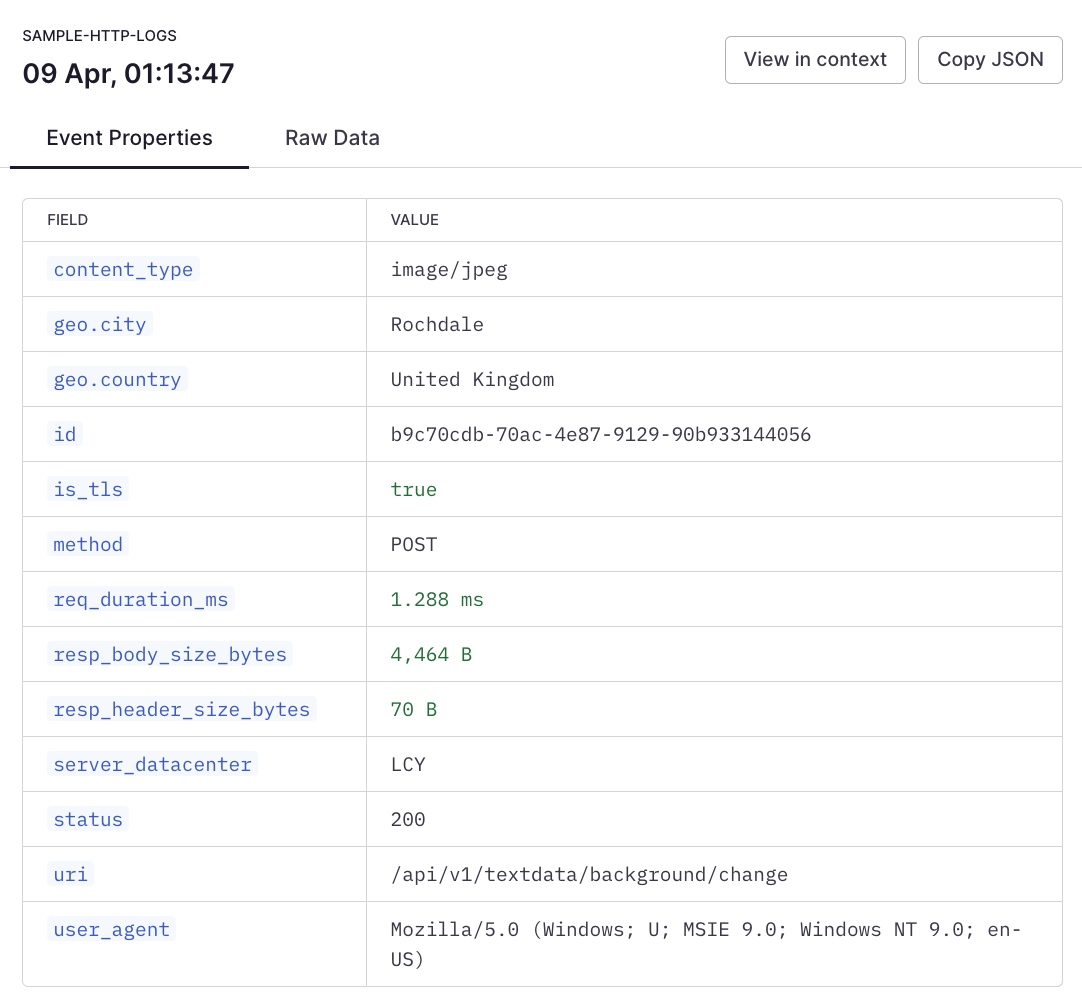
Event details
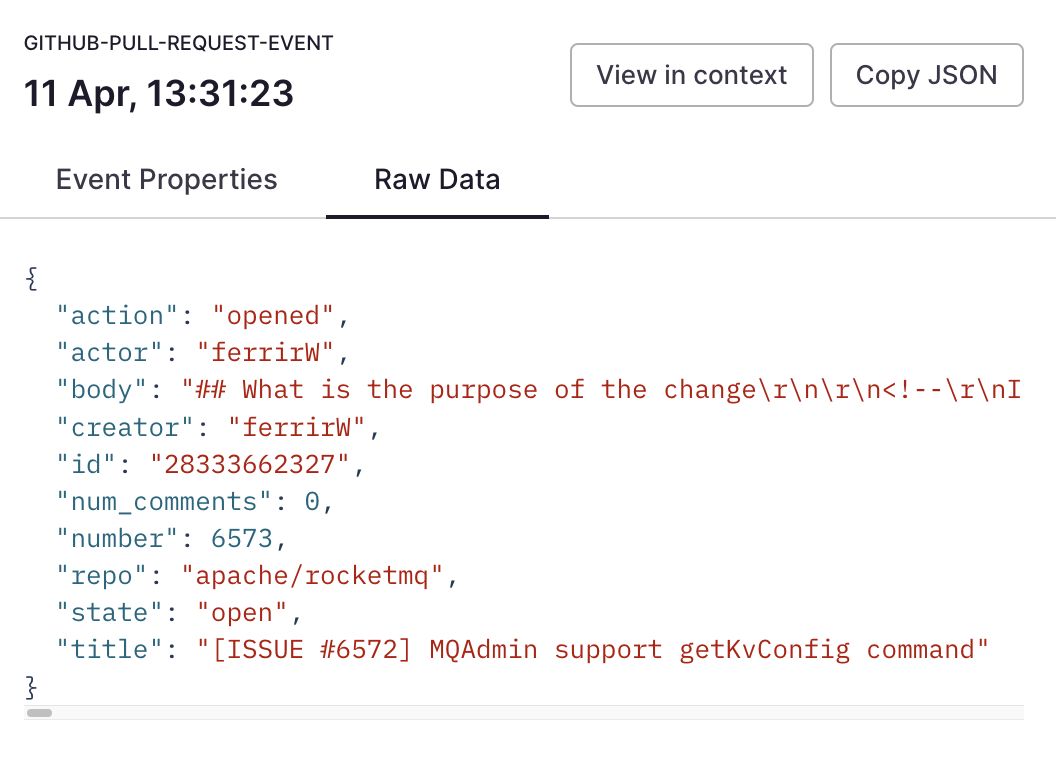
Event details
Filter data
The Stream tab provides access to a powerful filter builder right on the toolbar: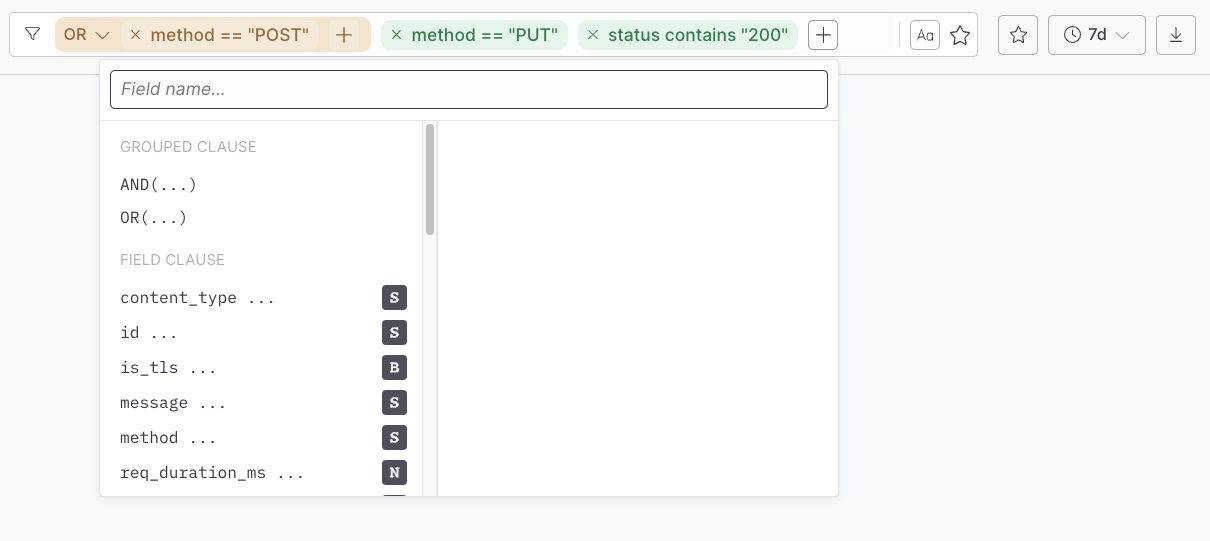
Filter bar
Time range selection
The stream has two time modes:- Live stream (default)
- Time range
Return to Live button
View settings
The Stream tab is customizable via the view settings menu: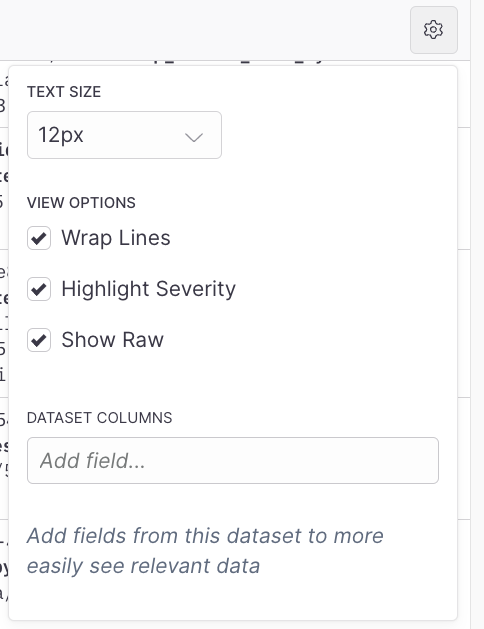
View menu
- Text size used in the stream
- Wrap lines
- Highlight severity (this is automatically extracted from the event)
- Show the raw event details
- Fields to display in their own column
Saved queries
The saved queries slide-out is activated via the toolbar: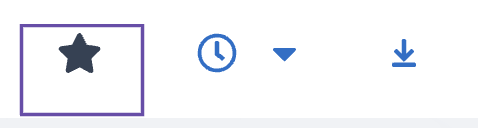
Saved queries
Highlight severity
The Stream tab allows you to easily detect warnings and errors in your logs by highlighting the severity of log entries in different colors. To highlight the severity of log entries:- Specify the log level in the data you send to Axiom. For more information, see Requirements for log level fields.
- In the Stream tab, click in the top right, and then select Highlight severity.
warn and error in the keys of the fields mentioned in Step 1, and then displays warnings in orange and errors in red.