Explore traces
Learn how to observe how requests propagate through your distributed systems, understand the interactions between microservices, and trace the life of the request through your app’s architecture.
Distributed tracing in Axiom allows you to observe how requests propagate through your distributed systems. This could involve a user request going through several microservices, and resources until the requested information is retrieved and returned. By tracing these requests, you’re able to understand the interactions between these microservices, pinpoint issues, understand latency, and trace the life of the request through your app’s architecture.
Traces and spans
A trace is a representation of a single operation or transaction as it moves through a system. A trace is made up of multiple spans.
A span represents a logical unit of work in the system with a start and end time. For example, an HTTP request handling process might be a span. Each span includes metadata like unique identifiers (trace_id and span_id), start and end times, parent-child relationships with other spans, and optional events, logs, or other details to help describe the span’s operation.
Trace schema overview
| Field | Type | Description |
|---|---|---|
trace_id | String | Unique identifier for a trace |
span_id | String | Unique identifier for a span within a trace |
parent_span_id | String | Identifier of the parent span |
name | String | Name of the span for example, the operation |
kind | String | Type of the span (for example, client, server, producer) |
duration | Timespan | Duration of the span |
error | Boolean | Whether this span contains an error |
status.code | String | Status of the span (for example, null, OK, error) |
status.message | String | Status message of the span |
attributes | Object | Key-value pairs providing additional metadata |
events | Array | Timestamped events associated with the span |
links | Array | Links to related spans or external resources |
resource | Object | Information about the source of the span |
This guide explains how you can use Axiom to analyze and interrogate your trace data from simple overviews to complex queries.
Browse traces with the OpenTelemetry app
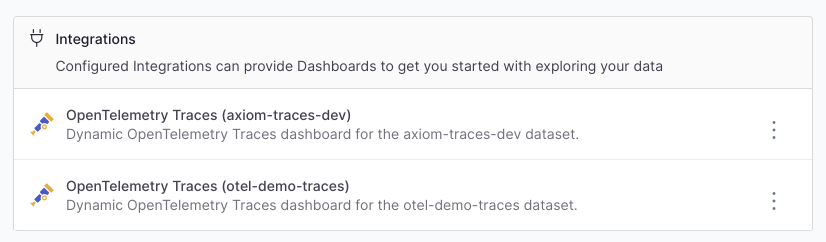
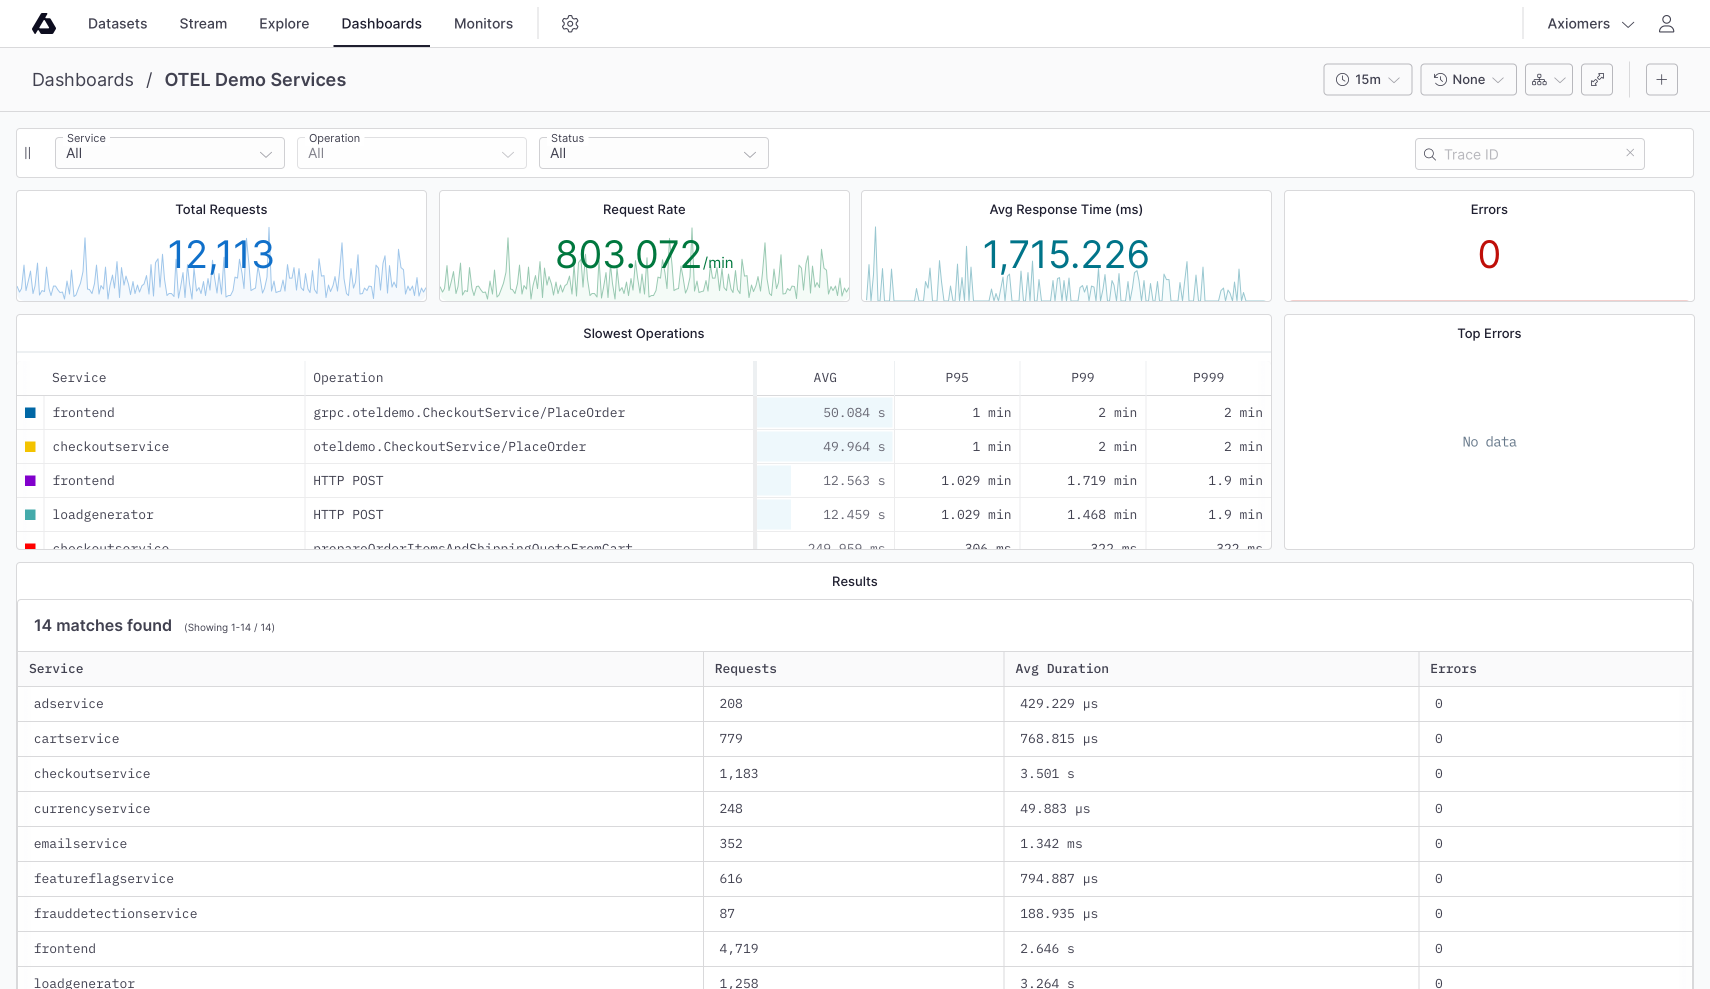
The Axiom OpenTelemetry app automatically detects any OpenTelemetry trace data flowing into your datasets and publishes an OpenTelemetry Traces dashboard to help you browse your trace data.
Navigate the app
- Use the Filter Bar at the top of the app to narrow the charts to a specific service or operation.
- Use the Search Input to find a trace ID in the selected time period.
- Use the Slowest Operations chart to identify performance issues across services and traces.
- Use the Top Errors list to quickly identify the worst-offending causes of errors.
- Use the Results table to get an overview and navigate between services, operations, and traces.
View a trace
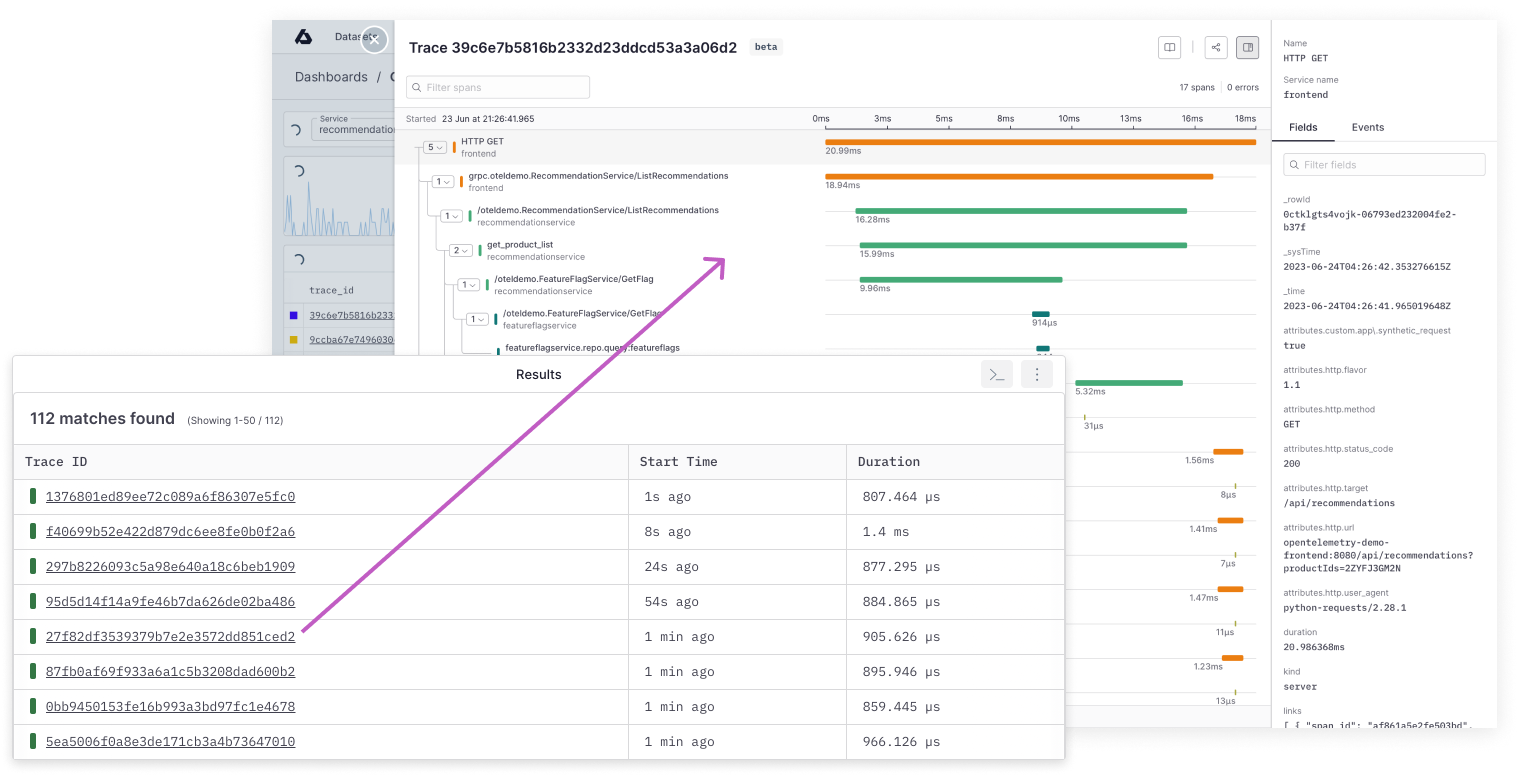
Click a trace ID in the results table to show the waterfall view. This view allows you to see that span in the context of the entire trace from start to finish.
Customize the app
To customize the app, use the fork button to create an editable duplicate for you and your team.
Query traces
In Axiom, trace events are just like any other events inside datasets. This means they’re directly queryable in the UI. While this is can be a powerful experience, it’s important to note some important details to consider before querying:
-
Directly aggregating upon the
durationfield produces aggregate values across every span in the dataset. This is usually not the desired outcome when you want to inspect a service’s performance or robustness. -
For request, rate, and duration aggregations, it’s best to only include the root span using
isnull(parent_span_id).
Waterfall view of traces
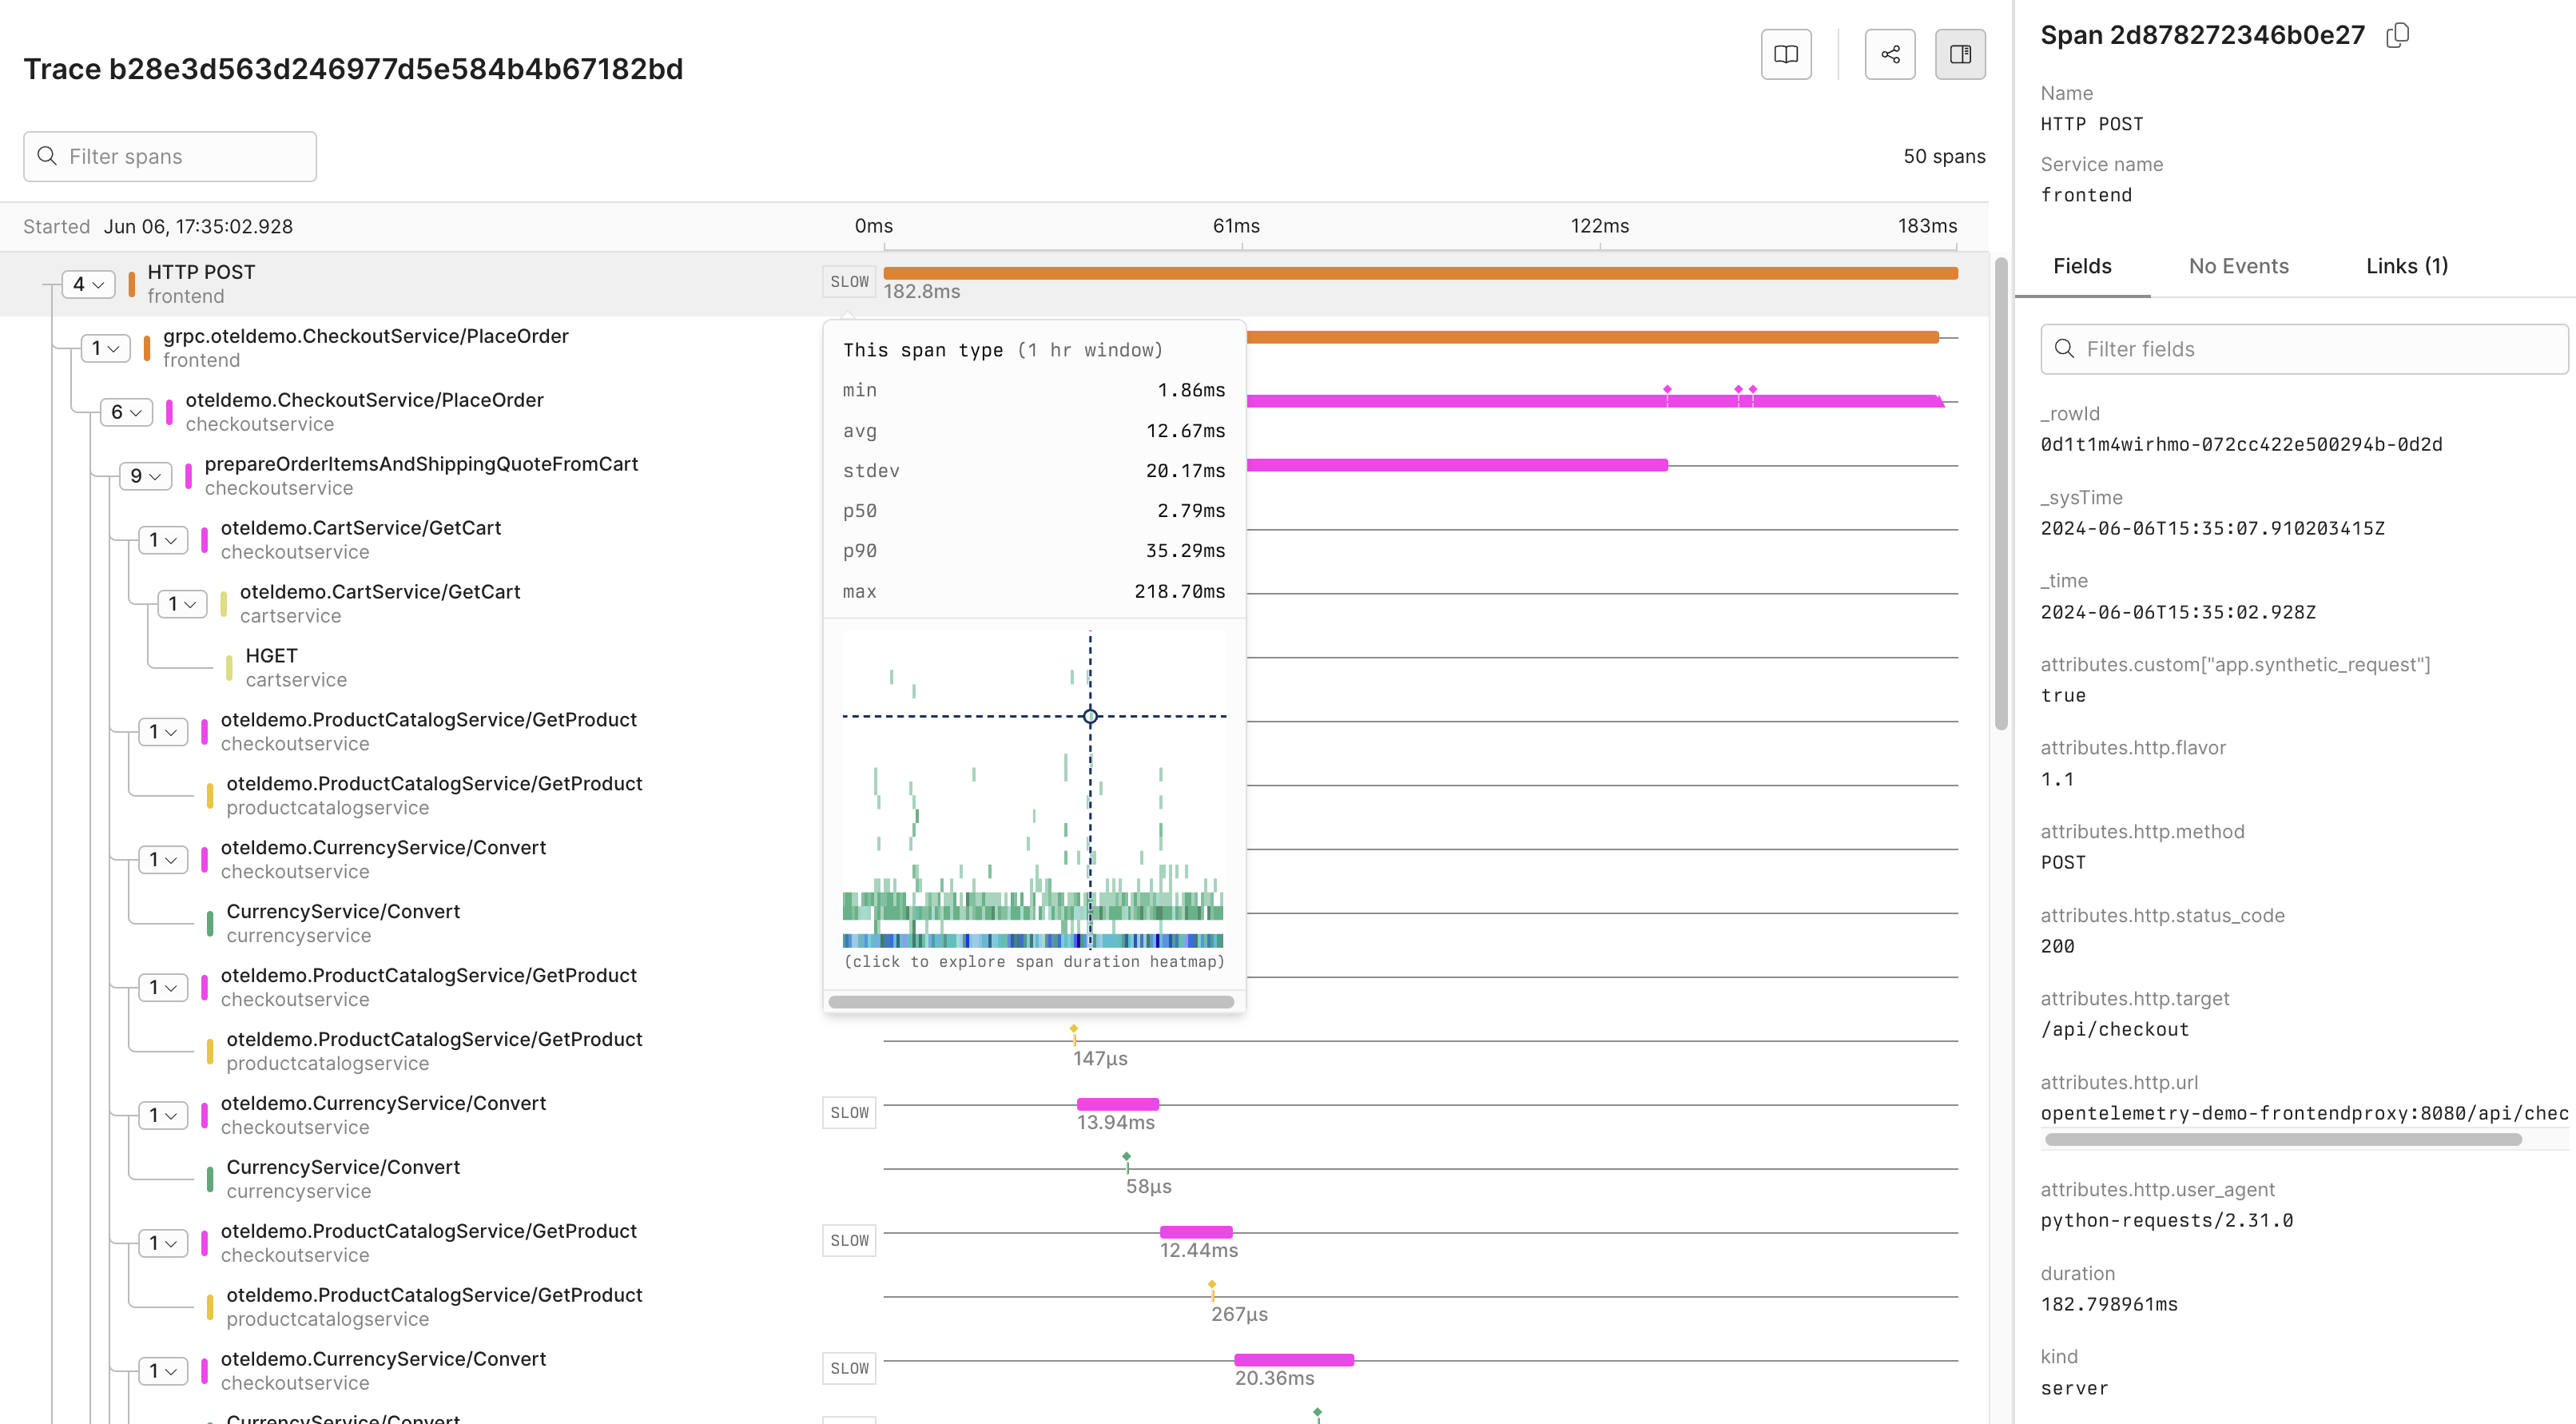
To see how spans in a trace are related to each other, explore the trace in a waterfall view. In this view, each span in the trace is correlated with its parent and child spans.
Traces in OpenTelemetry Traces dashboard
To explore spans within a trace using the OpenTelemetry Traces app, follow these steps:
- Click the
Dashboardstab. - Click
OpenTelemetry Traces. - In the
Slowest Operationschart, click the service that contains the trace. - In the list of trace IDs, click the trace you want to explore.
- Explore how spans within the trace are related to each other in the waterfall view. To reveal additional options such as collapsing and expanding child spans, right-click a span.
To try out this example, go to the Axiom Playground.
Traces in Query tab
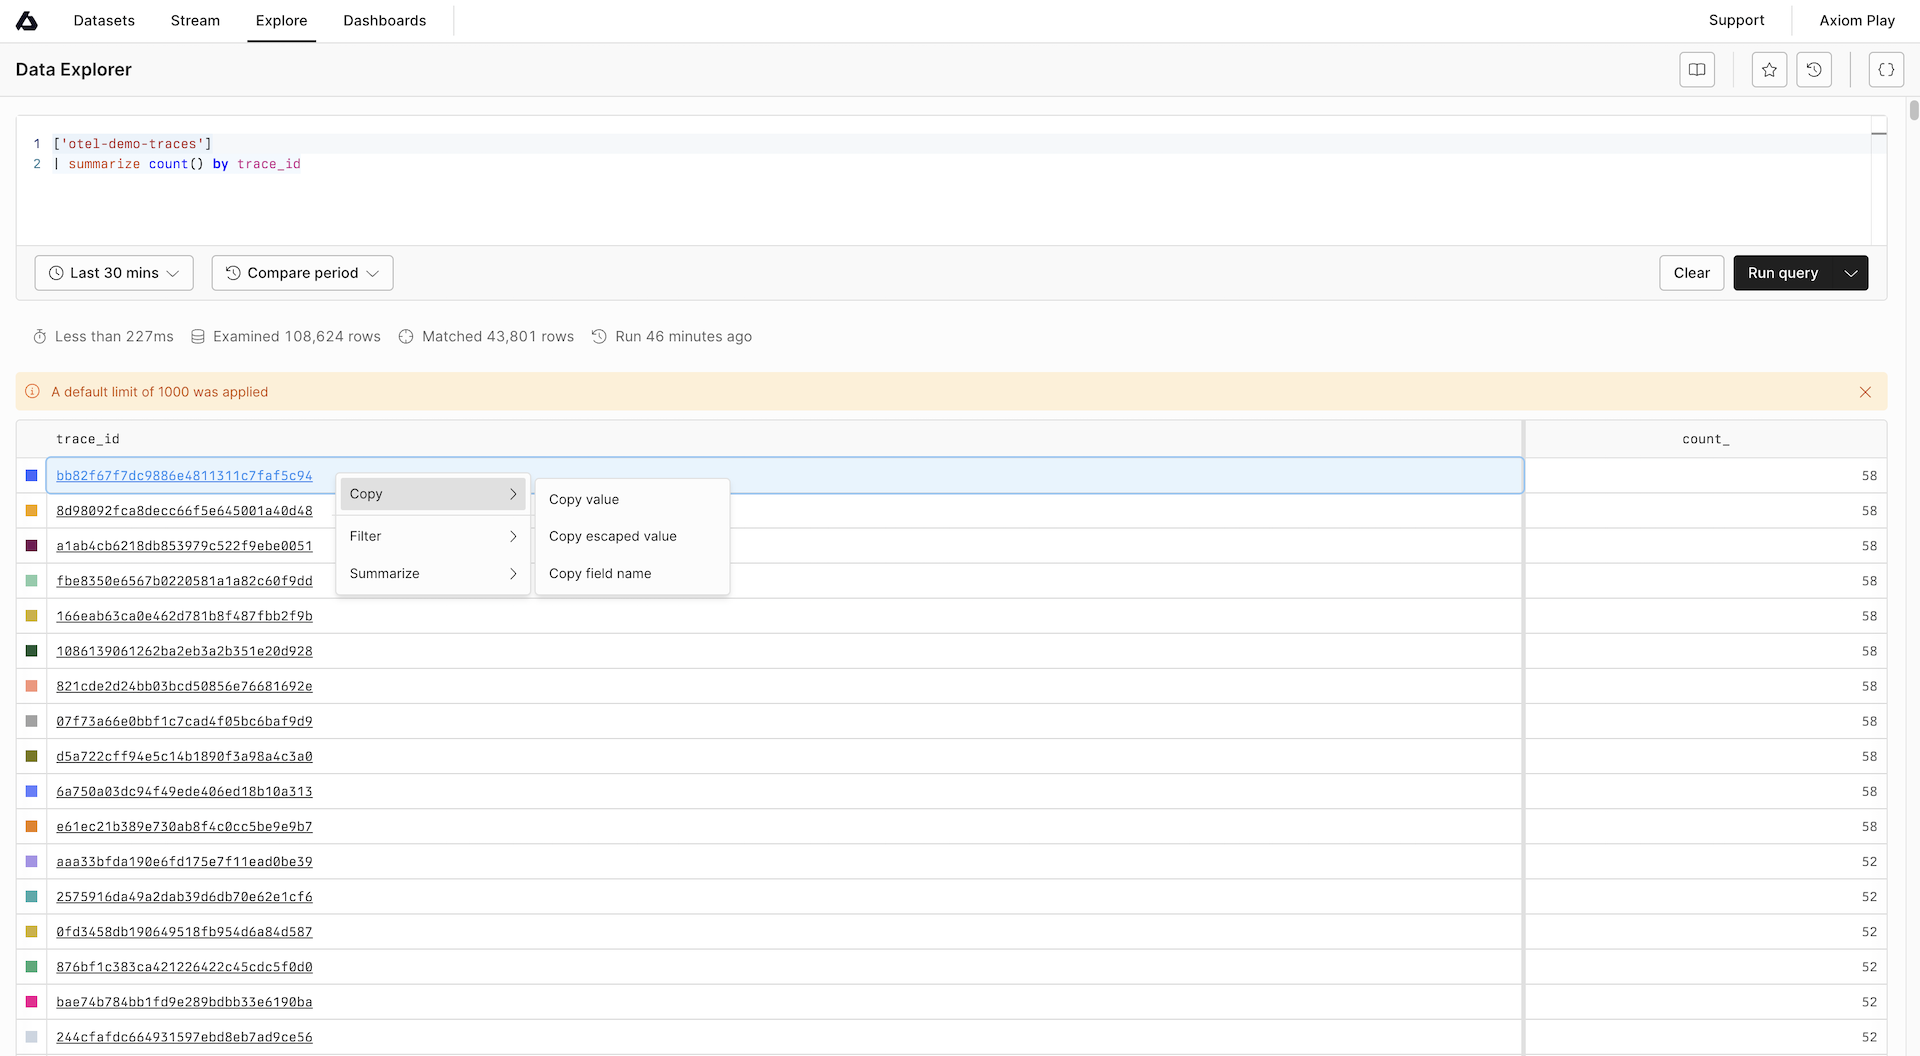
To access the waterfall view from the Query tab, follow these steps:
-
Ensure the dataset you work with has trace data.
-
Click the Query tab.
-
Run a query that returns the
_timeandtrace_idfields. For example, the following query returns the number of spans in each trace:APL -
In the list of trace IDs, click the trace you want to explore. To reveal additional options such as copying the trace ID, right-click a trace.
-
Explore how spans within the trace are related to each other in the waterfall view. To reveal additional options such as collapsing and expanding child spans, right-click a span. Event names are displayed on the timeline for each span.
To try out this example, go to the Axiom Playground.
Customize waterfall view
To toggle the display of the span details on the right, click Span details.
To resize the width of the waterfall view and the span details panel, drag the border.
Span duration histogram
In the waterfall view of traces, Axiom warns you about slow and fast spans. These spans are outliers because they’re at least a standard deviation over or under the average duration of spans that have the same span name and service name. Hold the pointer over the SLOW or FAST label to see additional information about the span type such as average and maximum duration. In addition, Axiom displays a histogram about the durations of spans that have the same span name and service name as the span you selected. By default, the histogram shows a one-hour window around the selected span.
The span duration histogram can be useful in the following cases, among others:
- You look at a span and you’re not familiar with the typical behavior of the service that created it. You want to know if you look at something normal in terms of duration or an outlier. The histogram helps you determine if you look at an outlier and might drill down further.
- You’ve found an outlier. You want to investigate and look at other outliers. The histogram shows you what the baseline is and what’s not normal in terms of duration. You want to filter for the outliers and see what they have in common.
- You want to see if there was a recent change in the typical duration for the selected span type.
To narrow the time range of the histogram, click and select an area in the histogram.
Example queries
Below are a collection of queries that can help get you started with traces inside Axiom. Queries are all executable on the Axiom Play sandbox.
Number of requests, average response
Top five slowest services by operation
Top five errors per service and operation
Semantic conventions
OpenTelemetry semantic conventions specify standard attribute names and values for different kinds of operations and data. For more information on Axiom’s support for OTel semantic conventions and what it means for your data, see Semantic conventions.
Span links
Span links allow you to associate one span with one or more other spans, establishing a relationship between them that indicates the operation of one span depends on the other. Span links can connect spans within the same trace or across different traces.
Span links are useful for representing asynchronous operations or batch-processing scenarios. For example, an initial operation triggers a subsequent operation, but the subsequent operation may start at some unknown later time or even in a different trace. By linking the spans, you can capture and preserve the relationship between these operations, even if they’re not directly connected in the same trace.
How it works
Span links in Axiom are based on the OpenTelemetry specification. When instrumenting your code, you create span links using the OpenTelemetry API by passing the SpanContext (containing trace_id and span_id) of the span to which to link. Links are specified when starting a new span by providing them in the span configuration. The OpenTelemetry SDK includes the link information when exporting spans to Axiom. Links are recorded at span creation time so that sampling decisions can consider them.
View span links
-
Run the following APL query to find traces with span links, for example:
-
Click on a trace in the results and select the
trace_id. -
In the trace details view, find the links section. This displays the
trace_idandspan_idassociated with each linked span, as well as other attributes of the link. -
Click View span to navigate to a linked span, either in the same trace or a different trace.