
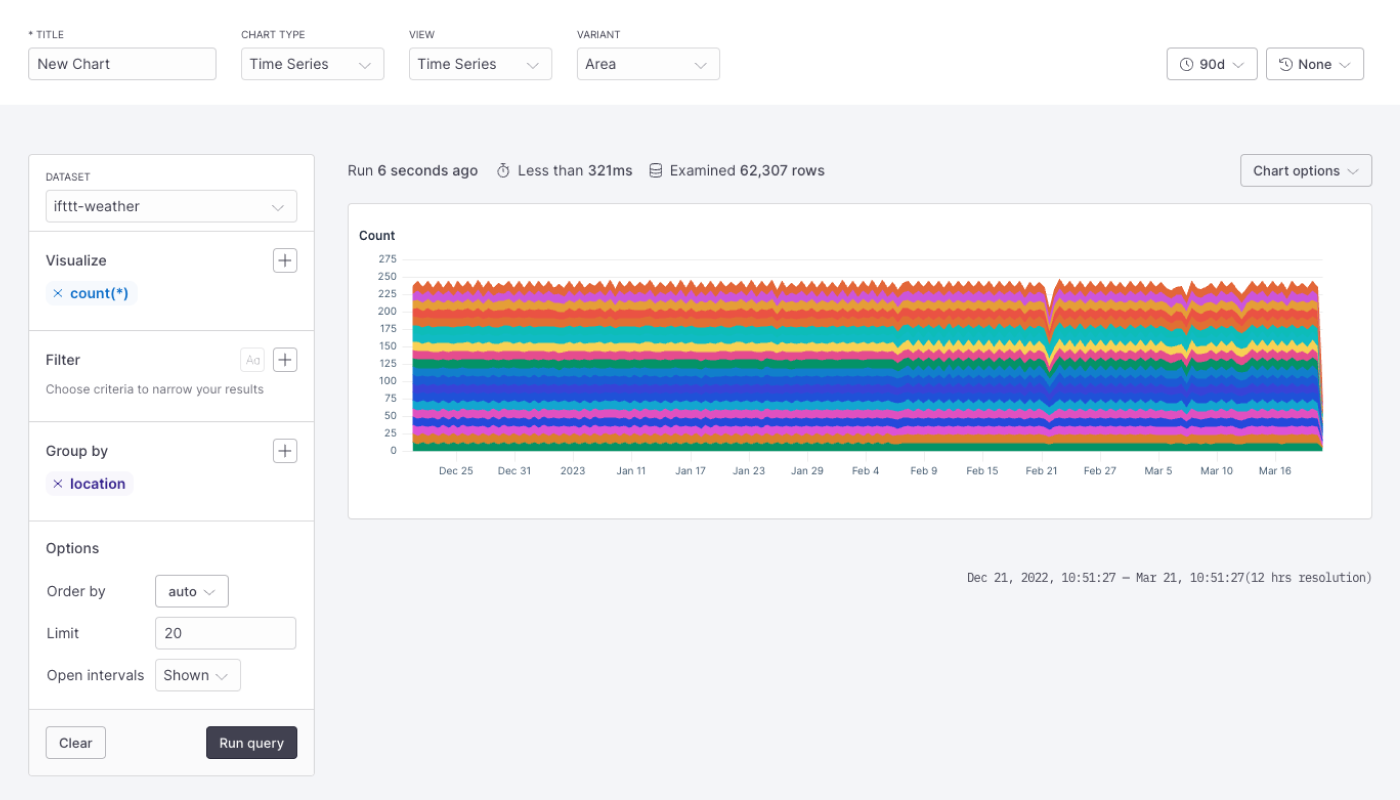
Axiom’s new chart variant area enables you to identify log patterns and generate advanced visualizations from your logs using stacked charts. With stacked charts, you can discover trends and compare query patterns from your log data visualization in relative time.
Stacked charts are stacked on top of each other, and by using stacked charts, you can now aggregate your query accurately.
Check out the documentation to learn more.