What’s Cloudflare Logpush?
Cloudflare Logpush enables Cloudflare users to automatically export their logs in JSON format to a variety of endpoints. This feature is incredibly useful for analytics, auditing, debugging, and monitoring the performance and security of websites. Types of logs you can export include HTTP request logs, firewall events, and more.Installing Cloudflare Logpush app
Prerequisites
- An active Cloudflare Enterprise account
- API token or global API key
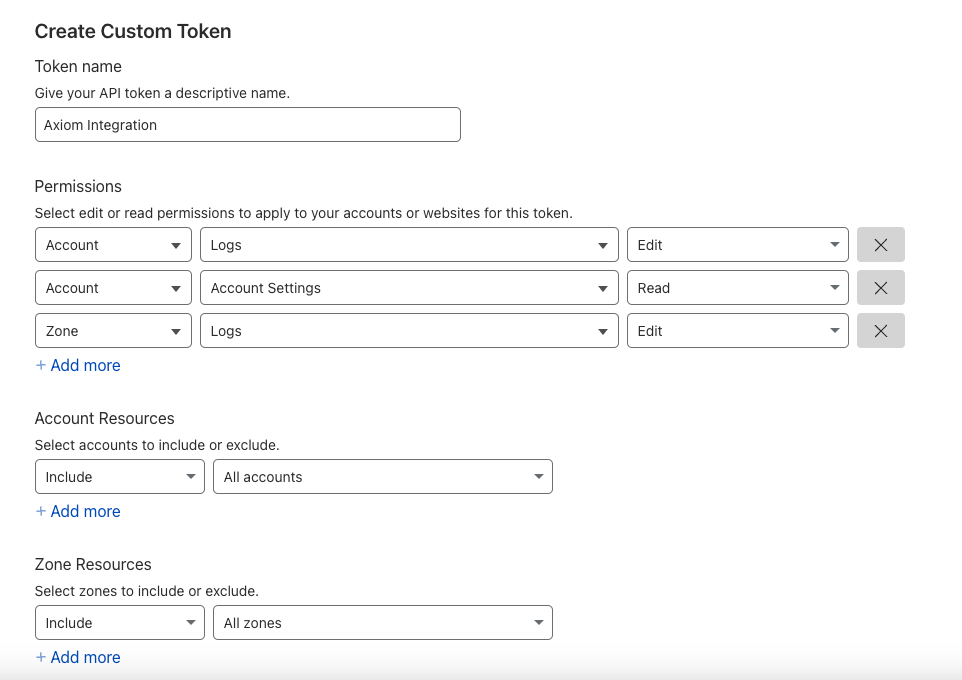
- Logs: Edit
- Account settings: Read
Zero Trust datasets require an additional permission. To create Logpush jobs for Cloudflare Zero Trust datasets (Access, Gateway, and DEX) — for example Access requests, Gateway DNS, Gateway HTTP, Gateway Network, and Zero Trust Network Session Logs — your token must also have the Zero Trust: PII Read permission in addition to Logs: Edit. These datasets can contain personally identifiable information (such as private IP addresses, user names, and device names), and Cloudflare blocks the job with a
missing required permissions error when this permission isn’t granted.The standard Administrator role includes Logs: Edit but not Zero Trust PII access, so an admin or owner account alone isn’t enough. A Super Administrator must assign the Cloudflare Zero Trust PII role to the user (or grant the token the Zero Trust: PII Read permission) before these jobs can be created. If you don’t use Cloudflare Zero Trust, Gateway, or Access, you can leave these datasets unselected.Steps
- Log in to Cloudflare, go to your Cloudflare dashboard, and then select the Enterprise zone (domain) you want to enable Logpush for.
- Optionally, set filters and fields. You can filter logs by field (like Client IP, User Agent, etc.) and set the type of logs you want (for example, HTTP requests, firewall events).
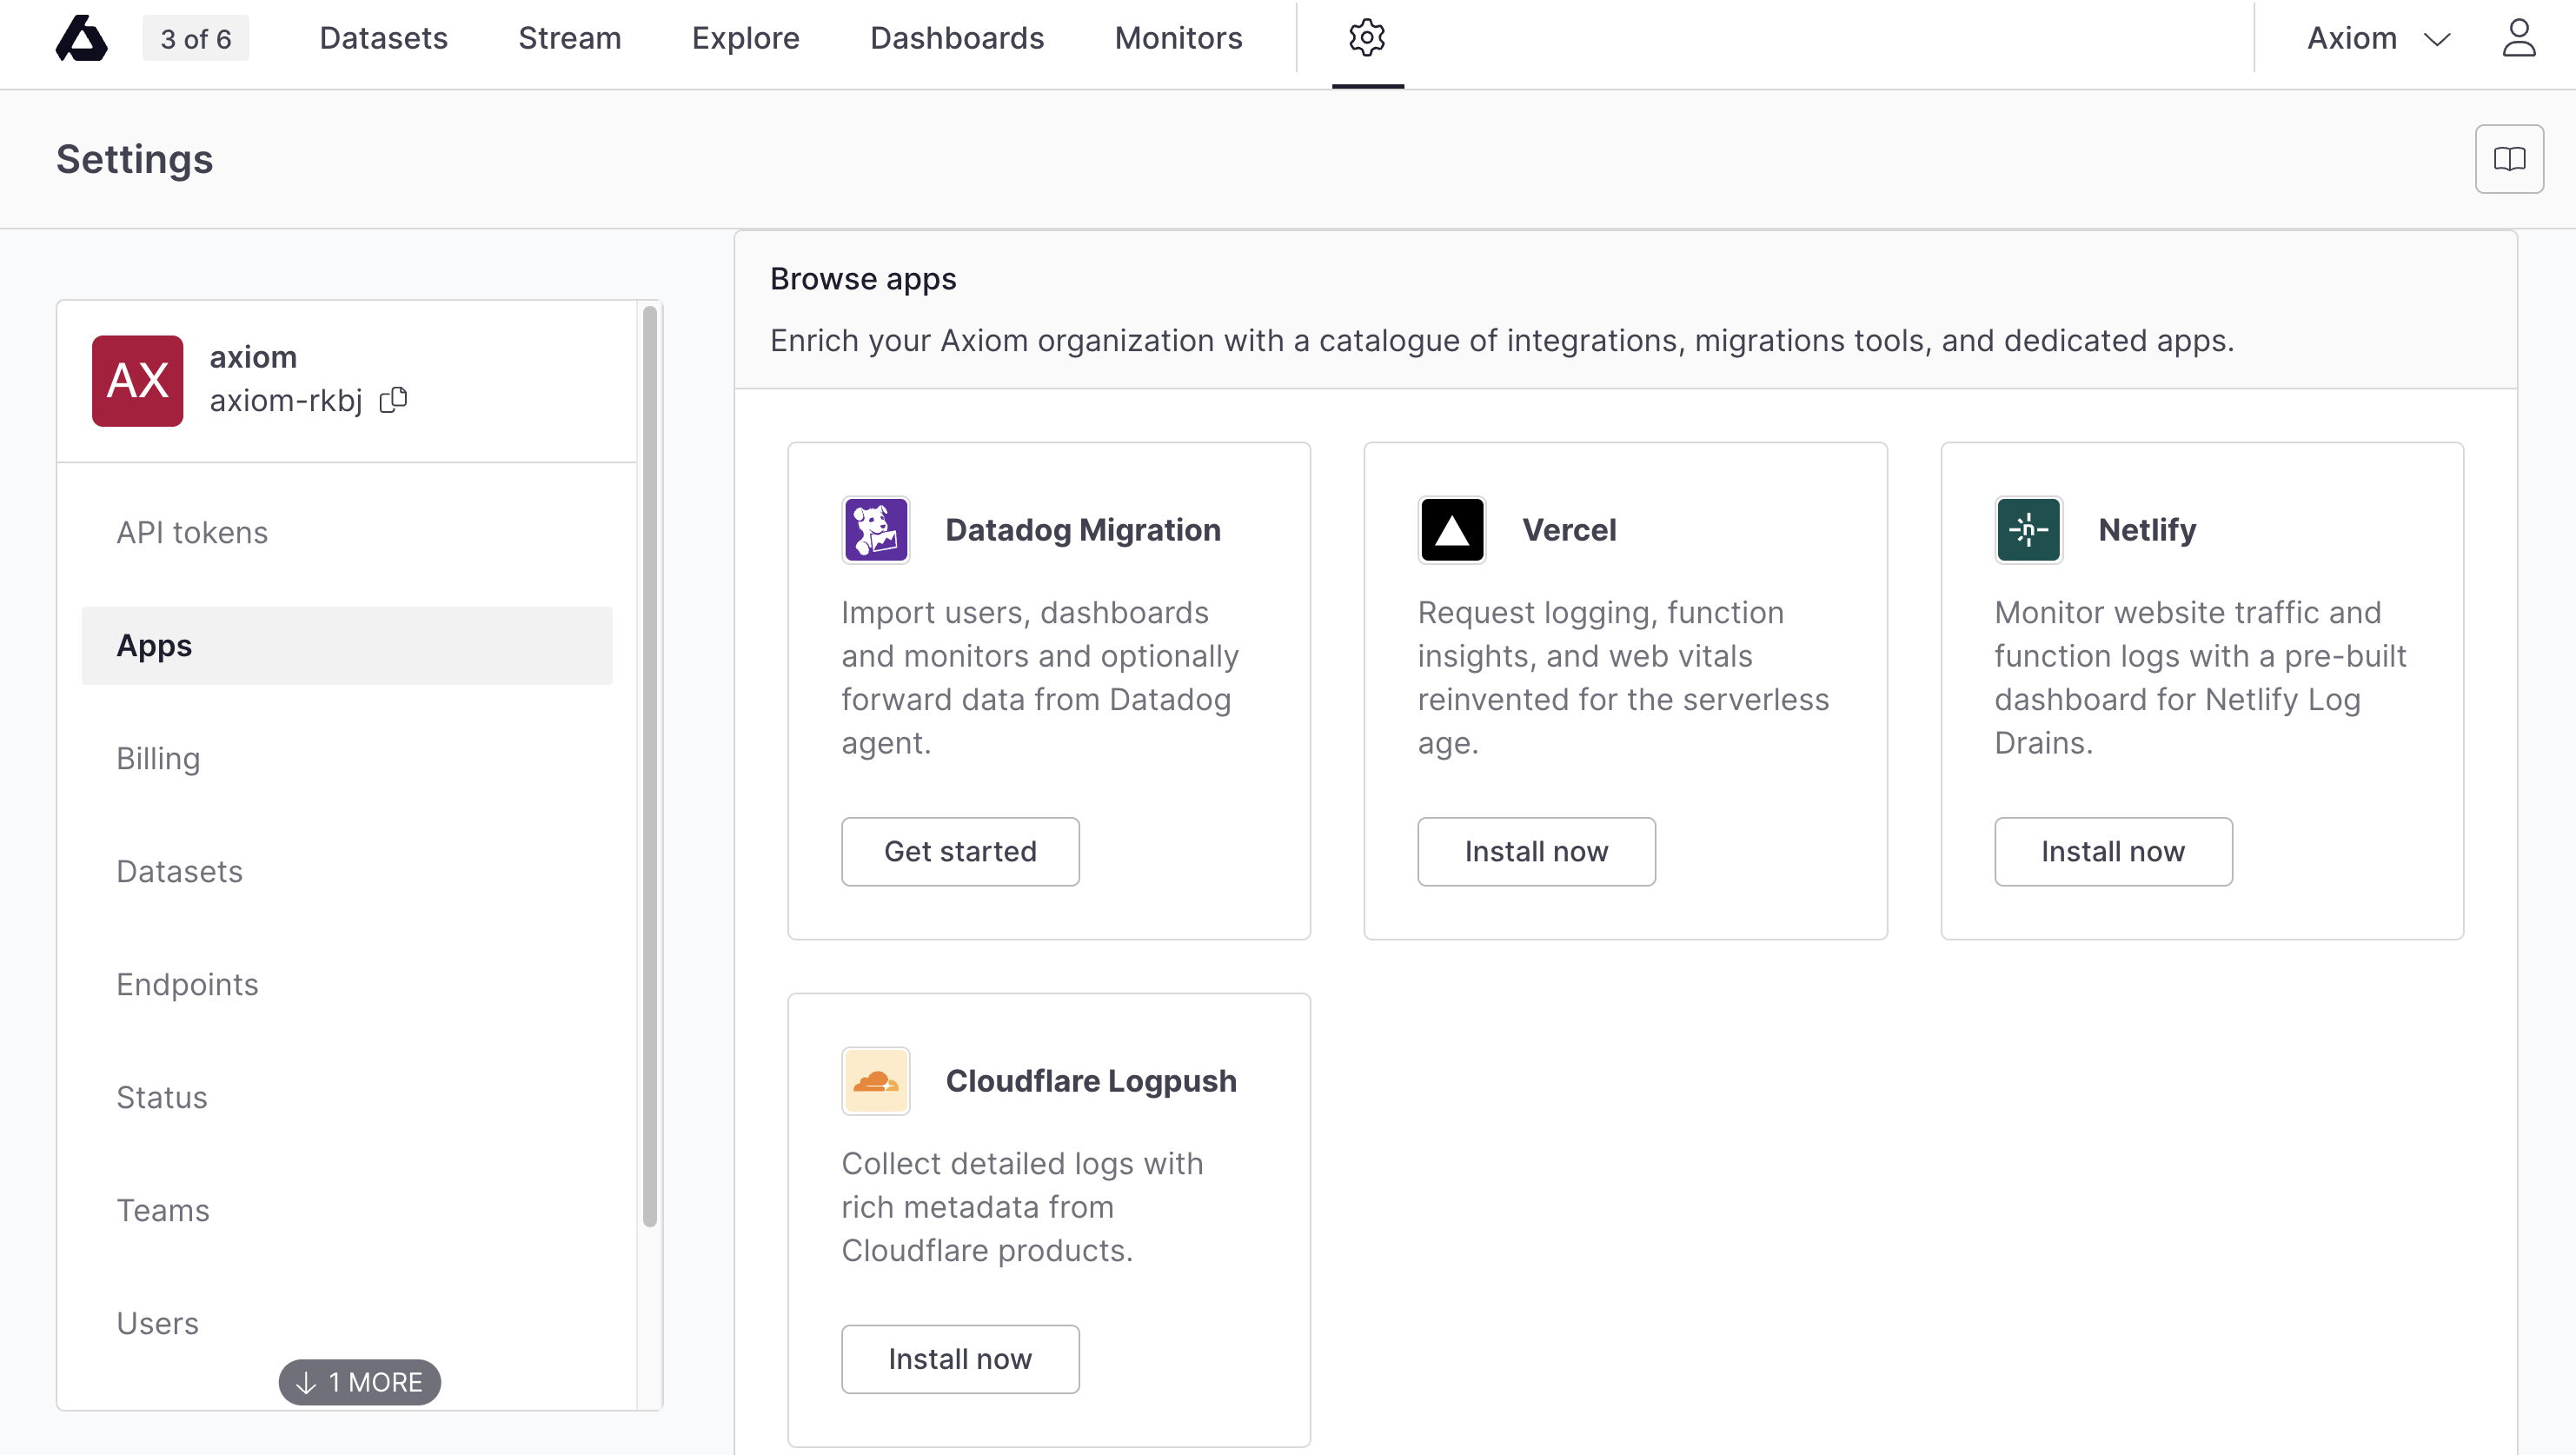
- In Axiom, click Settings, select Apps, and install the Cloudflare Logpush app with the token you created from the profile settings in Cloudflare.
- You see your available accounts and zones. Select the Cloudflare datasets you want to subscribe to.
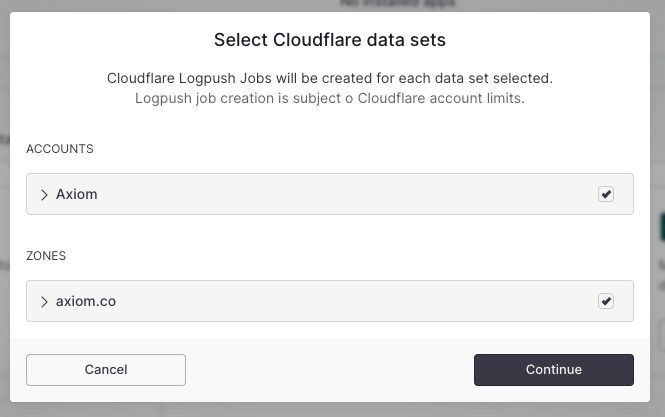
- The installation uses the Cloudflare API to create Logpush jobs for each selected dataset.
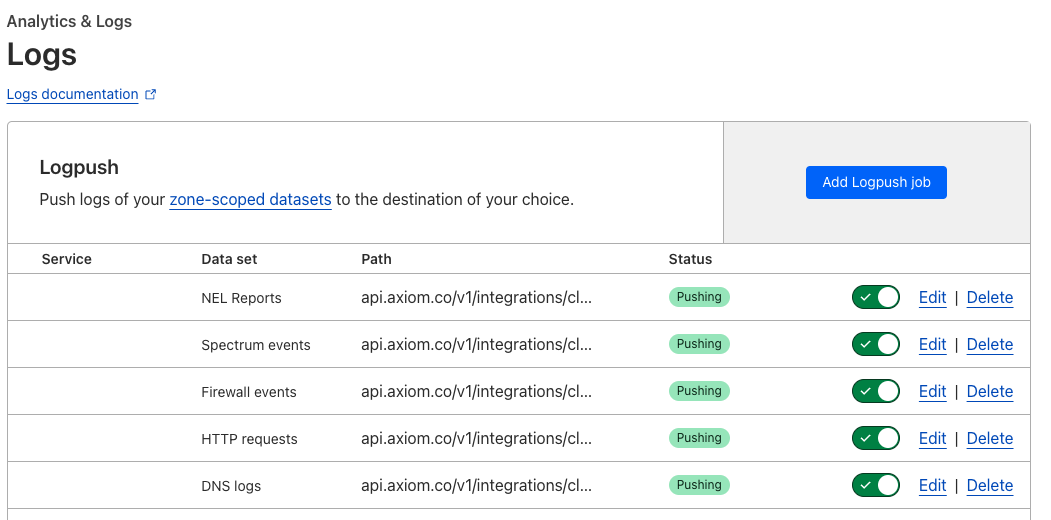
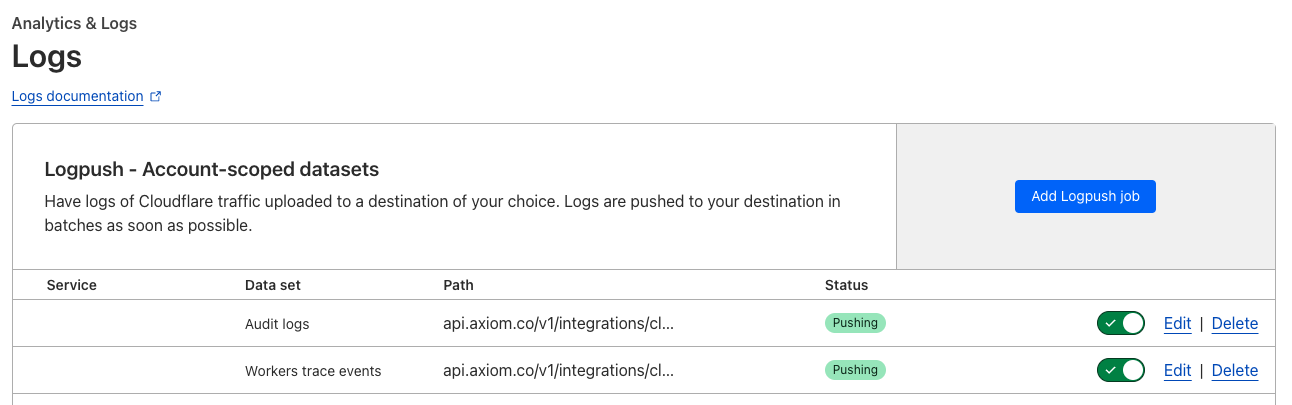
- After the installation completes, you can find the installed Logpush jobs at Cloudflare.
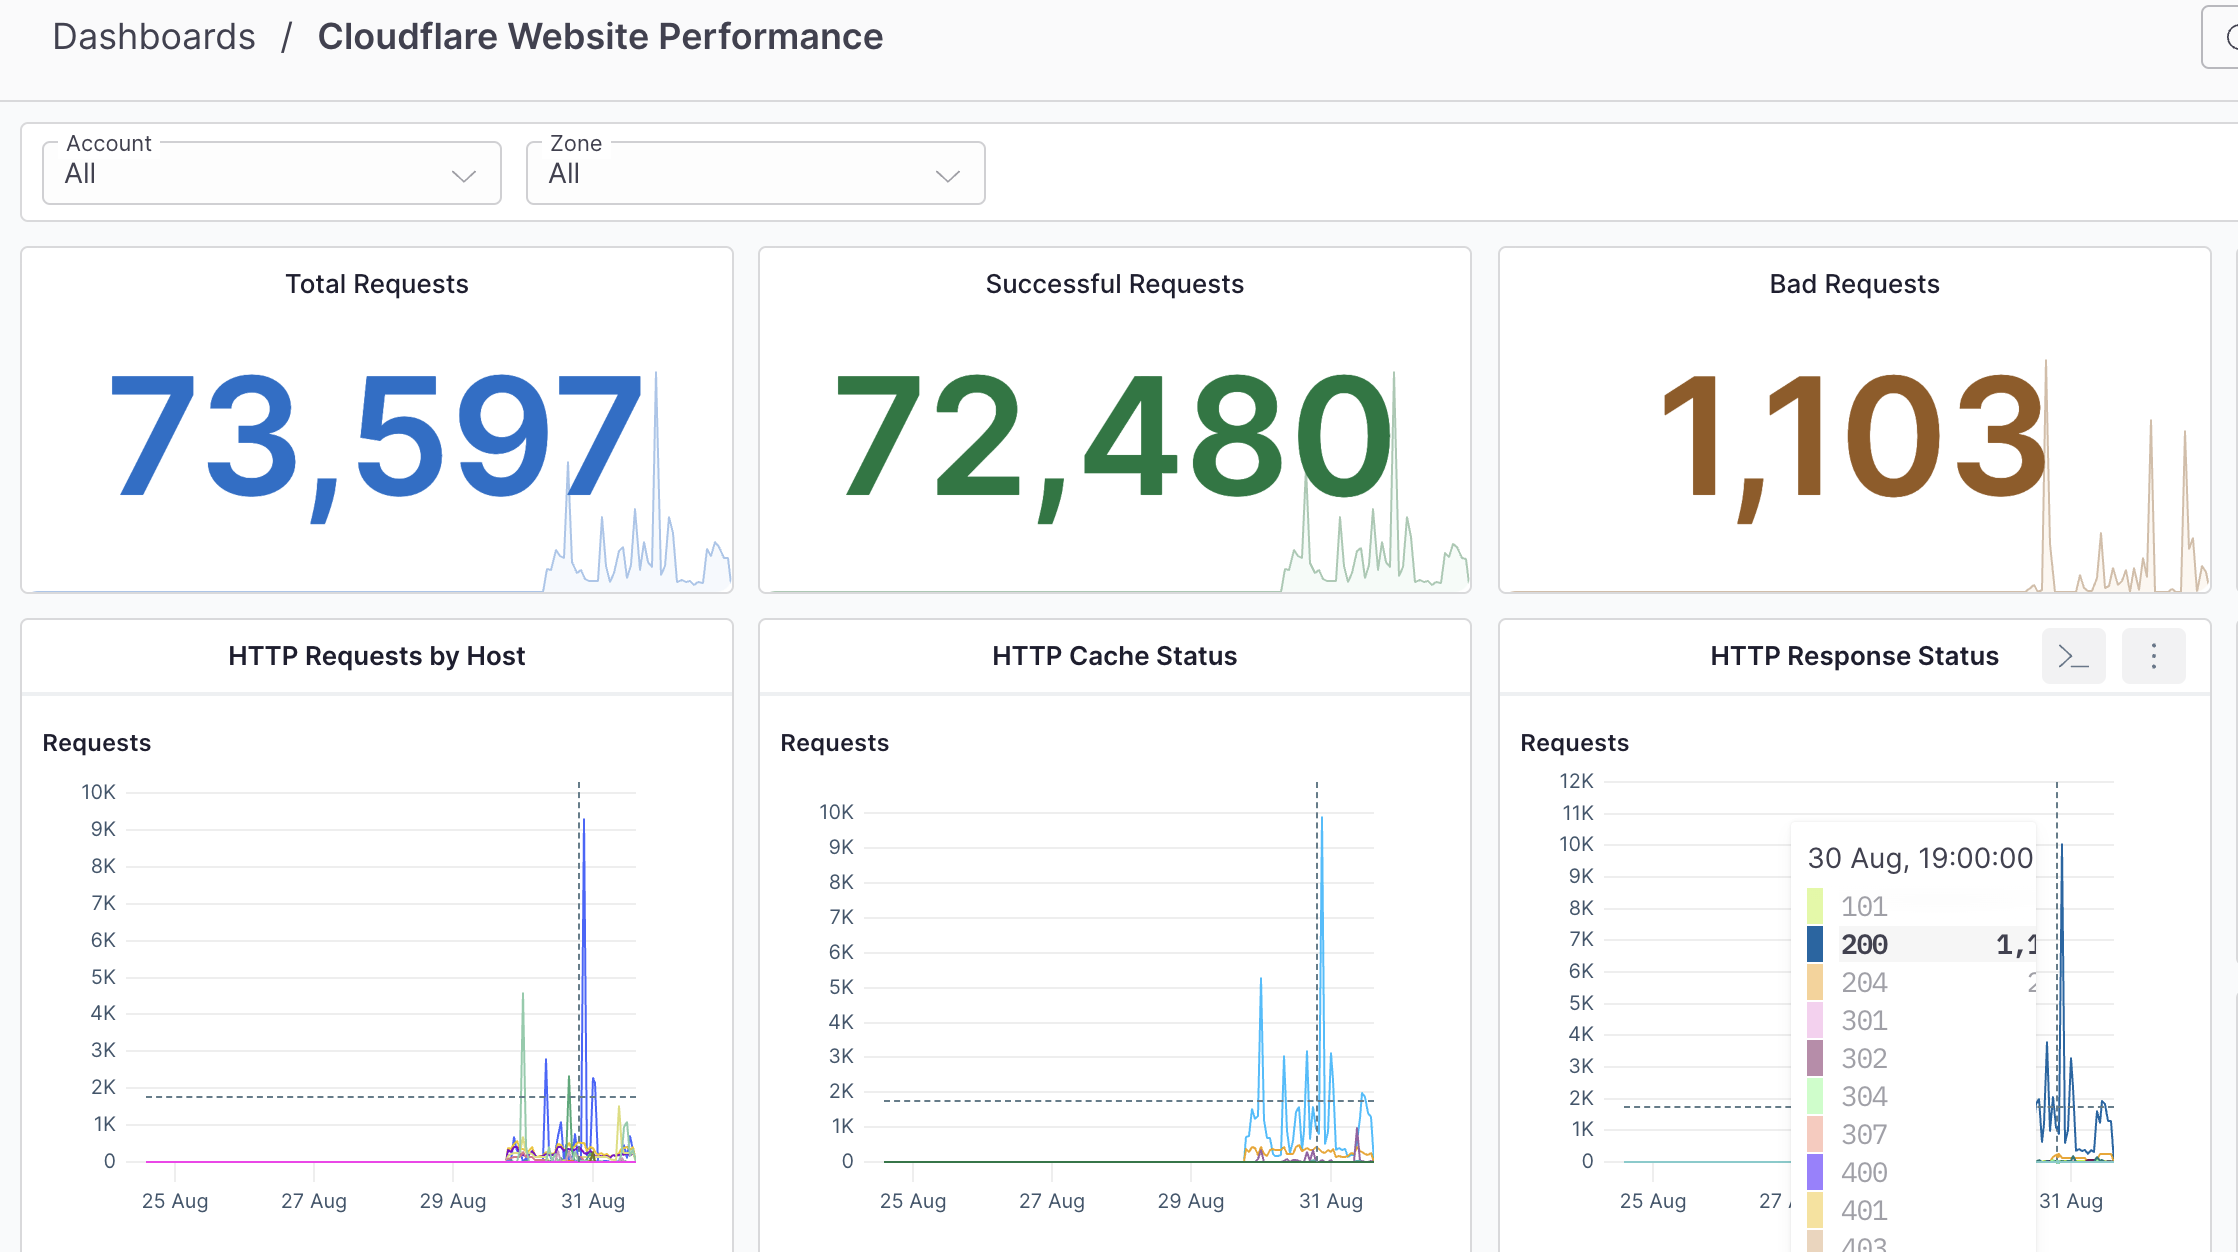
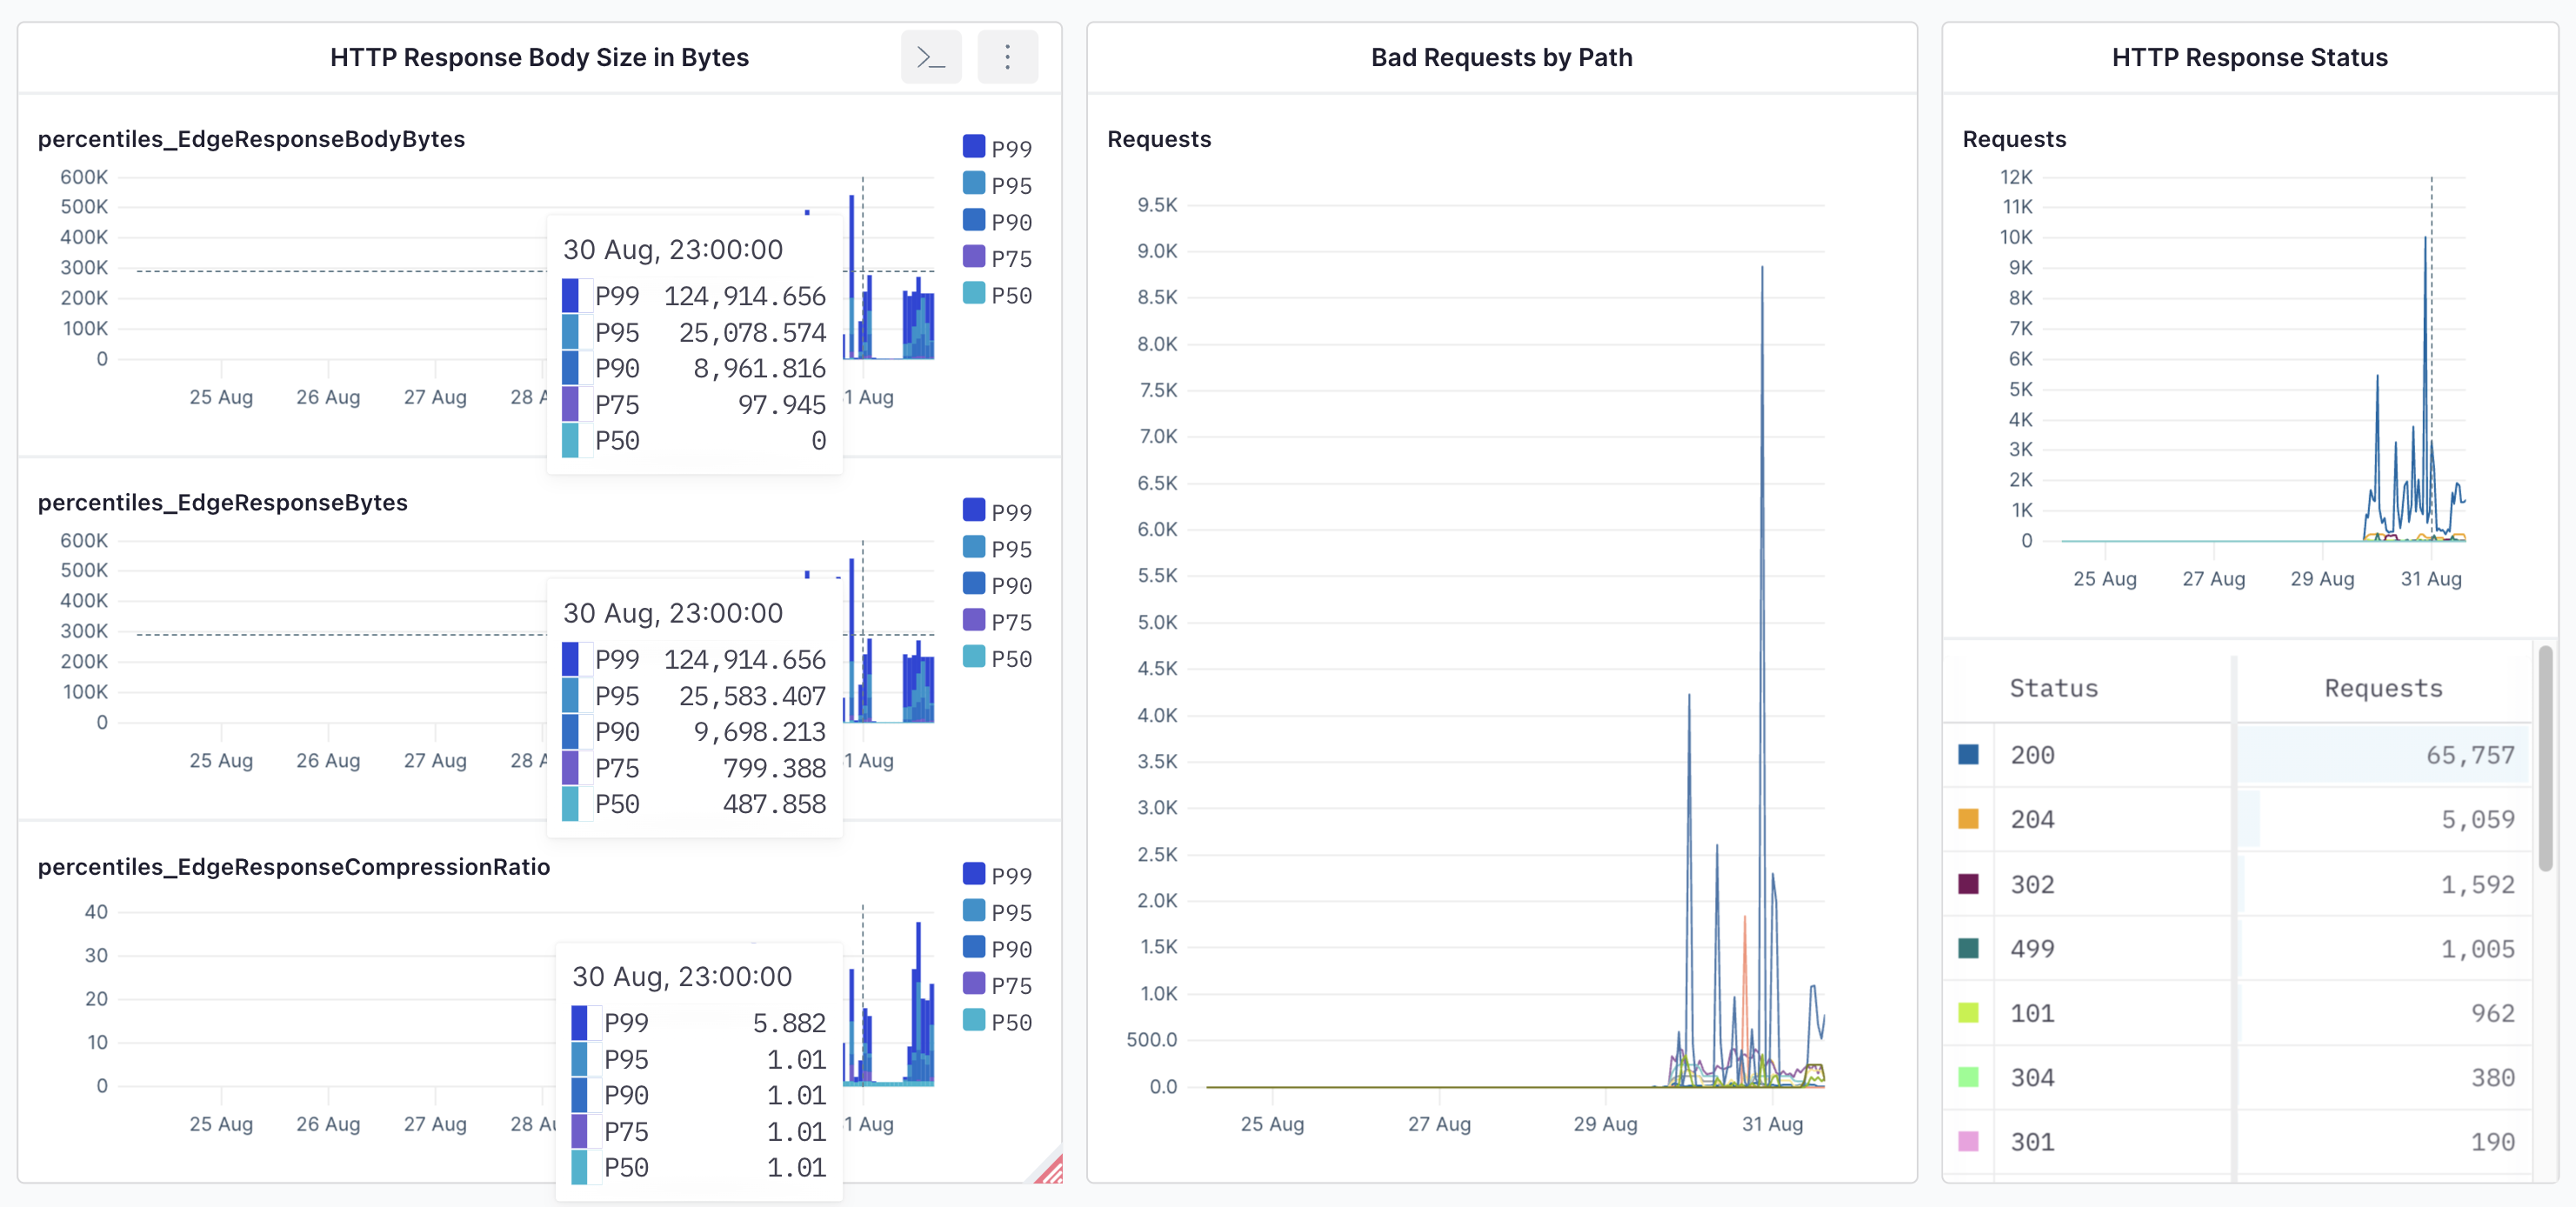
- In the Axiom, you can see your Cloudflare Logpush dashboard.
Benefits of using the Axiom Cloudflare Logpush Dashboard
- Real-time visibility into web performance: One of the most crucial features is the ability to see how your website or app is performing in real-time. The dashboard can show everything from page load times to error rates, giving you immediate insights that can help in timely decision-making.
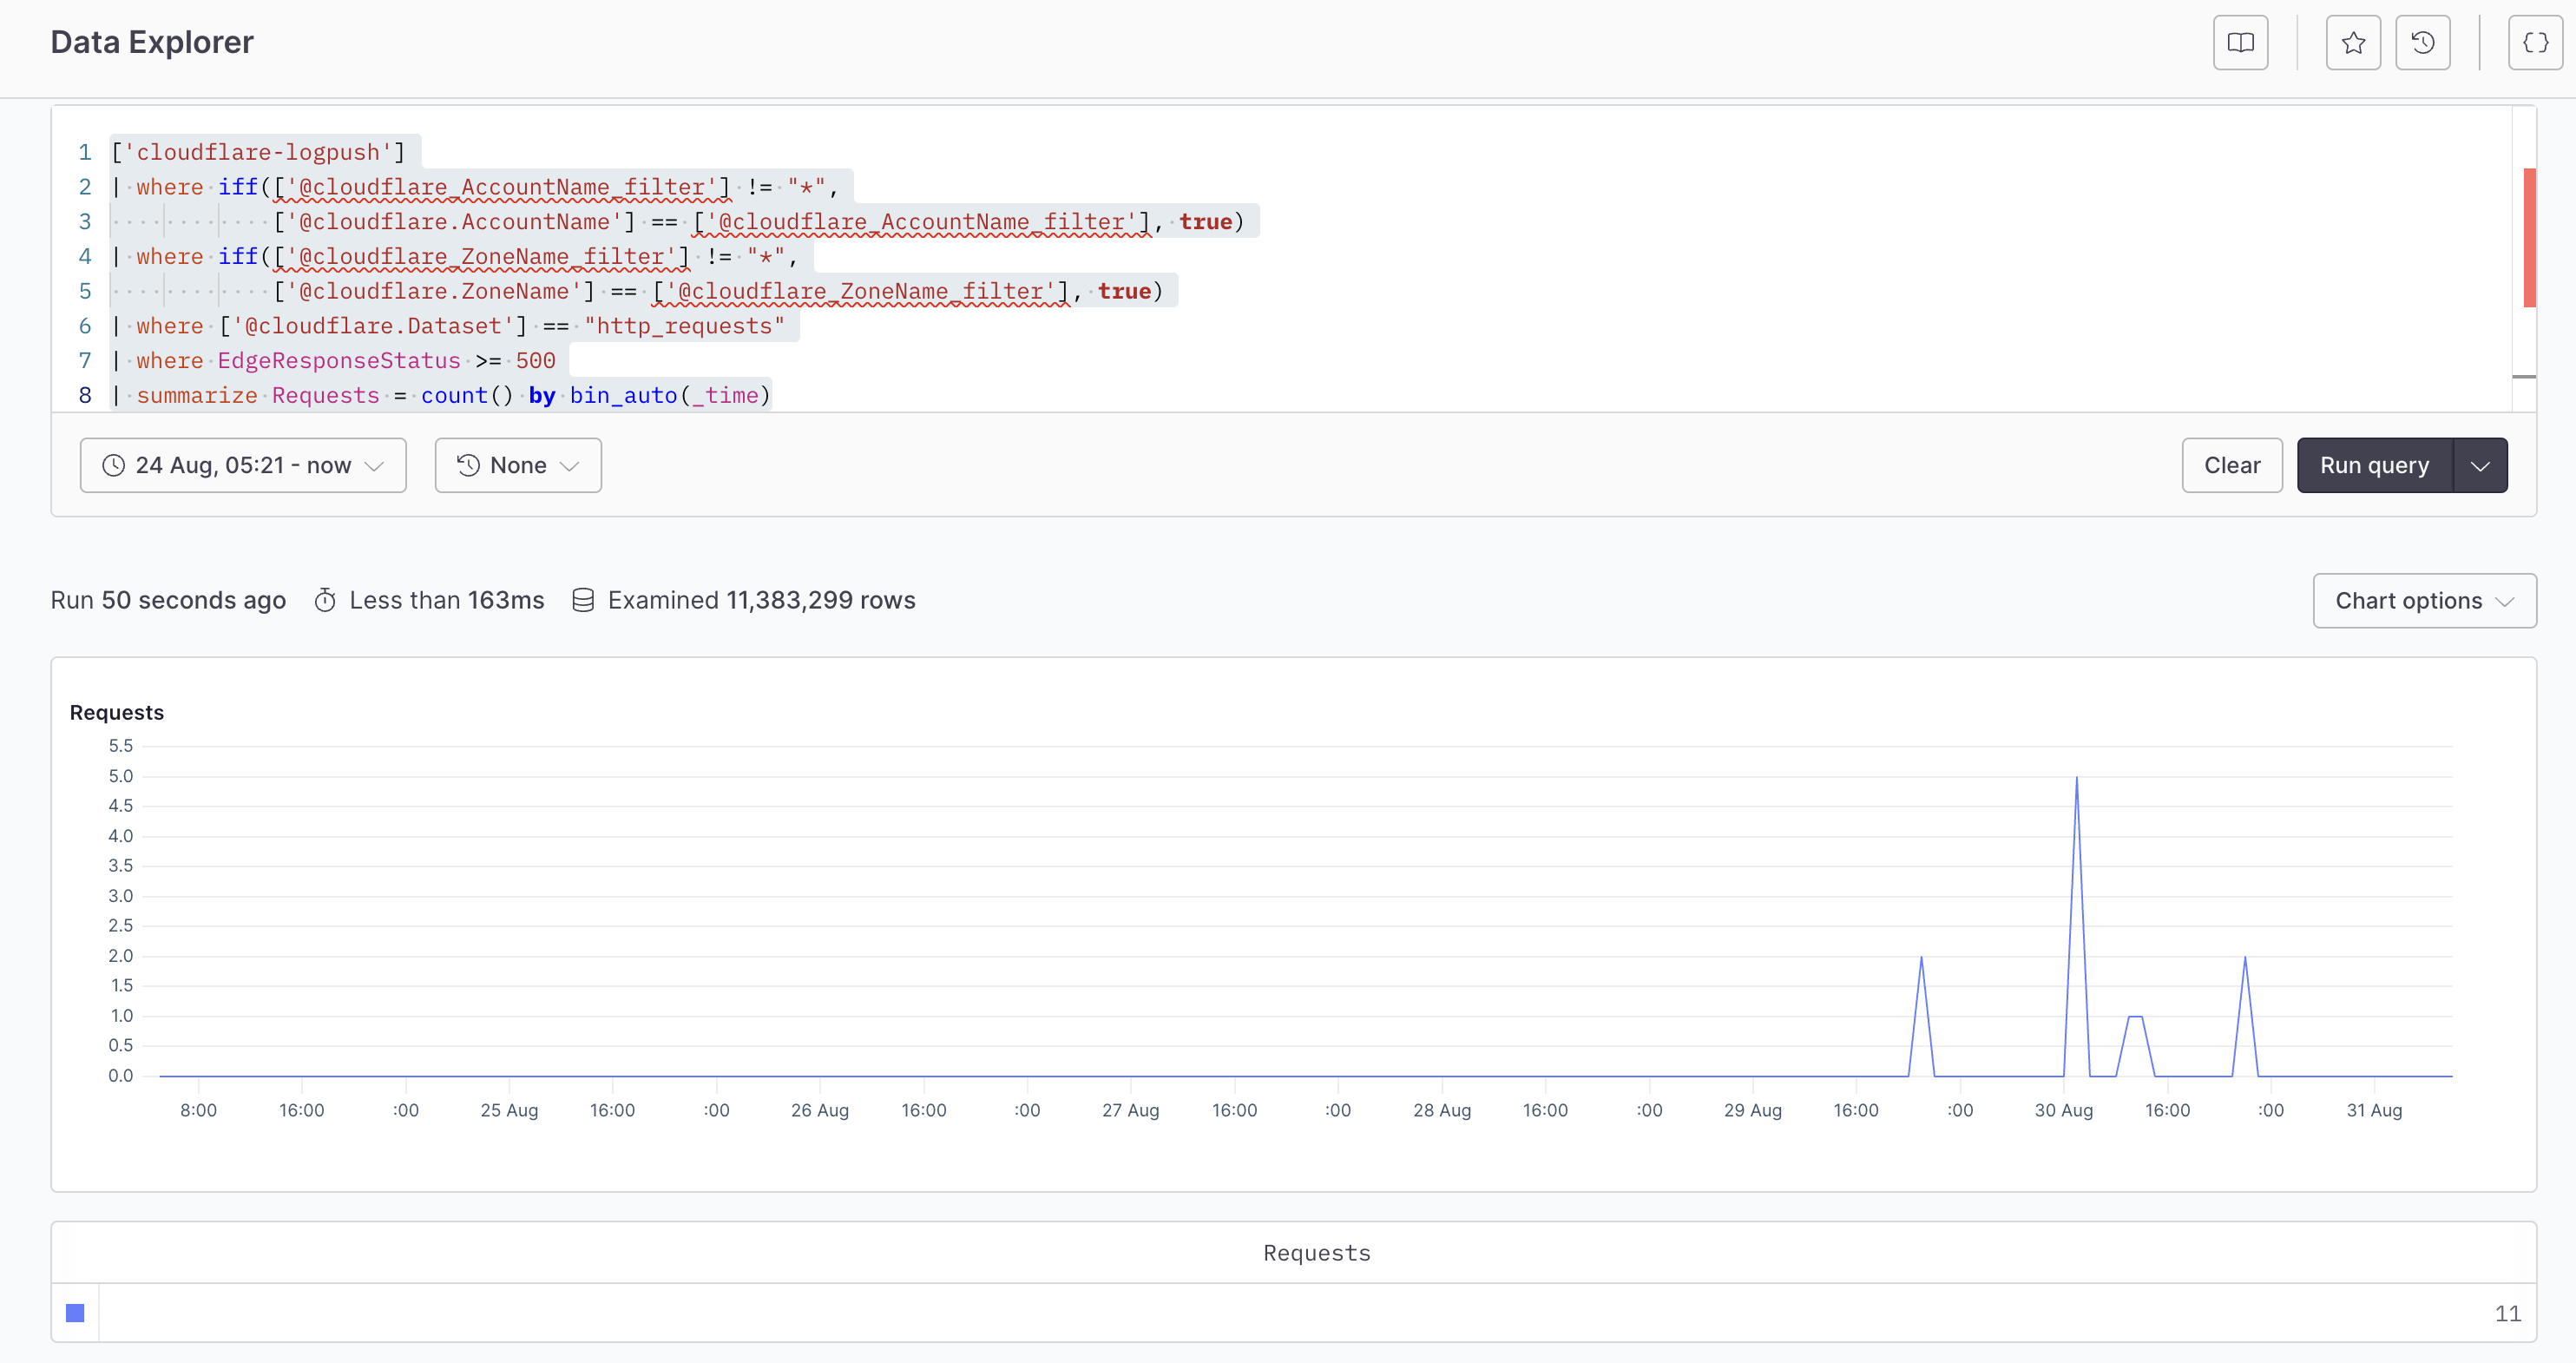
- Actionable insights for troubleshooting: The dashboard doesn’t just provide raw data; it provides insights. Whether it’s an error that needs immediate fixing or performance metrics that show an error from your app, having this information readily available makes it easier to identify problems and resolve them swiftly.
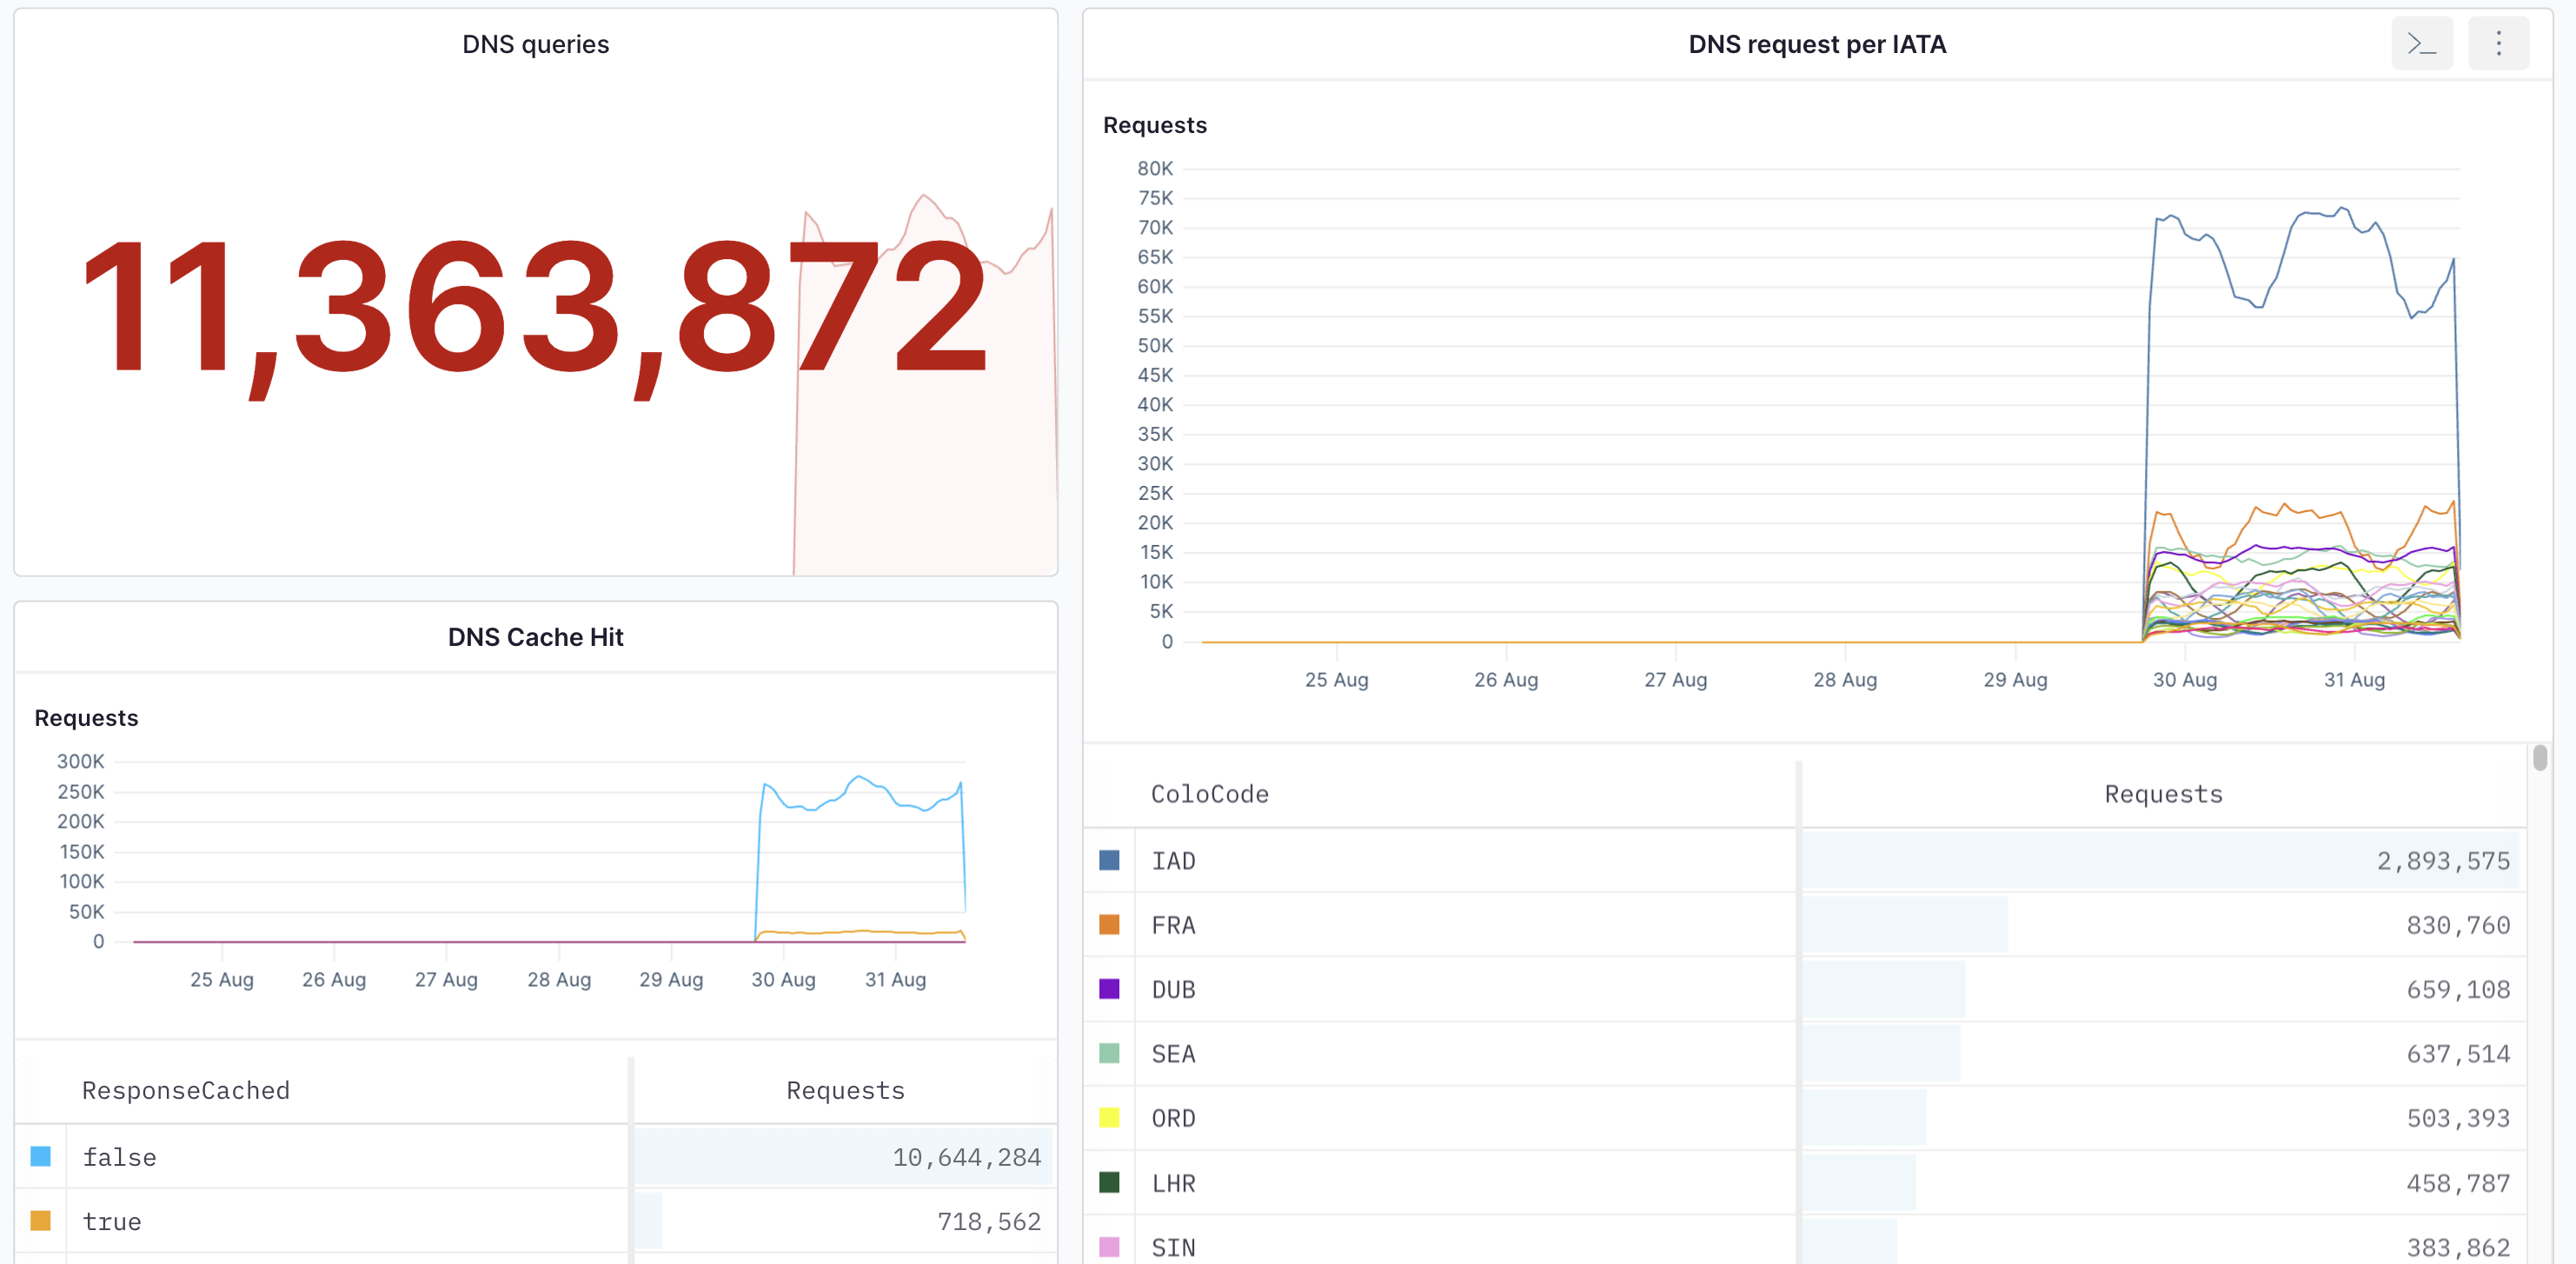
- DNS metrics: Understanding the DNS requests, DNS queries, and DNS cache hit from your app is vital to track if there’s a request spike or get the total number of queries in your system.
- Centralized logging and error tracing: With logs coming in from various parts of your app stack, centralizing them within Axiom makes it easier to correlate events across different layers of your infrastructure. This is crucial for troubleshooting complex issues that may span multiple services or components.
Supported Cloudflare Logpush Datasets
Axiom supports all the Cloudflare account-scoped datasets. Zone-scoped- DNS logs
- Firewall events
- HTTP requests
- NEL reports
- Spectrum events
- Access requests
- Audit logs
- CASB Findings
- Device posture results
- DNS Firewall Logs
- Gateway DNS
- Gateway HTTP
- Gateway Network
- Magic IDS Detections
- Network Analytics Logs
- Workers Trace Events
- Zero Trust Network Session Logs
The Zero Trust, Gateway, and Access datasets (Access requests, Gateway DNS, Gateway HTTP, Gateway Network, and Zero Trust Network Session Logs) require the Zero Trust: PII Read token permission in addition to Logs: Edit. See Prerequisites above. Without it, Cloudflare returns a
missing required permissions error for these datasets.