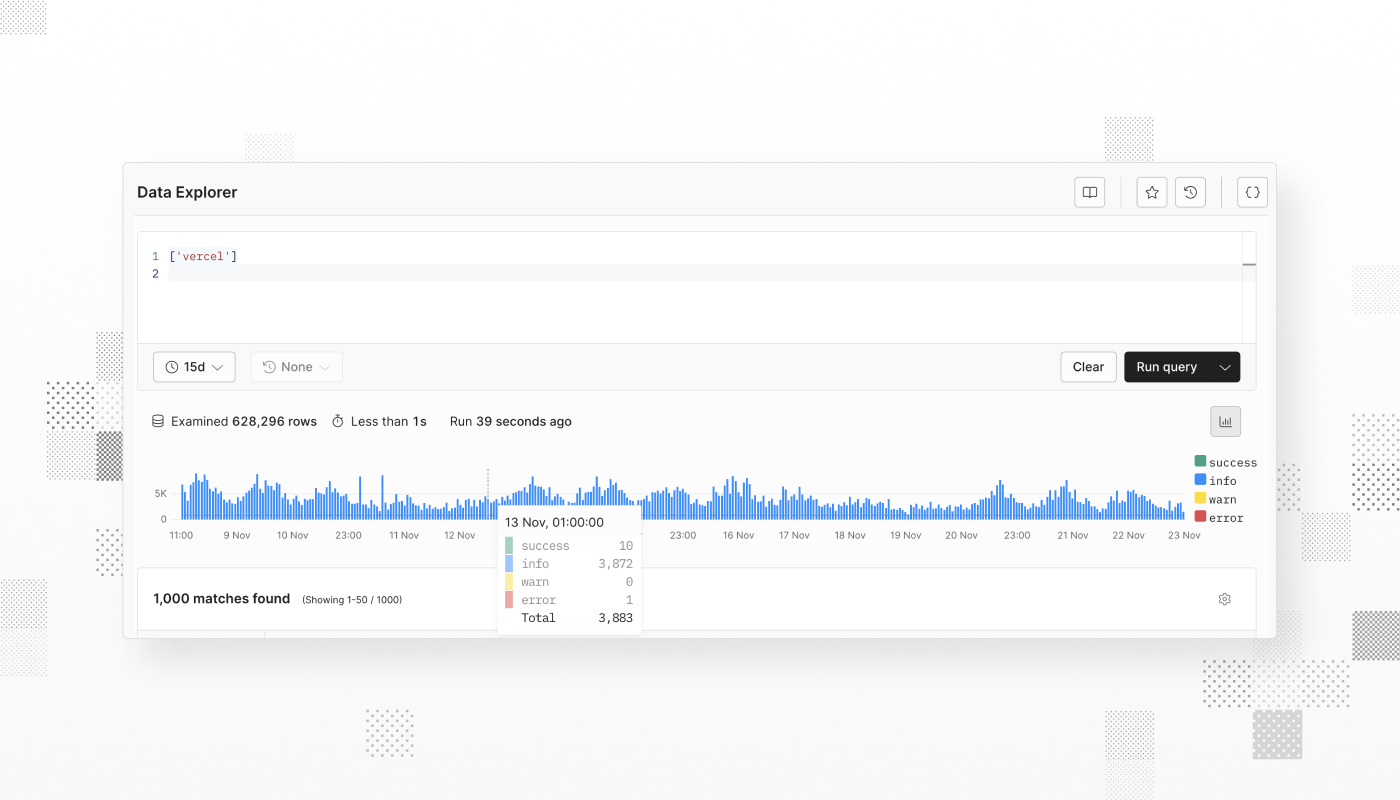
We've introduced an Event Timeline to Axiom, providing a bird’s eye view of your query results that helps identify spikes, dips, and trends. With one click, you can enable a visual representation of the number of events across a time window.
Swift insights and event identification: Get an immediate understanding of event distribution over time and easily pinpoint specific events, patterns, or anomalies with the clear visual representation.
Time range customization: Focus on what’s important by adjusting the time range of your query directly from the histogram.
Simply select your dataset, run a query, enable the Event Timeline, and refine your time range as needed.
Check out the documentation to learn more.