OpenTelemetry using Node.js
This guide demonstrates how to configure OpenTelemetry in a Node.js app to send telemetry data to Axiom.
OpenTelemetry provides a unified approach to collecting telemetry data from your Node.js and TypeScript apps. This guide demonstrates how to configure OpenTelemetry in a Node.js app to send telemetry data to Axiom using OpenTelemetry SDK.
Prerequisites
To configure OpenTelemetry in a Node.js app for sending telemetry data to Axiom, certain prerequisites are necessary. These include:
- Node:js: Node.js version 14 or newer.
- Node.js app: Use your own app written in Node.js, or you can start with the provided
app.tssample. - Create an Axiom account.
- Create a dataset in Axiom where you send your data.
- Create an API token in Axiom with permissions to create, read, update, and delete datasets.
Core Application (app.ts)
app.ts is the core of the app. It uses Express.js to create a simple web server. The server has an endpoint /rolldice that returns a random number, simulating a basic API. It also demonstrates the usage of span links to establish relationships between spans across different traces.
Exporter (instrumentation.ts)
instrumentation.ts sets up the OpenTelemetry instrumentation. It configures the OTLP (OpenTelemetry Protocol) exporters for traces and initializes the Node SDK with automatic instrumentation capabilities.
Installing the Dependencies
Navigate to the root directory of your project and run the following command to install the required dependencies:
This command will install all the necessary packages listed in your package.json below
Setting Up TypeScript Development Environment
To run the TypeScript app, you need to set up a TypeScript development environment. This includes adding a package.json file to manage your project’s dependencies and scripts, and a tsconfig.json file to manage TypeScript compiler options.
Add package.json
Create a package.json file in the root of your project with the following content:
Add tsconfig.json
Create a tsconfig.json file in the root of your project with the following content:
This configuration file specifies how the TypeScript compiler should transpile TypeScript files into JavaScript.
Running the Instrumented Application
To run your Node.js app with OpenTelemetry instrumentation, make sure your API token, and dataset is set in the instrumentation.ts file.
In Development Mode
For development purposes, especially when you need automatic restarts upon file changes, use:
This command will start the OpenTelemetry instrumentation in development mode using ts-node-dev. It sets up the exporter for tracing and restarts the server automatically whenever you make changes to the files.
In Production Mode
To run the app in production mode, you need to first build the TypeScript files into JavaScript. Run the following command to build your app:
This command compiles the TypeScript files to JavaScript based on the settings specified in tsconfig.json. Once the build process is complete, you can start your app in production mode with:
The server will start on the specified port, and you can interact with it by sending requests to the /rolldice endpoint.
Observe the telemetry data in Axiom
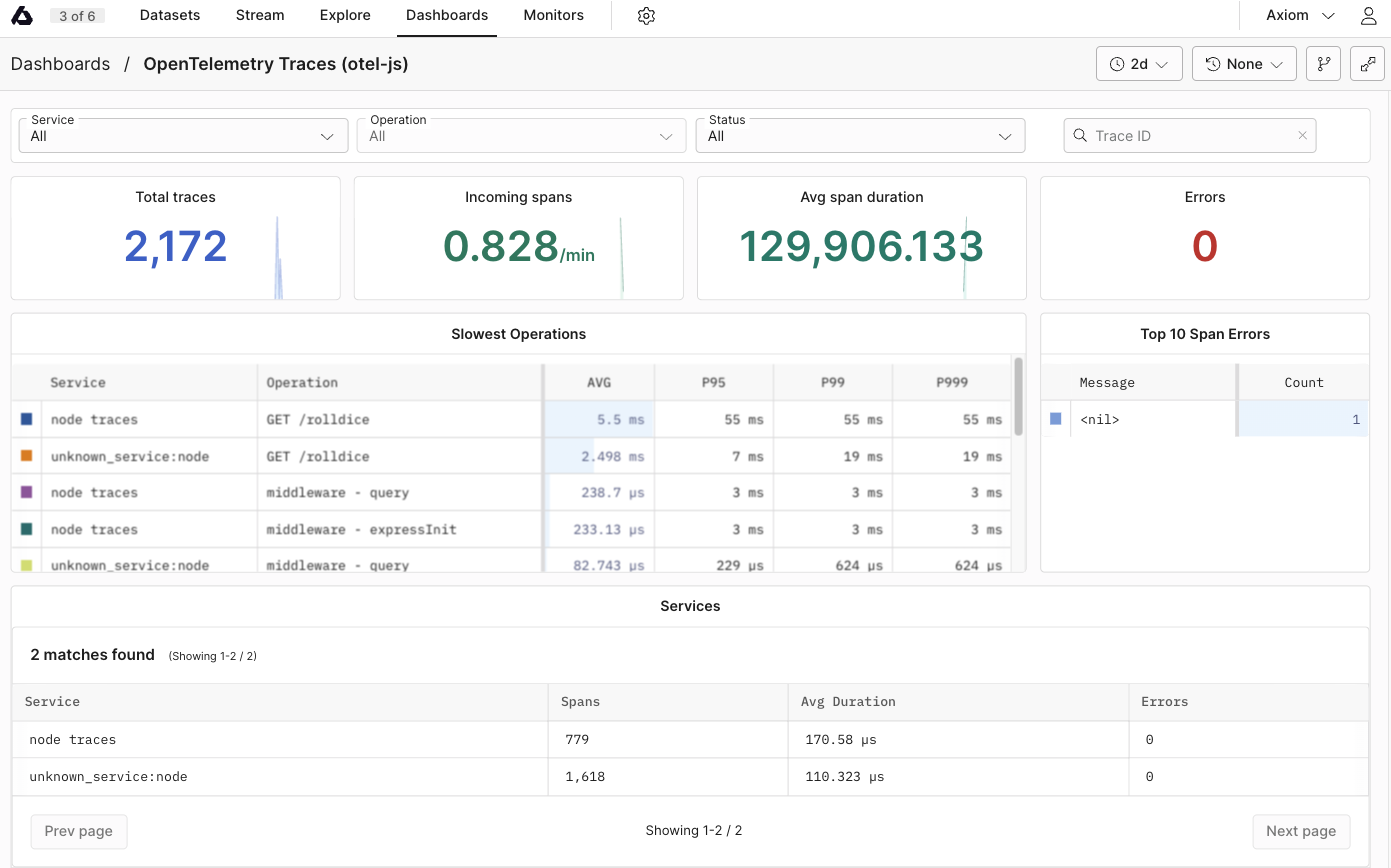
As you interact with your app, traces will be collected and exported to Axiom, where you can monitor and analyze your app’s performance and behavior.
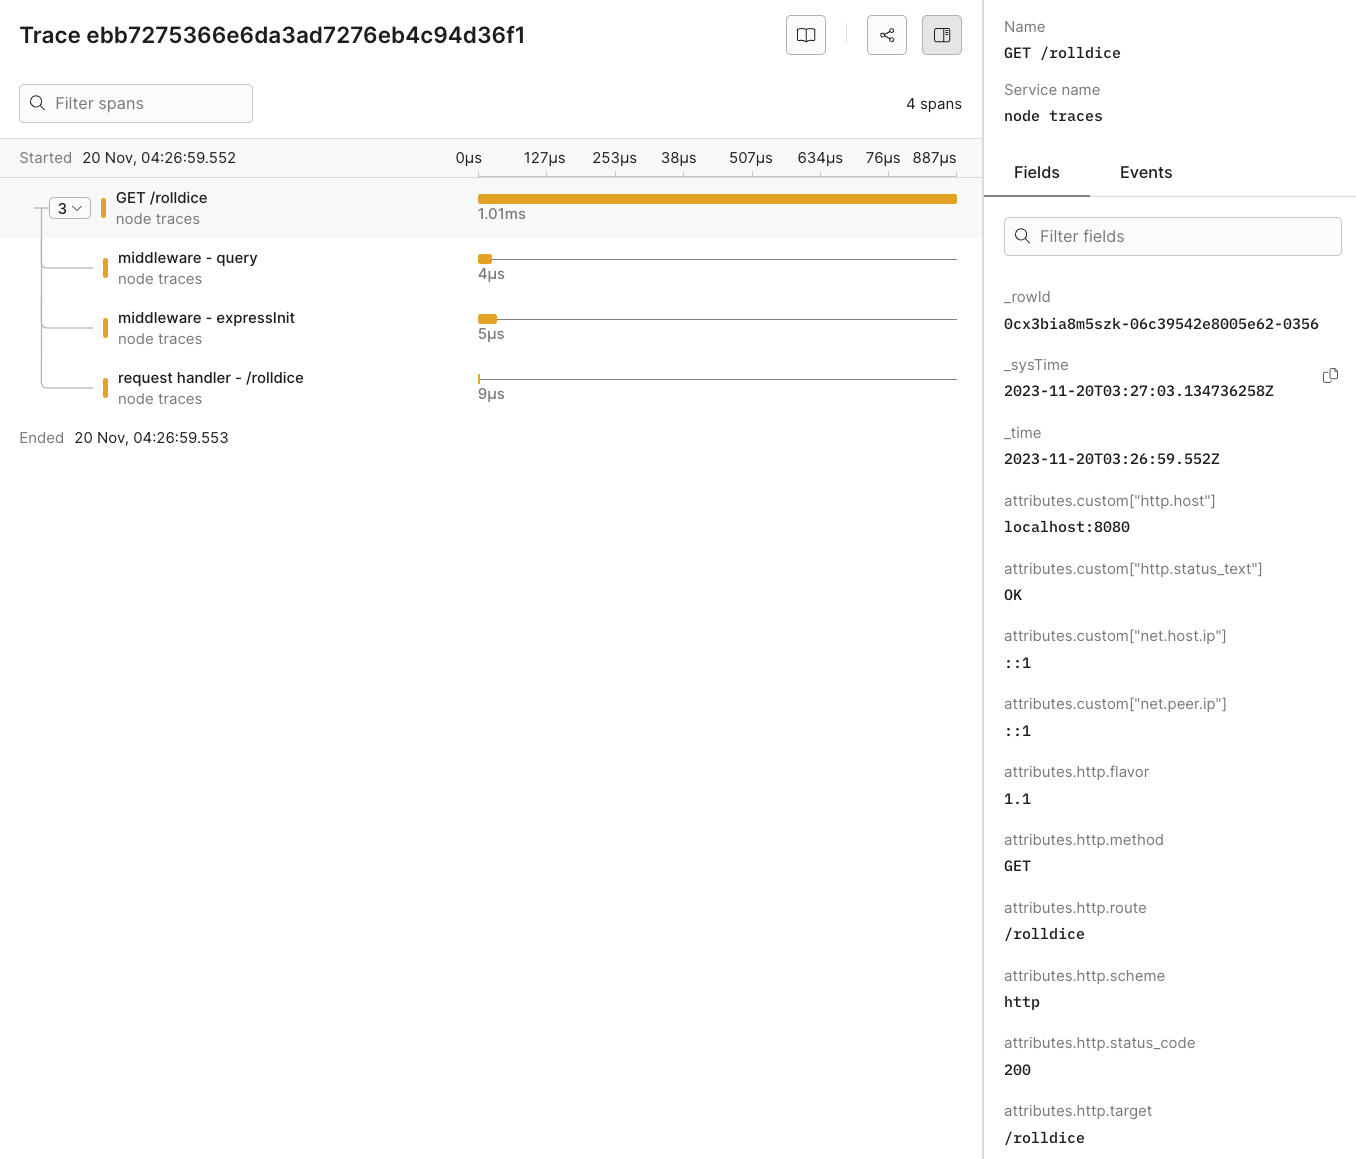
Dynamic OpenTelemetry traces dashboard
This data can then be further viewed and analyzed in Axiom’s dashboard, providing insights into the performance and behaviour of your app.
Send data from an existing Node project
Manual Instrumentation
Manual instrumentation in Node.js requires adding code to create and manage spans around the code blocks you want to trace.
- Initialize Tracer:
Import and configure a tracer in your Node.js app. Use the tracer configured in your instrumentation setup (instrumentation.ts).
- Create Spans:
Wrap the code blocks that you want to trace with spans. Start and end these spans within your code.
- Annotate Spans:
Add metadata and logs to your spans for the trace data.
Automatic Instrumentation
Automatic instrumentation in Node.js simplifies adding telemetry data to your app. It uses pre-built libraries to automatically instrument common frameworks and libraries.
- Install Instrumentation Libraries:
Use OpenTelemetry packages that automatically instrument common Node.js frameworks and libraries.
- Instrument Application: Configure your app to use these libraries, which will automatically generate spans for standard operations.
After you set them up, these libraries automatically trace relevant operations without additional code changes in your app.
Reference
List of OpenTelemetry trace fields
| Field Category | Field Name | Description |
|---|---|---|
| Unique Identifiers | ||
| _rowid | Unique identifier for each row in the trace data. | |
| span_id | Unique identifier for the span within the trace. | |
| trace_id | Unique identifier for the entire trace. | |
| Timestamps | ||
| _systime | System timestamp when the trace data was recorded. | |
| _time | Timestamp when the actual event being traced occurred. | |
| HTTP Attributes | ||
| attributes.custom["http.host"] | Host information where the HTTP request was sent. | |
| attributes.custom["http.server_name"] | Server name for the HTTP request. | |
| attributes.http.flavor | HTTP protocol version used. | |
| attributes.http.method | HTTP method used for the request. | |
| attributes.http.route | Route accessed during the HTTP request. | |
| attributes.http.scheme | Protocol scheme (HTTP/HTTPS). | |
| attributes.http.status_code | HTTP response status code. | |
| attributes.http.target | Specific target of the HTTP request. | |
| attributes.http.user_agent | User agent string of the client. | |
| Network Attributes | ||
| attributes.net.host.port | Port number on the host receiving the request. | |
| attributes.net.peer.port | Port number on the peer (client) side. | |
| attributes.custom["net.peer.ip"] | IP address of the peer in the network interaction. | |
| Operational Details | ||
| duration | Time taken for the operation. | |
| kind | Type of span (for example,, server, client). | |
| name | Name of the span. | |
| scope | Instrumentation scope. | |
| service.name | Name of the service generating the trace. | |
| Resource Process Attributes | ||
| resource.process.command | Command line string used to start the process. | |
| resource.process.command_args | List of command line arguments used in starting the process. | |
| resource.process.executable.name | Name of the executable running the process. | |
| resource.process.executable.path | Path to the executable running the process. | |
| resource.process.owner | Owner of the process. | |
| resource.process.pid | Process ID. | |
| resource.process.runtime.description | Description of the runtime environment. | |
| resource.process.runtime.name | Name of the runtime environment. | |
| resource.process.runtime.version | Version of the runtime environment. | |
| Telemetry SDK Attributes | ||
| telemetry.sdk.language | Language of the telemetry SDK. | |
| telemetry.sdk.name | Name of the telemetry SDK. | |
| telemetry.sdk.version | Version of the telemetry SDK. |
List of imported libraries
The instrumentation.ts file imports the following libraries:
@opentelemetry/sdk-node
This package is the core SDK for OpenTelemetry in Node.js. It provides the primary interface for configuring and initializing OpenTelemetry in a Node.js app. It includes functionalities for managing traces and context propagation. The SDK is designed to be extensible, allowing for custom configurations and integration with different telemetry backends like Axiom.
@opentelemetry/auto-instrumentations-node
This package offers automatic instrumentation for Node.js apps. It simplifies the process of instrumenting various common Node.js libraries and frameworks. By using this package, developers can automatically collect telemetry data (such as traces) from their apps without needing to manually instrument each library or API call. This is important for apps with complex dependencies, as it ensures comprehensive and consistent telemetry collection across the app.
@opentelemetry/exporter-trace-otlp-proto
The @opentelemetry/exporter-trace-otlp-proto package provides an exporter that sends trace data using the OpenTelemetry Protocol (OTLP). OTLP is the standard protocol for transmitting telemetry data in the OpenTelemetry ecosystem. This exporter allows Node.js apps to send their collected traces to any backend that supports OTLP, such as Axiom. The use of OTLP ensures broad compatibility and a standardized way of transmitting telemetry data.
@opentelemetry/sdk-trace-base
Contained within this package is the BatchSpanProcessor, among other foundational elements for tracing in OpenTelemetry. The BatchSpanProcessor is a component that collects and processes spans (individual units of trace data). As the name suggests, it batches these spans before sending them to the configured exporter (in this case, the OTLPTraceExporter). This batching mechanism is efficient as it reduces the number of outbound requests by aggregating multiple spans into fewer batches. It helps in the performance and scalability of trace data export in an OpenTelemetry-instrumented app.