Enrich Axiom experience with AWS Lambda
This page explains how to enrich your Axiom experience with AWS Lambda.
Use the Axiom Lambda Extension to enrich your Axiom organization with quick filters and a dashboard.
For information on how to send logs and platform events of your Lambda function to Axiom, see Send data from AWS Lambda.
What’s the Axiom Lambda Extension
AWS Lambda is a compute service that allows you to build applications and run your code at scale without provisioning or maintaining any servers.
Use the AWS Lambda Extension to collect Lambda logs, performance metrics, platform events, and memory usage from your Lambda functions. With the Axiom Lambda Extension, you can monitor Lambda performance and aggregate system-level metrics for your serverless applications and optimize lambda functions through easy-to-use automatic dashboards.
With the Axiom Lambda extension, you can:
- Monitor your Lambda functions and invocations.
- Get full visibility into your AWS Lambda events in minutes.
- Collect metrics and logs from your Lambda-based Serverless Applications.
- Track and view enhanced memory usage by versions, durations, and cold start.
- Detect and get alerts on Lambda event errors, Lambda request timeout, and low execution time.
Comprehensive AWS Lambda dashboards
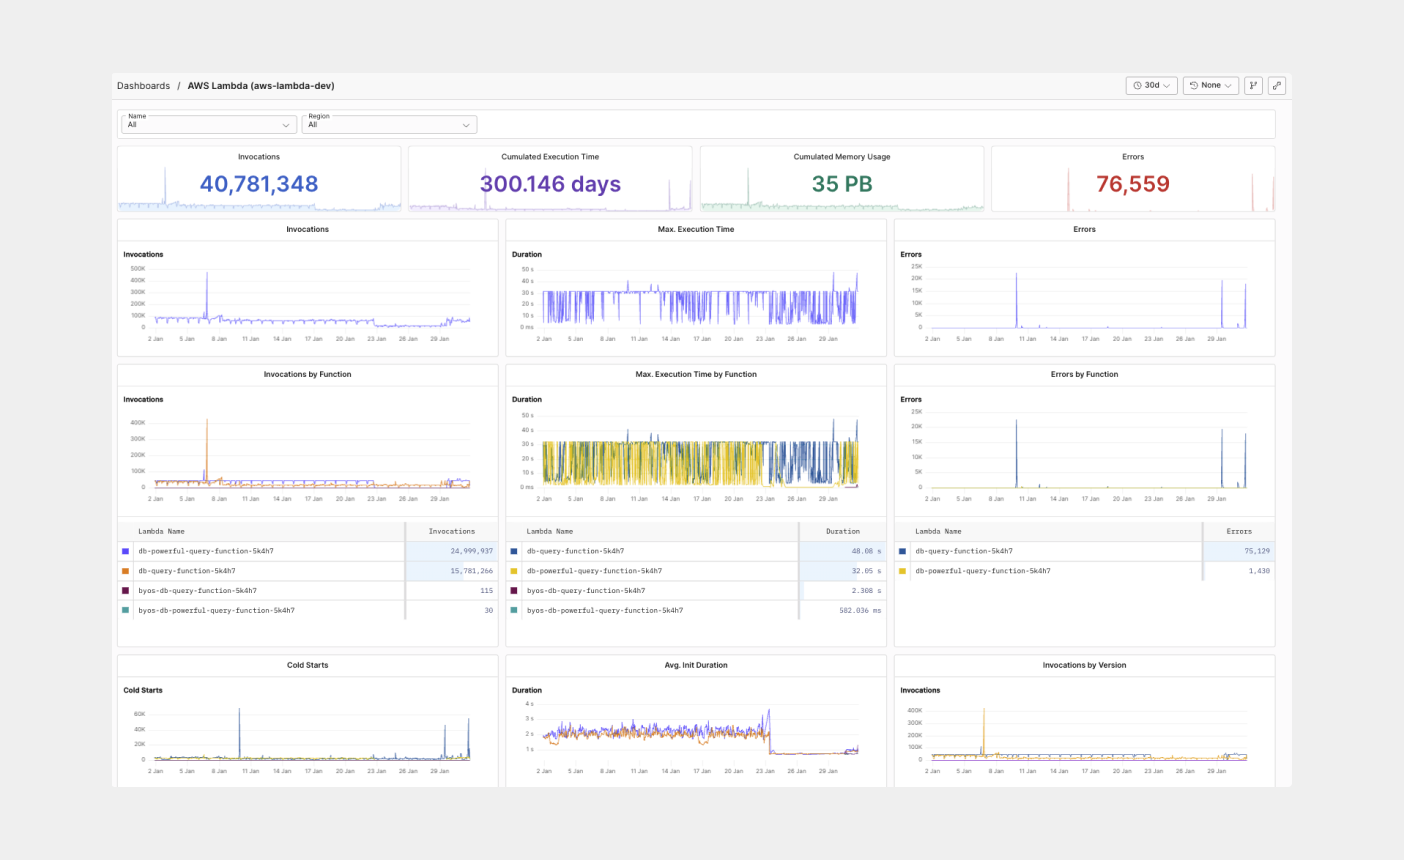
The Axiom AWS Lambda integration comes with a pre-built dashboard where you can see and group your functions with the versions and AWS resource that triggers them, making this the ideal starting point for getting an advanced view of the performance and health of your AWS Lambda serverless services and Lambda function events. The AWS Lambda dashboards automatically show up in Axiom through schema detection after installing the Axiom Lambda Extension.
These new zero-config dashboards help you spot and troubleshoot Lambda function errors. For example, if there’s high memory usage on your functions, you can spot the unusual delay from the max execution dashboard and filter your errors by functions, durations, invocations, and versions. With your Lambda version name, you can gain and expand your views on what’s happening in your Lambda event source mapping and invocation type.
Monitor Lambda functions and usage in Axiom
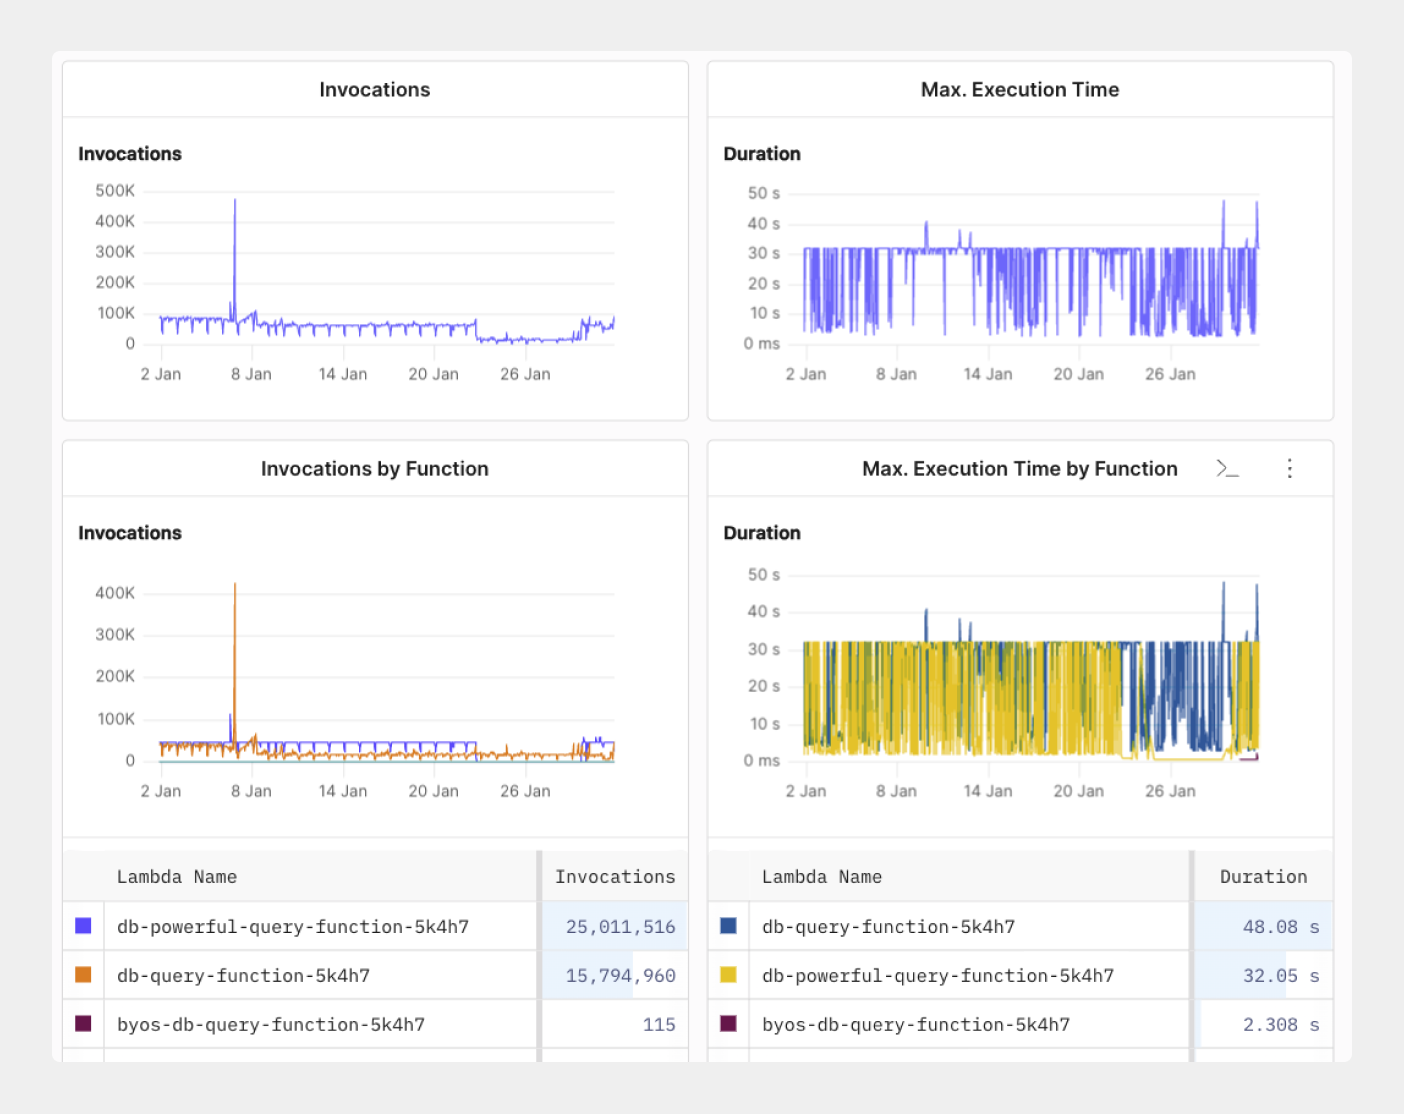
Having real-time visibility into your function logs is important because any duration between sending your lambda request and the execution time can cause a delay and adds to customer-facing latency. You need to be able to measure and track your Lambda invocations, maximum execution time, minimum execution time, and all invocations by function.
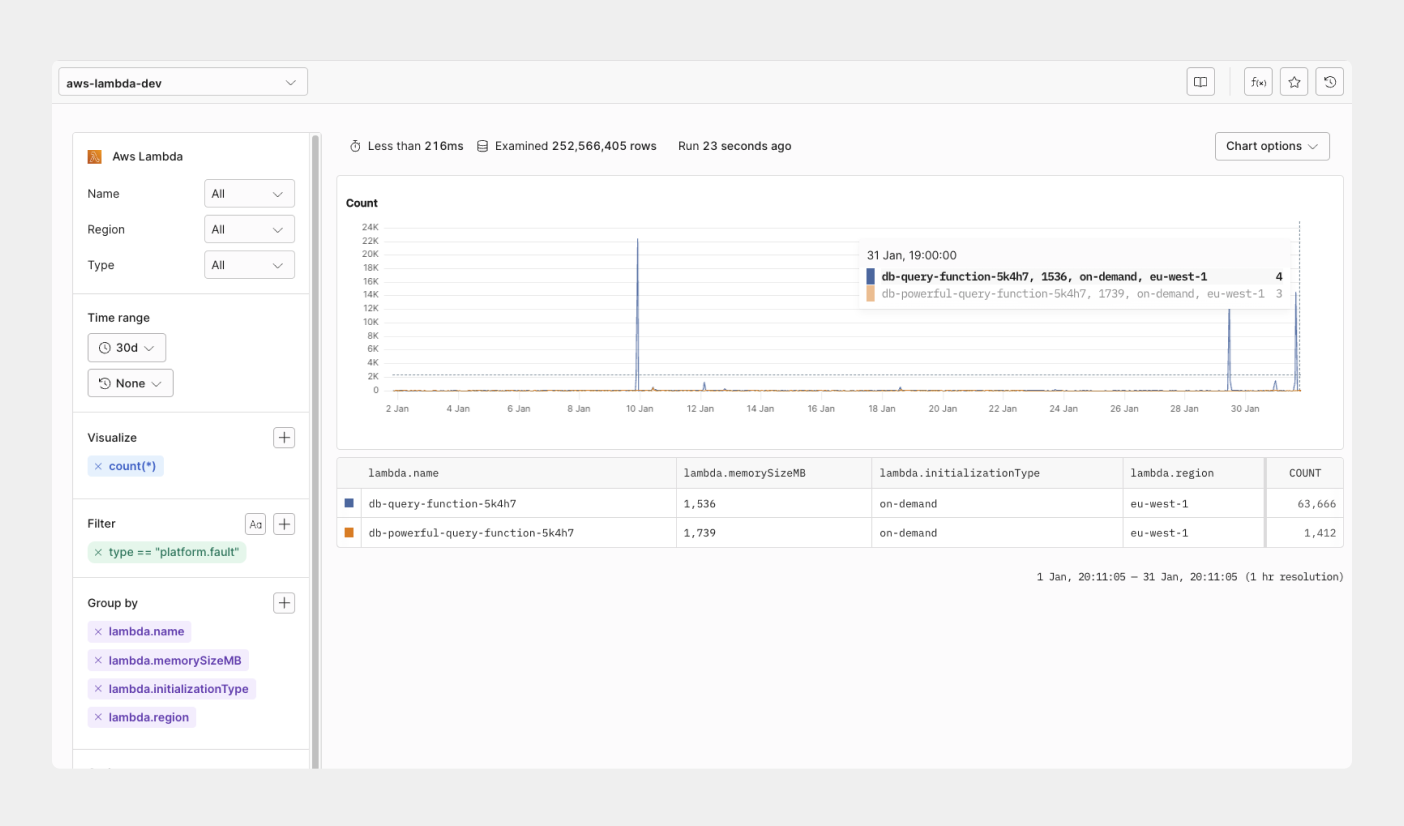
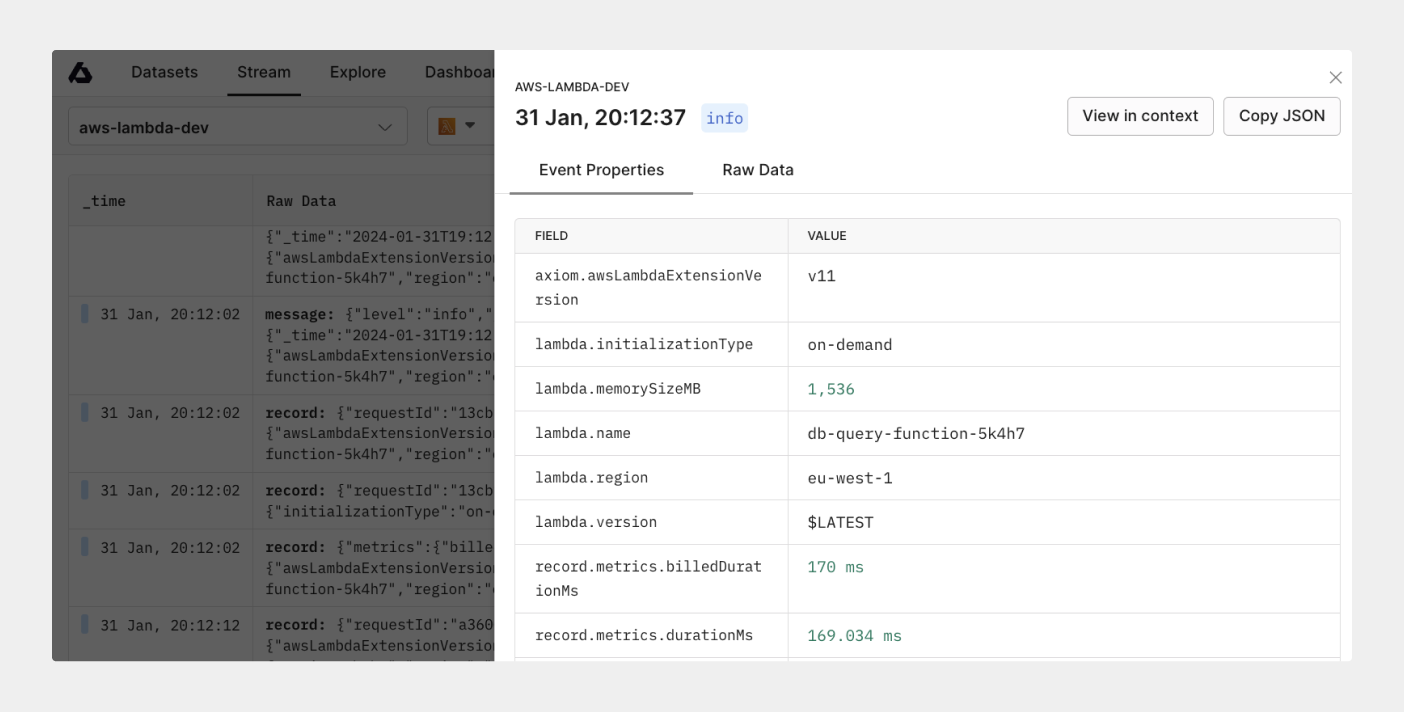
The Axiom Lambda Extension gives you full visibility into the most important metrics and logs coming from your Lambda function out of the box without any further configuration required.
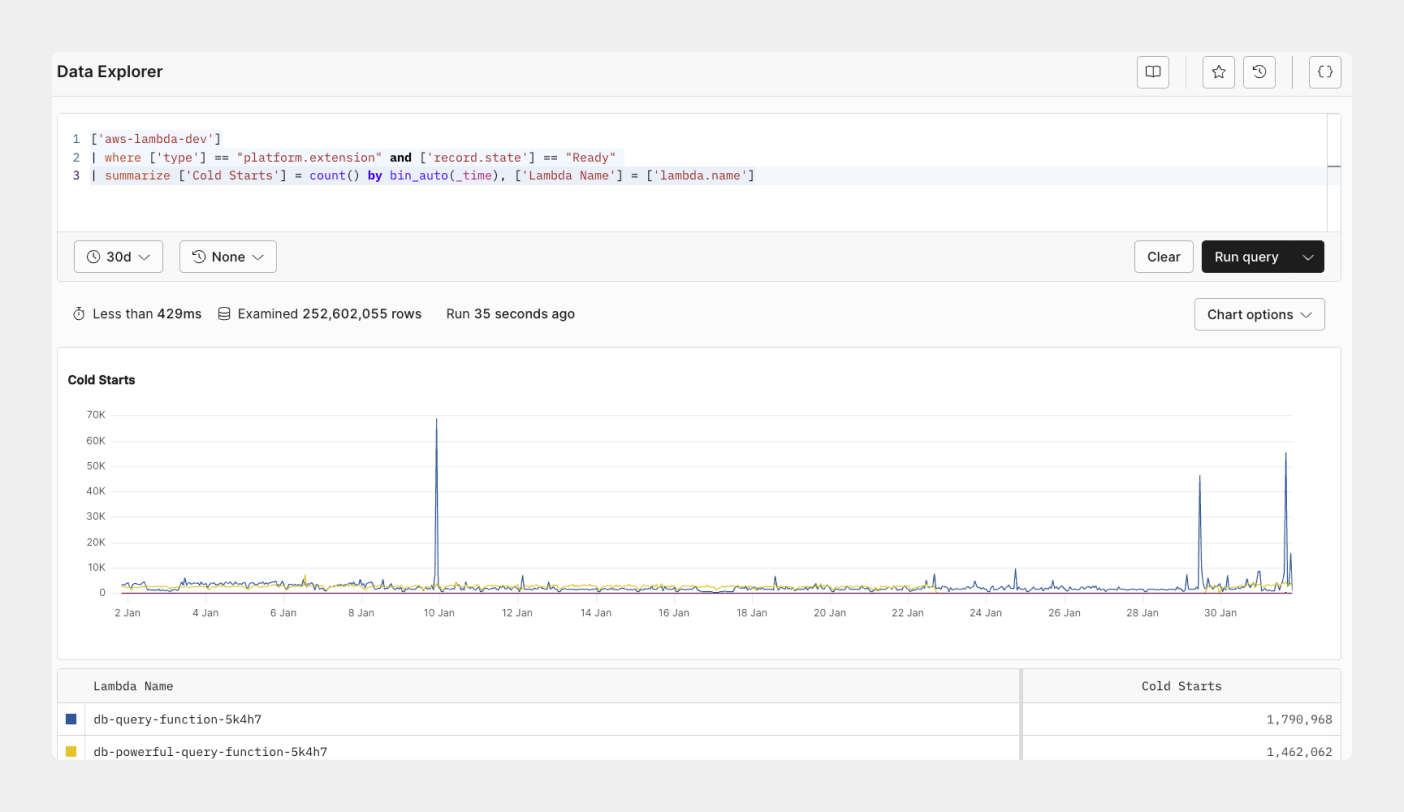
Track cold start on your Lambda function
A cold start occurs when there’s a delay between your invocation and runtime created during the initialization process. During this period, there’s no available function instance to respond to an invocation. With the Axiom built-in Serverless AWS Lambda dashboard, you can track and see the effect of cold start on your Lambda functions and its impact on every Lambda function. This data lets you know when to take actionable steps, such as using provisioned concurrency or reducing function dependencies.
Optimize slow-performing Lambda queries
Grouping logs with Lambda invocations and execution time by function provides insights into your events request and response pattern. You can extend your query to view when an invocation request is rejected and configure alerts to be notified on Serverless log patterns and Lambda function payloads. With the invocation request dashboard, you can monitor request function logs and see how your Lambda serverless functions process your events and Lambda queues over time.
Detect timeout on your Lambda function
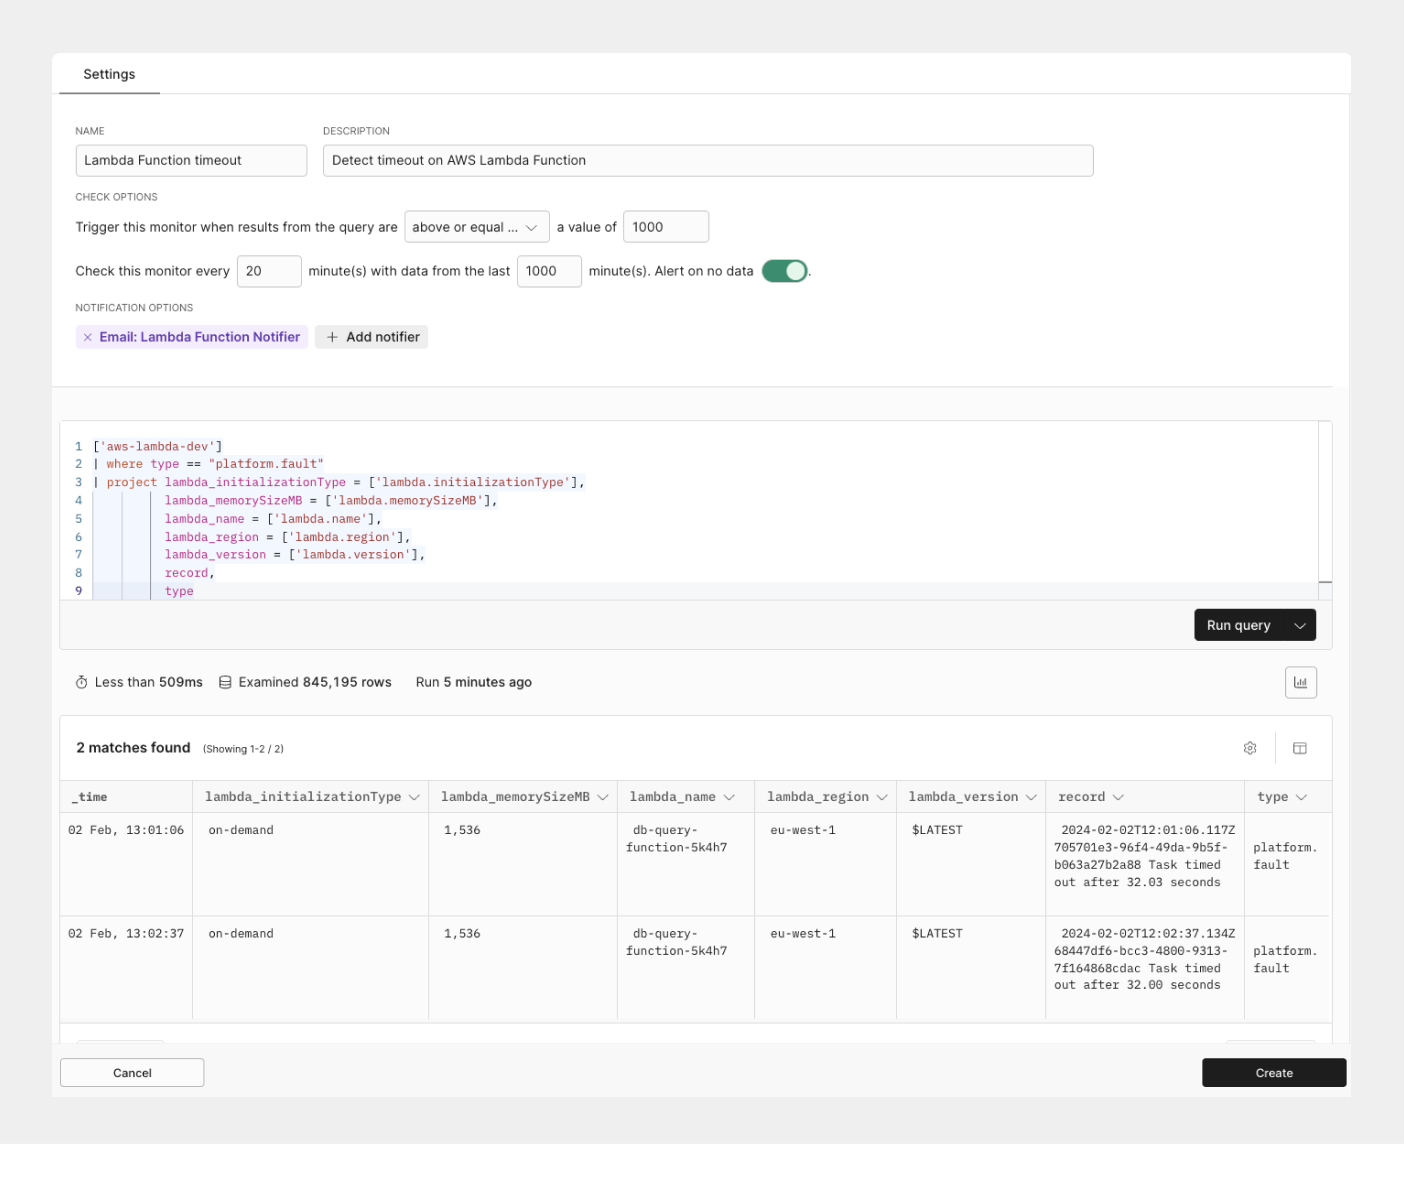
Axiom Lambda function monitors let you identify the different points of invocation failures, cold-start delays, and AWS Lambda errors on your Lambda functions. With standard function logs like invocations by function, and Lambda cold start, monitoring the rate of your execution time can alert you to be aware of a significant spike whenever an error occurs in your Lambda function.
Smart filters
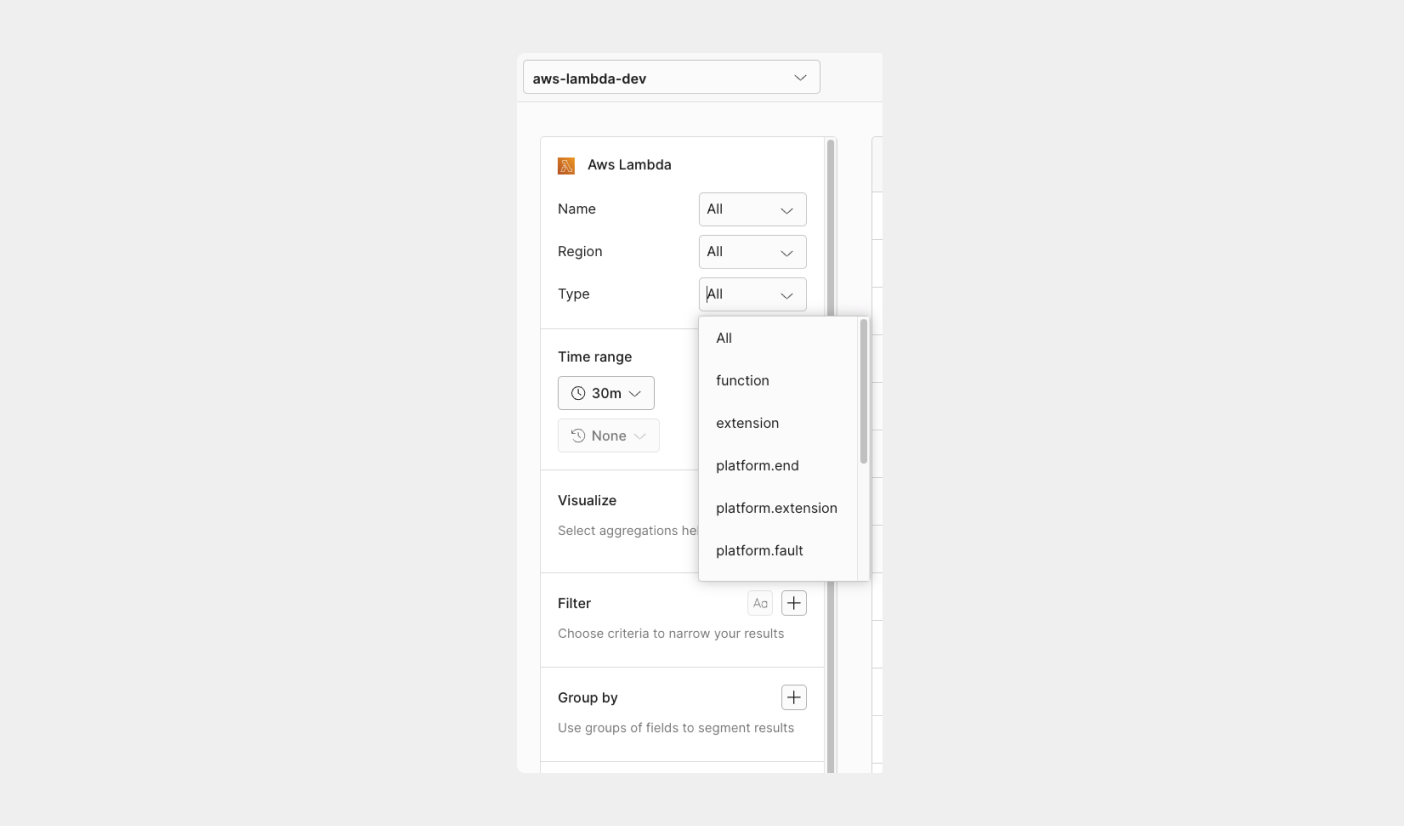
Axiom Lambda Serverless Smart Filters lets you easily filter down to specific AWS Lambda functions or Serverless projects and use saved queries to get deep insights on how functions are performing with a single click.