This one is a side project. Here at Axiom some of us use Hermes, the open source agent from Nous Research, and if you've ever left an agent running for an afternoon you know the feeling at the end of it, it did a lot of things, it made a lot of calls, and the only records of what happened are the conversation log and, a month later, the invoice. We happen to build a database for exactly this kind of data for a living, so it was really only a question of time until someone wrote a plugin. Long story short, we did, it's called hermes-metrics, it's Apache-2.0/MIT licensed, and in this post we go through how it works and the handful of places where it was less straightforward than we thought.
The hooks
Hermes has an observer plugin API, we register callbacks for a set of hooks and Hermes calls them with a keyword payload as the agent loop goes along. These are the ones we subscribe to and what we make of them:
Hook | Recorded |
|---|---|
on_session_start / on_session_end | session span, |
pre_llm_call / post_llm_call | turn span, turn duration, calls per turn |
post_api_request / api_request_error | provider call span, tokens, latency, spend |
post_tool_call | tool span, tool duration, per-tool call count |
pre_approval_request / post_approval_response | approvals requested and how they were answered |
subagent_start / subagent_stop | spawns, outcomes, active subagents, duration |
on_session_finalize | flush |
Out of that we produce the usual three OpenTelemetry signals. Traces, where the session is the root span and turns, provider calls and tool executions hang below it, with the gen_ai.* attributes from the semantic conventions so they show up in the AI views without us configuring anything. Metrics, which is where most of the work went and what most of this post is about. And logs, which we limited to failed provider and tool calls. Shipping every event as a log line as well is what a lot of setups do and it's a perfectly valid choice, however for us everything is in the traces already and a second copy is twice the data for the same information, so we left it at the failures.
Queue or block
The first thing we ran into is how Hermes dispatches those hooks: synchronously, on the very thread that runs the turn. For Hermes that's the right call, it's the simple thing to do and the built-in observers are cheap. For us it's less convenient, every millisecond we spend in a hook is a millisecond added to the turn, and an exception in one of our hooks is an exception in the agent loop. Not great for something that is supposed to be invisible, so we do as little as possible in the hook itself, we stamp the payload with a kind and a timestamp and put it on a queue:
The queue is bounded (2048 entries by default) and a single worker thread drains it and hands each event to the recorders. But what do we do when the queue is full? There are two options, we can block the hook until the worker has caught up, or we can drop the event. Blocking is what you'd do if the numbers have to be exact, and there are plenty of situations where that is the right choice. However, for something whose only job is to watch the agent, stalling the agent seemed the wrong way round to us, so we drop. In normal operation the worker is idle most of the time anyway.
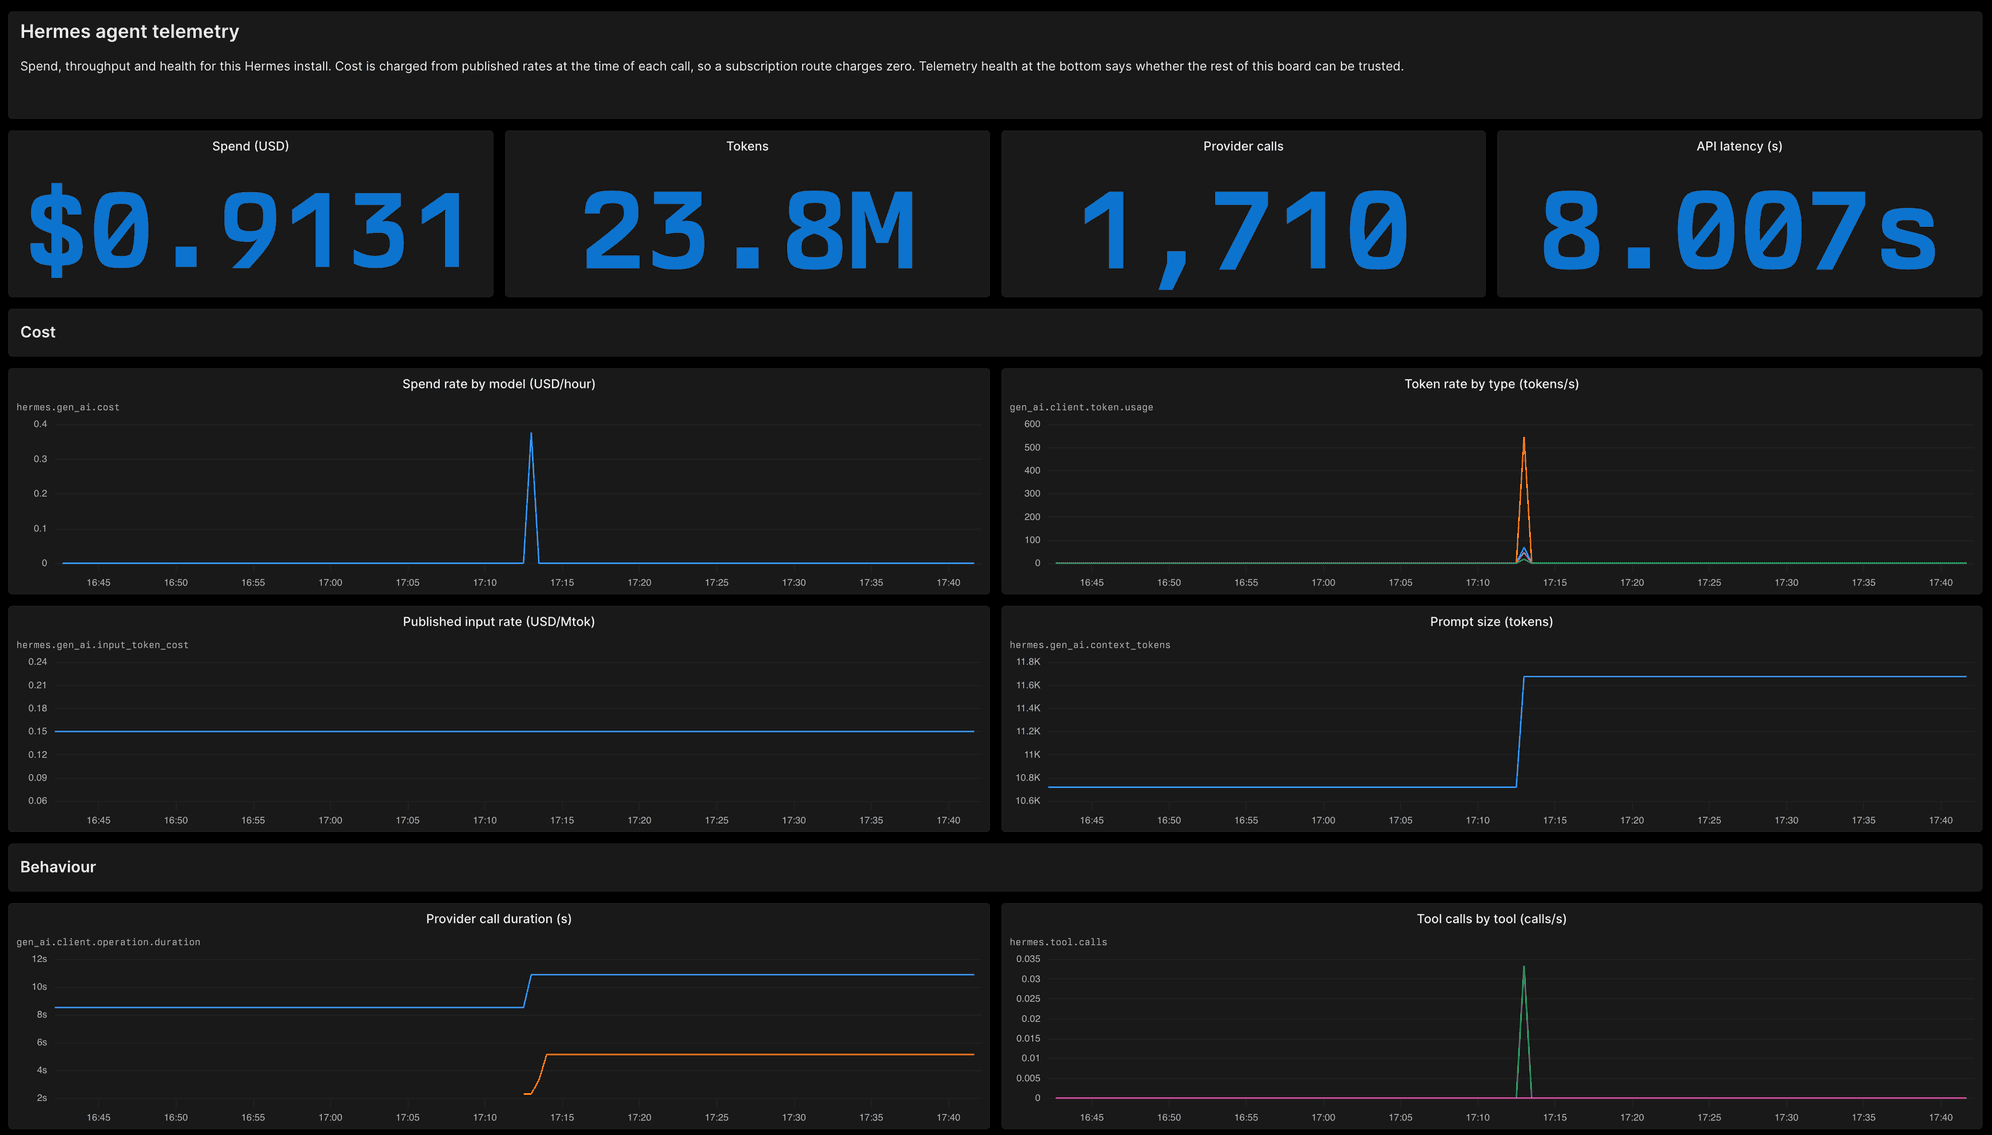
Dropping means the numbers can be wrong, and a dashboard that is silently wrong is a problem we deal with often enough at work to not want it in a side project either. So we export the four counters from that function, plus the queue depth, as metrics themselves: hermes.telemetry.accepted, hermes.telemetry.dropped, hermes.telemetry.handled, hermes.telemetry.failed and hermes.telemetry.queue_depth. They sit in their own row at the bottom of the dashboard, and we create a monitor on dropped and a second one that fires when accepted stops reporting. In other words: if anything on the board is understated we get an alert, and if the board is empty we can tell whether the agent is idle or the plugin isn't running.
Tokens to dollars
Tokens are the metric everyone starts with, but let's be honest, the number we wanted is dollars. Hermes already resolves a billing route for every model and provider combination, and for the routes it prices it knows the published rates per million tokens, so we read those and charge every post_api_request event to a counter, hermes.gen_ai.cost, tagged with provider, model and token type. The math is tokens * rate / 1_000_000 for input, output, cache read and cache write tokens, which sounds like a no-brainer.
It mostly is, with two exceptions we tripped over. Reasoning tokens are reported separately in the usage block but they are already part of the output token count, so if we charged them at the output rate we'd bill them twice. We record them as their own token type in gen_ai.client.token.usage and leave them out of the cost. The second one is subscription routes. If the calls are covered by a flat monthly fee Hermes classifies the route as subscription included, and we charge zero for it. That is correct, however a busy agent producing a spend chart that is a flat line at zero looks odd enough that we put an explanation in the dashboard description.
We export the rates themselves too, as gauges, hermes.gen_ai.input_token_cost and the same for output, cache read and cache write, in USD per million tokens and tagged with the pricing version Hermes resolved them from. Why export a constant? Because it is only constant until the provider changes it, and when that happens the gauge steps on the day it happened, on the same time axis as the spend, which is a lot easier to spot than a change in the slope of the cost curve. We re-read the rates once an hour on a separate thread and keep using the old rate until the new one has arrived.
Tools that were never called
A counter we increment on post_tool_call only exists for tools that were called. A tool that was never called has no series at all, and on a chart a missing series looks exactly the same as a tool that isn't installed. For a top ten of the most used tools that doesn't matter, for the question we had, which of the 40 installed tools does the agent never touch, it's quite terrible.
So we read the tool registry and the skills directory from Hermes, publish hermes.tools.installed and hermes.skills.installed as gauges with one series per entry, and seed the call counters from the same list. hermes.tool.invocations for a tool that was never used reports zero on every export, and a tool that shows up in a call but not in the registry gets tagged with an unknown toolset rather than dropped on the floor.
Subagents get the same treatment: hermes.subagent.spawns and hermes.subagent.runs as counters by role and outcome, hermes.subagent.duration as a histogram, and hermes.subagents.active as a gauge for good measure. Why a gauge on top of the counters? The counters tell us how many subagents ran today, the gauge tells us how many ran at the same time, and the peak is what the subagent monitor triggers on.
The monitors
Setup creates seven monitors along with the datasets. Four have thresholds we can pick (any drop, any error, no data), the other three depend on the workload and the wallet, so setup asks for them with a default that can be accepted by hitting enter:
Monitor | Window | Threshold |
|---|---|---|
Hermes telemetry is being dropped | 15 min | any drop |
Hermes stopped reporting | 30 min | no data |
Hermes provider calls are failing | 30 min | any error |
Hermes tool calls are failing | 30 min | any error |
Hermes token use is high | 15 min | 500,000 tokens |
Hermes spend is high | 60 min | $5.00 per hour |
Hermes subagent fan-out is high | 10 min | 8 running at once |
The queries are MPL, our metrics query language. The spend one turns the cost counter into a rate, scales it up to an hour and sums over the models:
The one for drops is a bit different, a max over five-minute buckets instead of a rate, since the dropped counter only ever goes up and we want to fire on the first drop, not on the drop rate:
Redaction
It goes without saying that we don't look at customer data, not on paid plans and neither on free plans, however telling you so is different from being able to look at the code. So, let's talk about the uncomfortable part. An agent sees prompts, files, tool output and whatever happens to be in the environment, and a telemetry plugin that ships all of that unless told otherwise would be a really bad default. So we have three redaction levels, they're cumulative, and the least revealing one is the default:
Level | What it adds |
|---|---|
| Identifiers, models, token counts, durations, error classes. |
| Tool call arguments, tool results, tool error messages. |
| Model output and provider error text. |
Prompts and the conversation history are never shipped, at any level. An unrecognised value for the setting falls back to metadata, so a typo can't widen what goes out. Below the levels we replace keys whose name looks like a credential (api_key, authorization, client_secret and a few dozen more) with [redacted], cap strings at 12,000 characters, stop nesting at eight levels and collections at 200 entries.
However, the masking works on key names only. A secret that arrives as a value inside a tool result, say a token some command printed to stdout, isn't recognised as one. Scanning values for things that look like secrets is a valid approach and plenty of tools do it, but it catches some formats and misses others, and to us a filter that catches some of them is worse than a limitation everyone knows about.
Failure modes
Everything in the plugin is built to fail towards a working agent and a warning in the log. The OpenTelemetry SDK is an optional dependency, if it's missing we say so at startup and stay idle. If the endpoint is unreachable the export times out, the batch is lost, there is a warning, and the agent doesn't notice. If a payload carries a schema version other than the one we wrote the plugin against, we log a single warning, emit a diagnostic event so the mismatch is visible on the dashboard side as well, and carry on with whatever fields still match. We register the hermes axiom command before the configuration is even read, since that command is how a broken configuration gets fixed.
Setup
hermes axiom setup asks whether to create a new Axiom org or use an existing one (it was fun to use the agentic orgs feature for this!), creates a traces, a logs and a metrics dataset (an agent produces so little data that the free plan covers this for pretty much everyone), creates a token that can only write to those datasets, creates the dashboard and the monitors, asks for the three budgets and writes the result to ~/.hermes/.env. For a new org it prints a claim link, follow it within a day or the org gets deleted again.

If you want notifications for the alerts, you can set them up in the console after claiming the org.