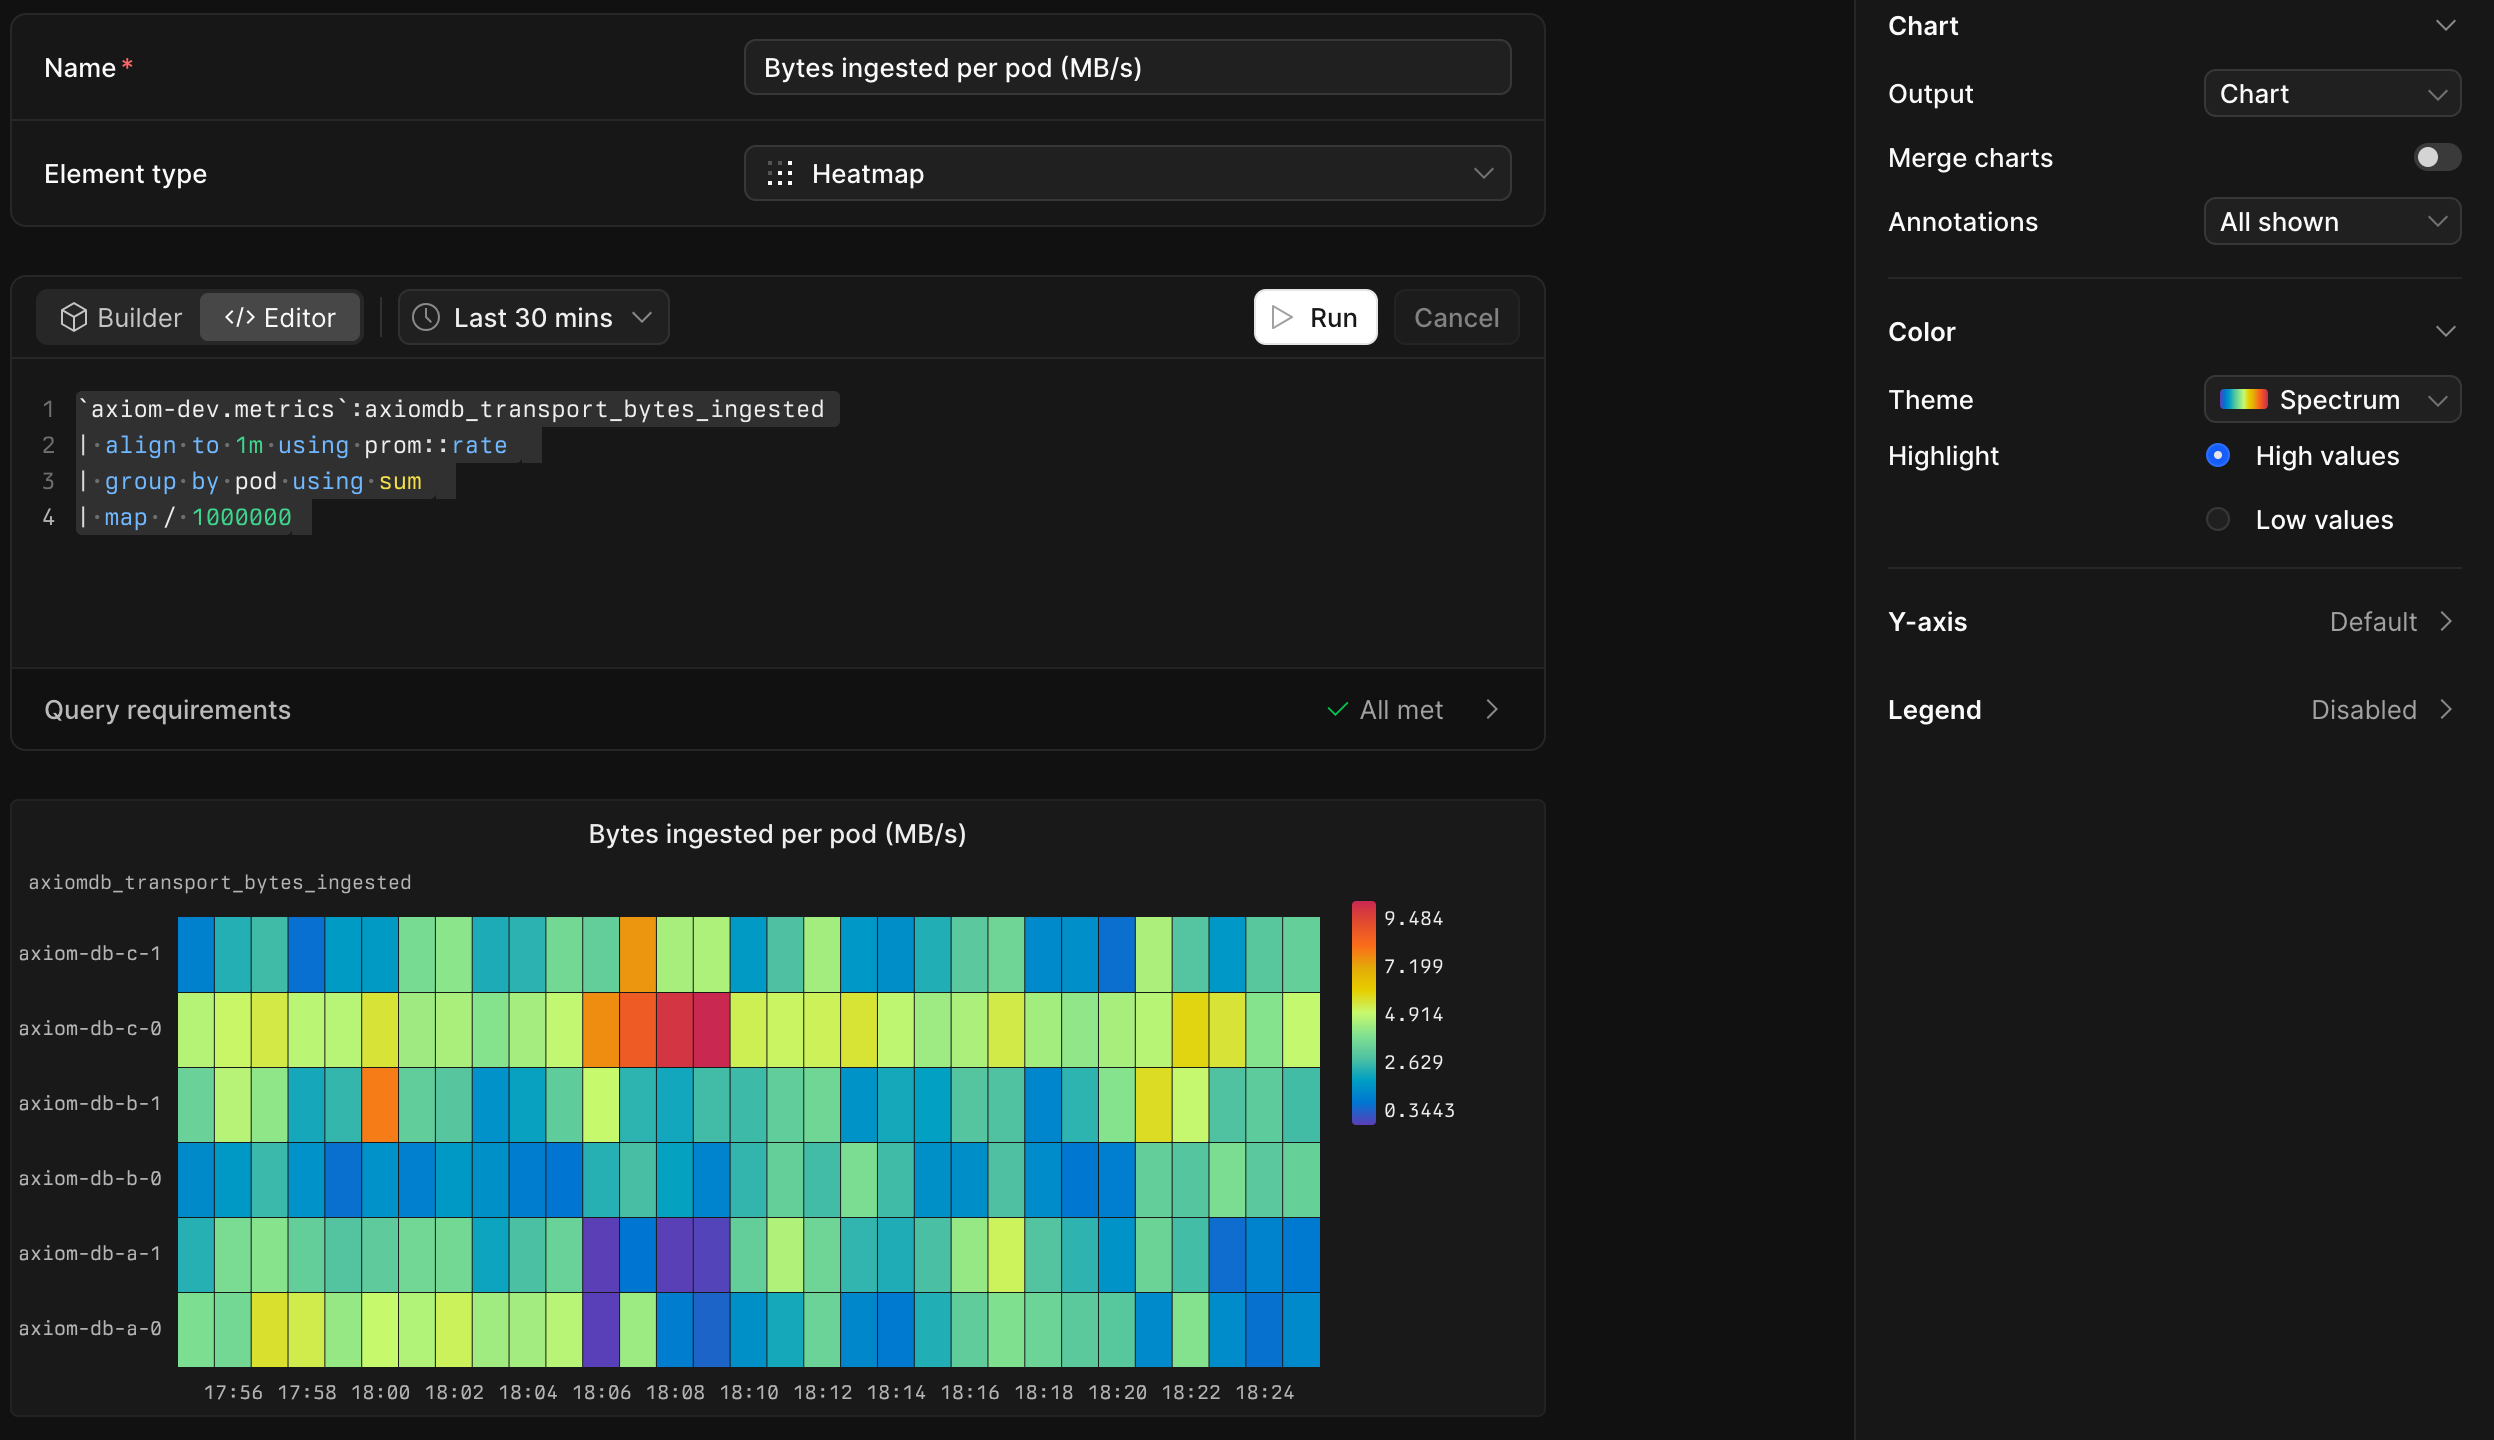
 Heatmap charts on dashboards got a big upgrade. Events heatmaps can now draw one row per group, color themes go beyond a single hue, and dense charts are easier to read.
Grouping
Until now, heatmaps on events datasets only worked with histogram. Now any other single aggregation works too, such as avg, count, or one percentile. Group by _time and one more field, and the heatmap draws one row for each group, colored by its value. You can see at a glance which service, endpoint, or customer stands out, and when.
Gradient themes
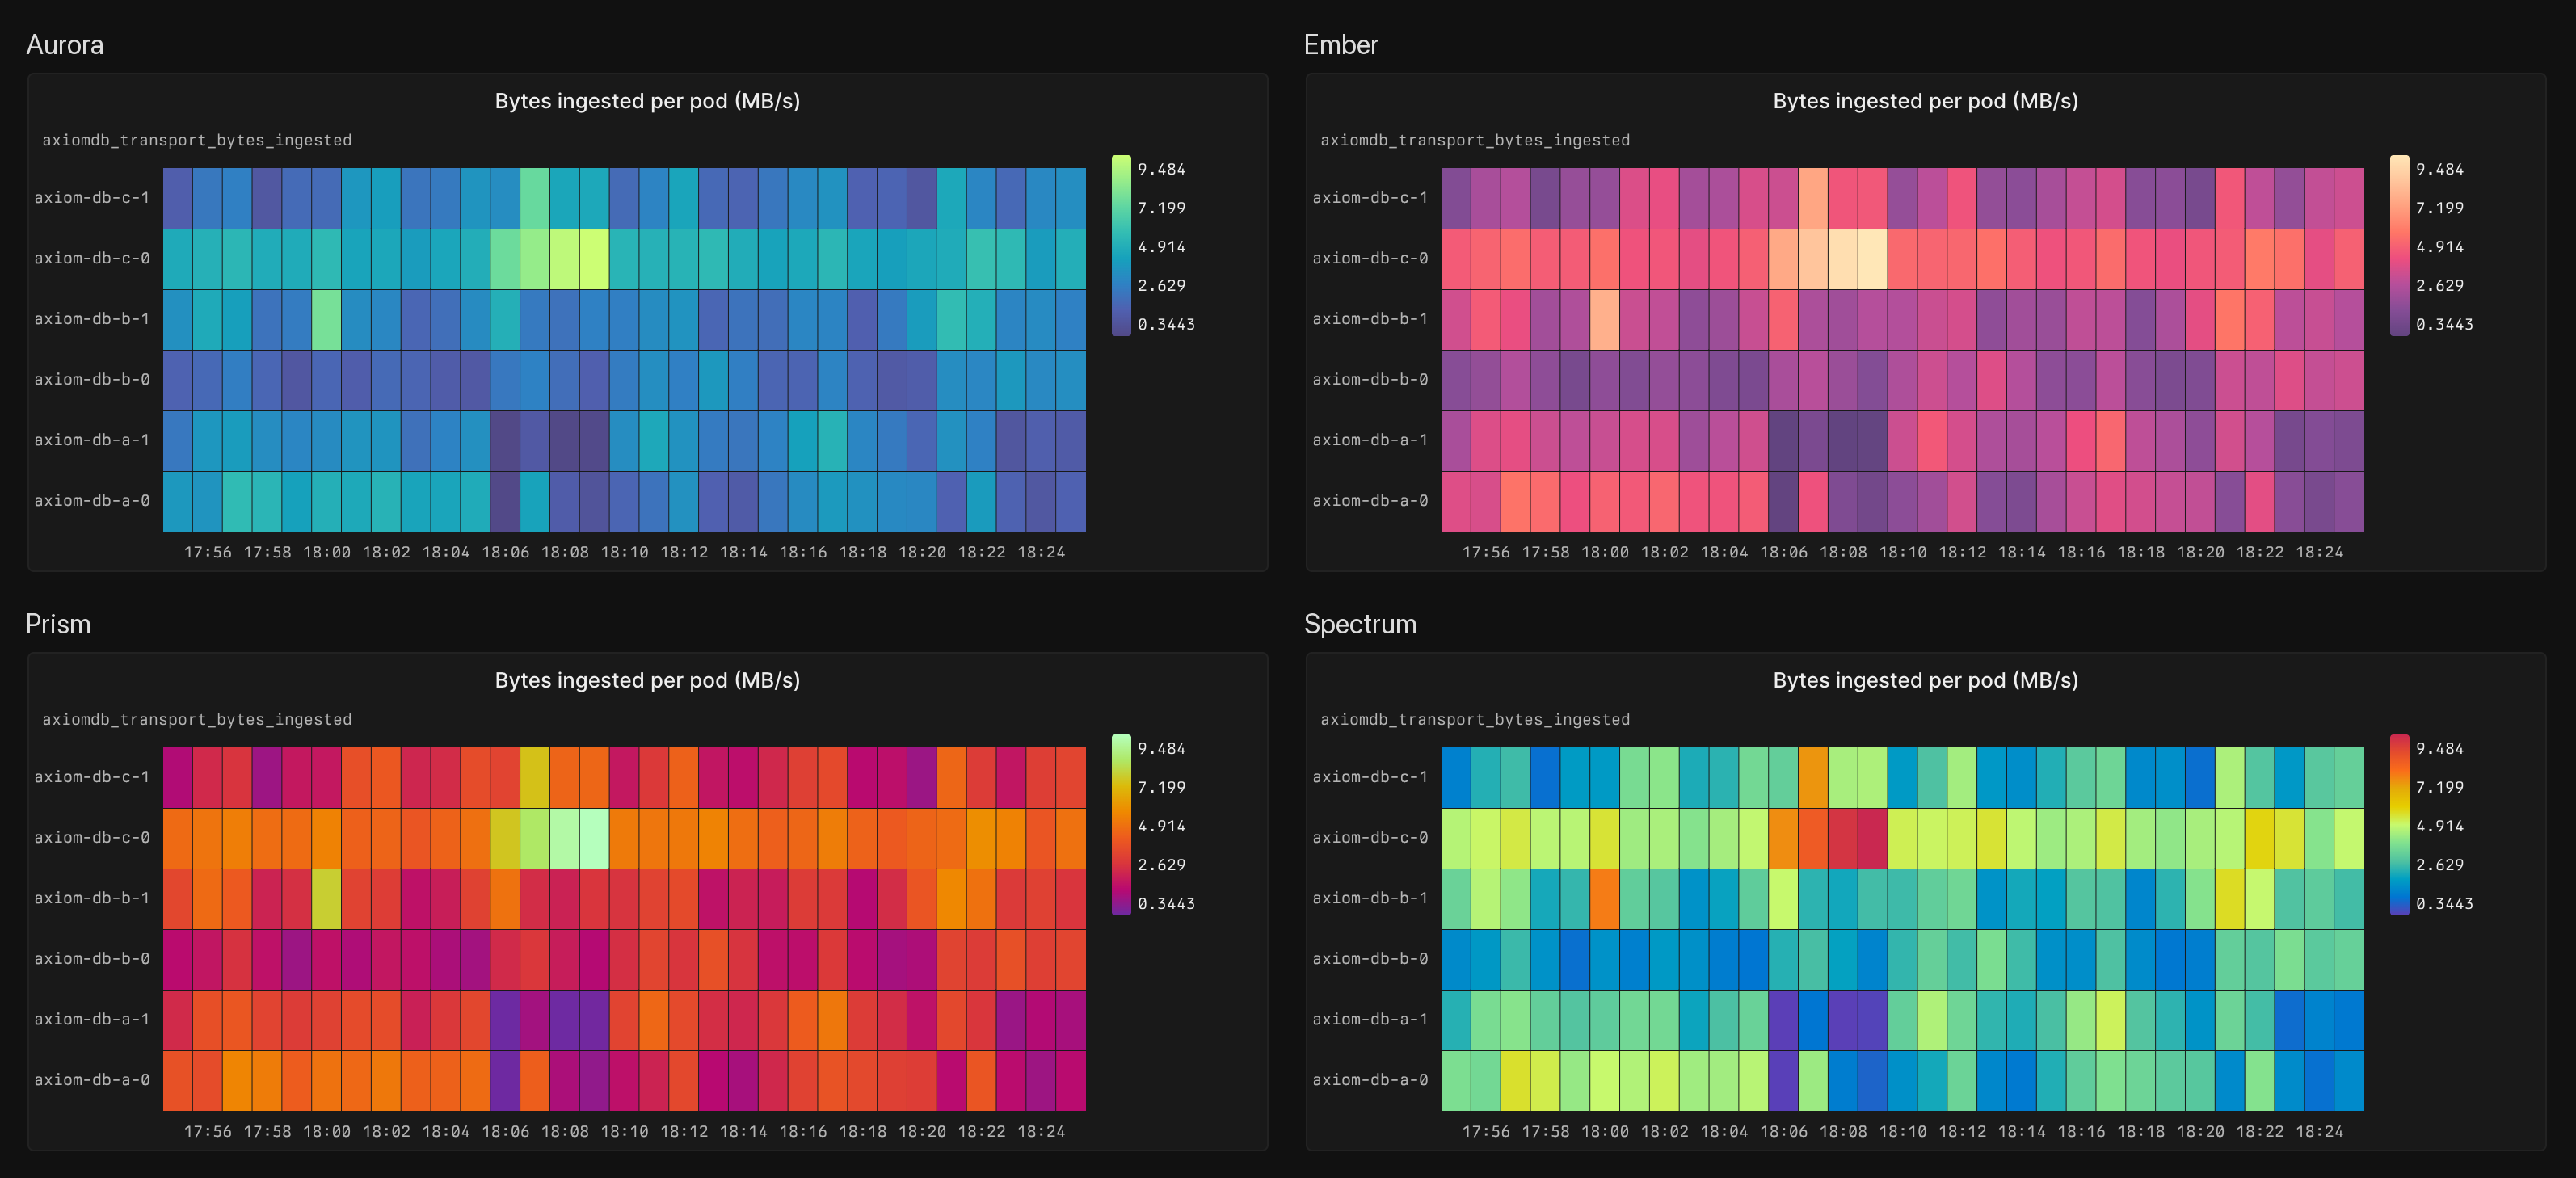 We already had a variety of monochrome themes. Now we are introducing four gradient themes: Aurora, Ember, Prism, and Spectrum.
Each theme has its own stops for light and dark mode, so low values stay visible on both backgrounds.
Highlight high or low values
The new Highlight setting picks which end of the scale gets the strongest color. High values is the default. Select Low values when small numbers are the problem, such as a cache hit ratio or available disk space: healthy cells fade into the background and the dip stands out.
Easier to read
Cell separators: A thin line now separates neighboring cells, so you can tell each time bucket and row apart. On dense charts where cells are only a few pixels wide, the lines drop away so they don't turn into stripes.
Clearer single colors: Single-color themes start at a shade that stays visible against the chart background and end at a much stronger color. Low rows no longer fade into the background. Existing single-color heatmaps pick this up automatically, so they look a little different than before.
Row labels that fit: Heatmaps with one row per group or series have a new Y-axis › Labels setting. Default shows the row labels only when every one of them fits, and otherwise hides them and gives the space to the chart. Select Show to always show labels, or Hide to never show them.
For more information, see Heatmap dashboard elements.