

I remember the first time I went to a Pizza Hut that was also a Taco Bell (yes, my US-centric thought is bleeding out here but bear with me). I thought maybe I had died and gone to heaven, and then my dreams were confirmed when I realized how well Fire Sauce compliments a pepperoni pizza. You can have two great things, but it’s when they mix just right that it truly blows your mind.
In this spirit, today we’re pleased to announce the Axiom Netlify integration is now available for logging your Netlify sites and applications. Using the Netlify integration, you can monitor your site requests, track application routes with errors, and get the average request duration from your applications hosted on Netlify. Plus, you can easily leverage the monitors for key Netlify metrics to notify you of any errored requests and function cache performance issues.
In this post, we'll explain how the Netlify integration can help you:
- Visualize activity across your Netlify sites.
- Drill down to site issues to get more context.
- Catch Netlify site errors using monitors.
- Collect logs to track the health and performance of your Netlify sites.
To get started immediately, you can see our documentation for instructions on configuring the Netlify integration and enabling log collection from your Netlify sites and applications.
Note: This integration is only available for Netlify customers on plans where Log Drains are supported - usually Enterprise.
Visualize activity across your Netlify sites
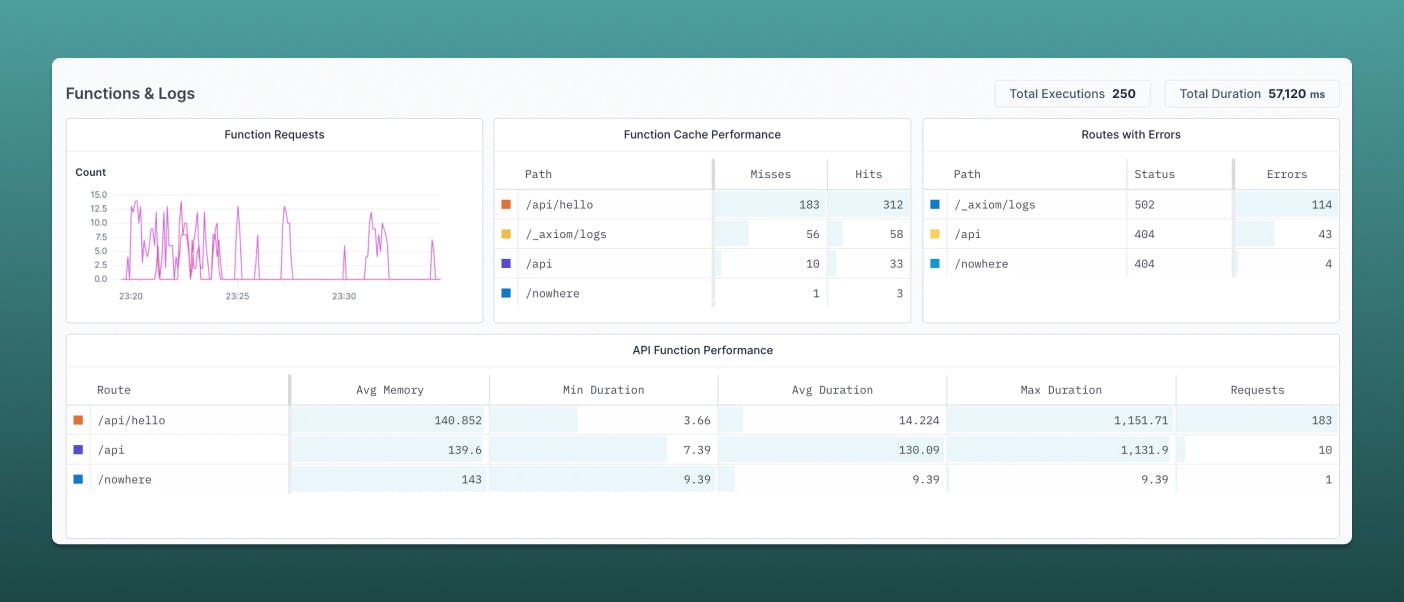
The Netlify integration dashboard helps you visualize logs for every component on your site, allowing you to see how your site executes requests over time. On the sophisticated dashboard, you can access information such as how many site requests are occurring and how many are successful or failing, giving you granular visibility into your site configuration. The advanced dashboard lets you view information about your site’s routes and error status to optimize performance.
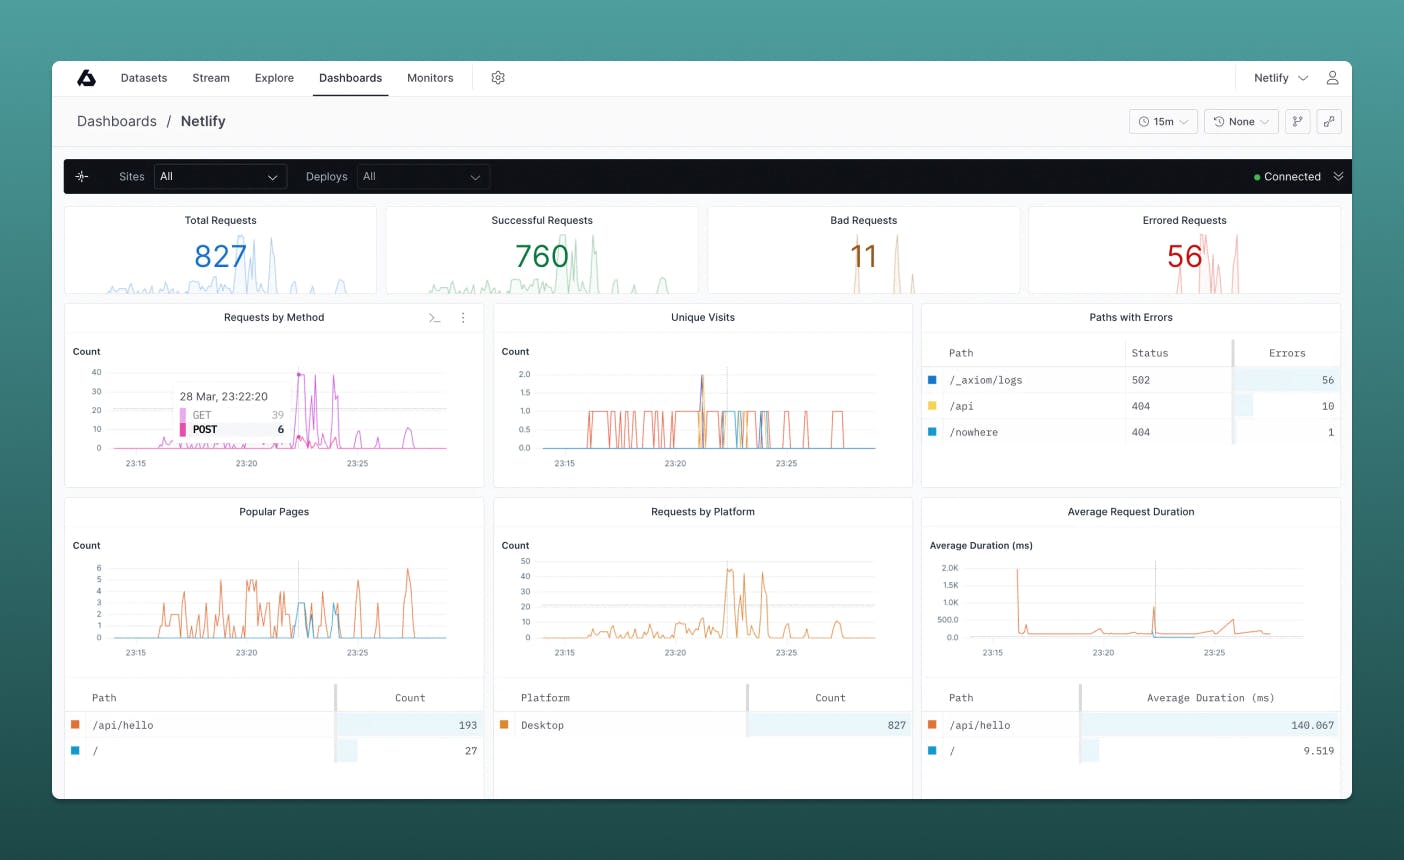
With this data, you can quickly spot routes with Errors and API function performance issues that could affect your Netlify sites.
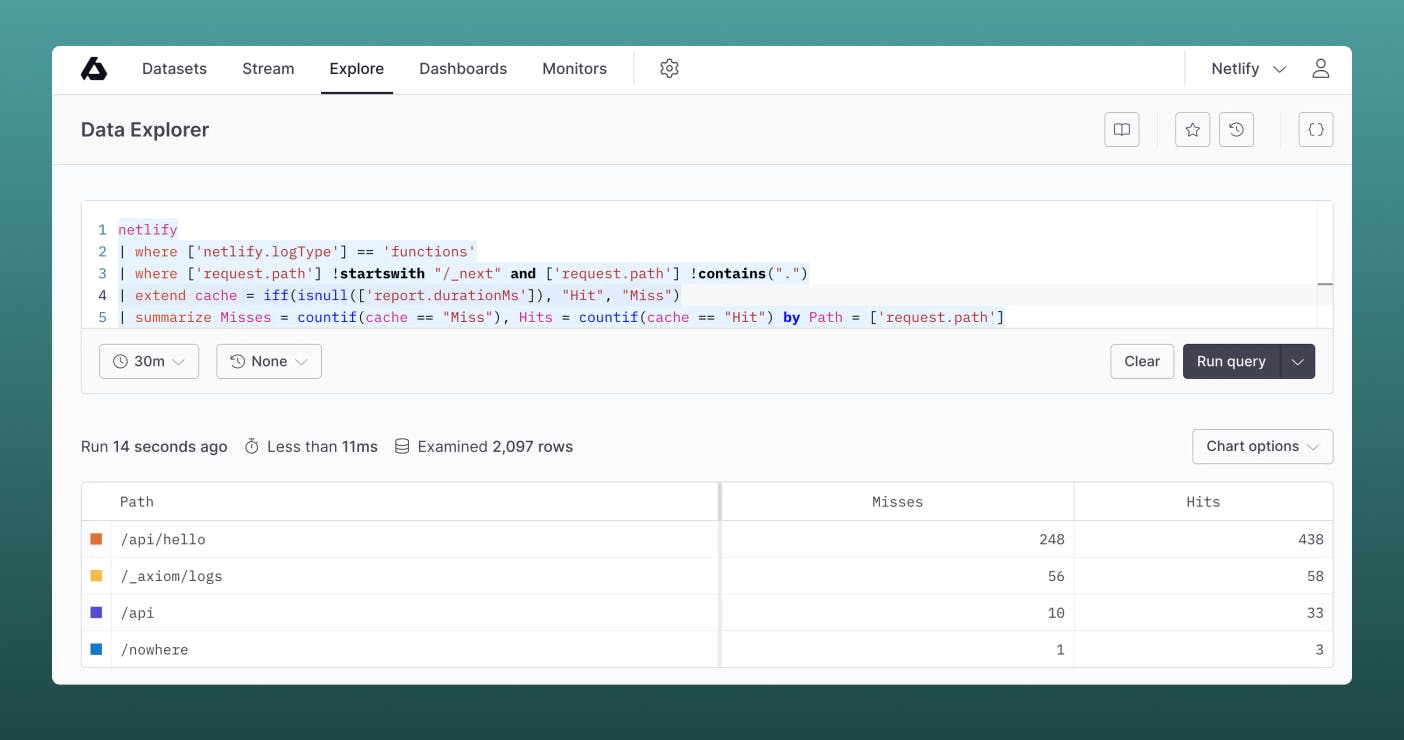
Drill down to site issues to get more context
Axioms Netlify integration collects key metrics and logs that provide greater visibility into your Netlify sites, as well as the health and performance of your applications hosted in Netlify. You can dig deeper into your site’s performance with Axiom Processing Language. Let’s say you receive an error while attempting to deploy a change to your Netlify configuration; you can switch to Data Explorer to see what caused the error in your site. All the relevant error logs and total logs by level will be displayed for you.
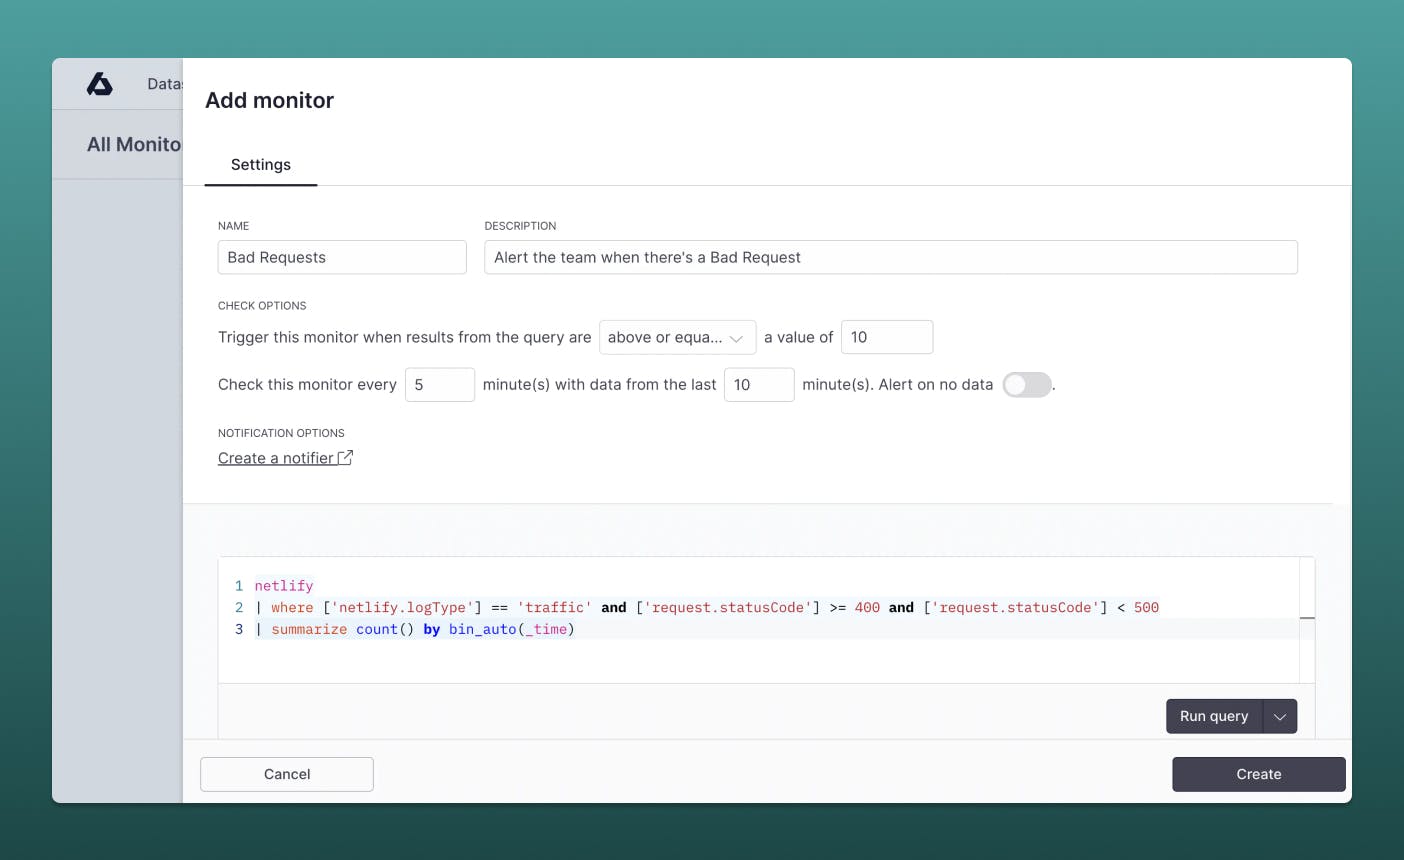
Alert on your errors to stay ahead of issues
To catch issues in your Netlify sites faster, you can set up Axiom monitors to alert and notify you of requests and performance issues. For example, you can configure monitors to alert you when your site gets a bad request or when there’s a spike in your average request duration.
Setting up error-tracking monitors on your Netlify sites can alert your team through integrations like Slack and PagerDuty, ensuring everyone is aware of critical issues and act as soon as possible.
Axiom is working with the Netlify team to streamline this even further from Netlify’s side, but you can get started today. Dive in! We’re even better together. Take a look at our hobby tier, a free trial, or get in touch.
Enable Zero Config Observability on your Netlify sites
Head to the documentation today to install and set up the advanced logging and monitoring on your Netlify sites.
- Come share ideas and feedback with us on our Discord Community.


