
Staying on top of your Redis metrics and redis performance latency can be a great way to find Redis metrics errors, hashes, redis performance, pub/sub data, metrics events, total number of Redis performance logs between your RDB Redis integrations, Redis database, Redis cluster, and Redis deployments before they even occur. However, monitoring redis performance network traffic is unattainable for many developers and Redis database engineers as so much redis data is produced that ingesting & storing the Redis data and Redis metrics increases costs exponentially.
Thankfully, with Axiom, you can monitor as much as you want at high throughput, Redis metrics without worrying about huge Redis bills at the end of the month or unexpected performance monitoring sampling of your data. Even better, Axiom’s storage is so cheap that you can keep more of your Redis metrics, slowlog, allocator, Redis datastore, and Redis performance data for longer, which enables you to compare your Redis metrics, memory usage, Redis latency, operating system events, message broker, and redis performance data across a year or more as easily as over the last hour.
In this post, I will show you how to analyze & capture Redis performance in real-time from Redis memory using the Redis config on Axiom.
You’ll also learn how to:
-
Use Axiom to sort Redis metrics noise
-
Identify Key Redis performance metrics and Redis monitoring issues
-
Track Redis memory usage
-
Identify errors in your Redis cluster
Prerequisites
- Axiom Dataset & Token
- Access to an Axiom deployment
- Packetbeat Installed on your machine
- Redis protocol configured.
Use Axiom and Redis for better performance monitoring
- Visit our docs to copy, edit and configure your Redis protocol port from the
packetbeat.ymlfile.
# Disable index lifecycle management (ILM)
setup.ilm.enabled: false

# network device to capture traffic from
packetbeat.interfaces.device: en0

# Configure the maximum size of the packets to capture
packetbeat.interfaces.snaplen: 44937833987

# Configure Sniffing & traffic capturing options
packetbeat.interfaces.type: pcap

# Configure the maximum size of the shared memory buffer to use
packetbeat.interfaces.buffer_size_mb: 400
packetbeat.interfaces.auto_promisc_mode: true
packetbeat.flows:
  timeout: 30s
  period: 10s
protocols:
  dns:
    ports: [53]
    include_authorities: true
    include_additionals: true
  redis:
    ports: [6379]

output.elasticsearch:
  hosts: [""$YOUR_AXIOM_URL:443/api/v1/datasets/<dataset>/elastic"]
  # api_key can be your ingest or personal token
api_key: "user:token"- Generate your ingest token,
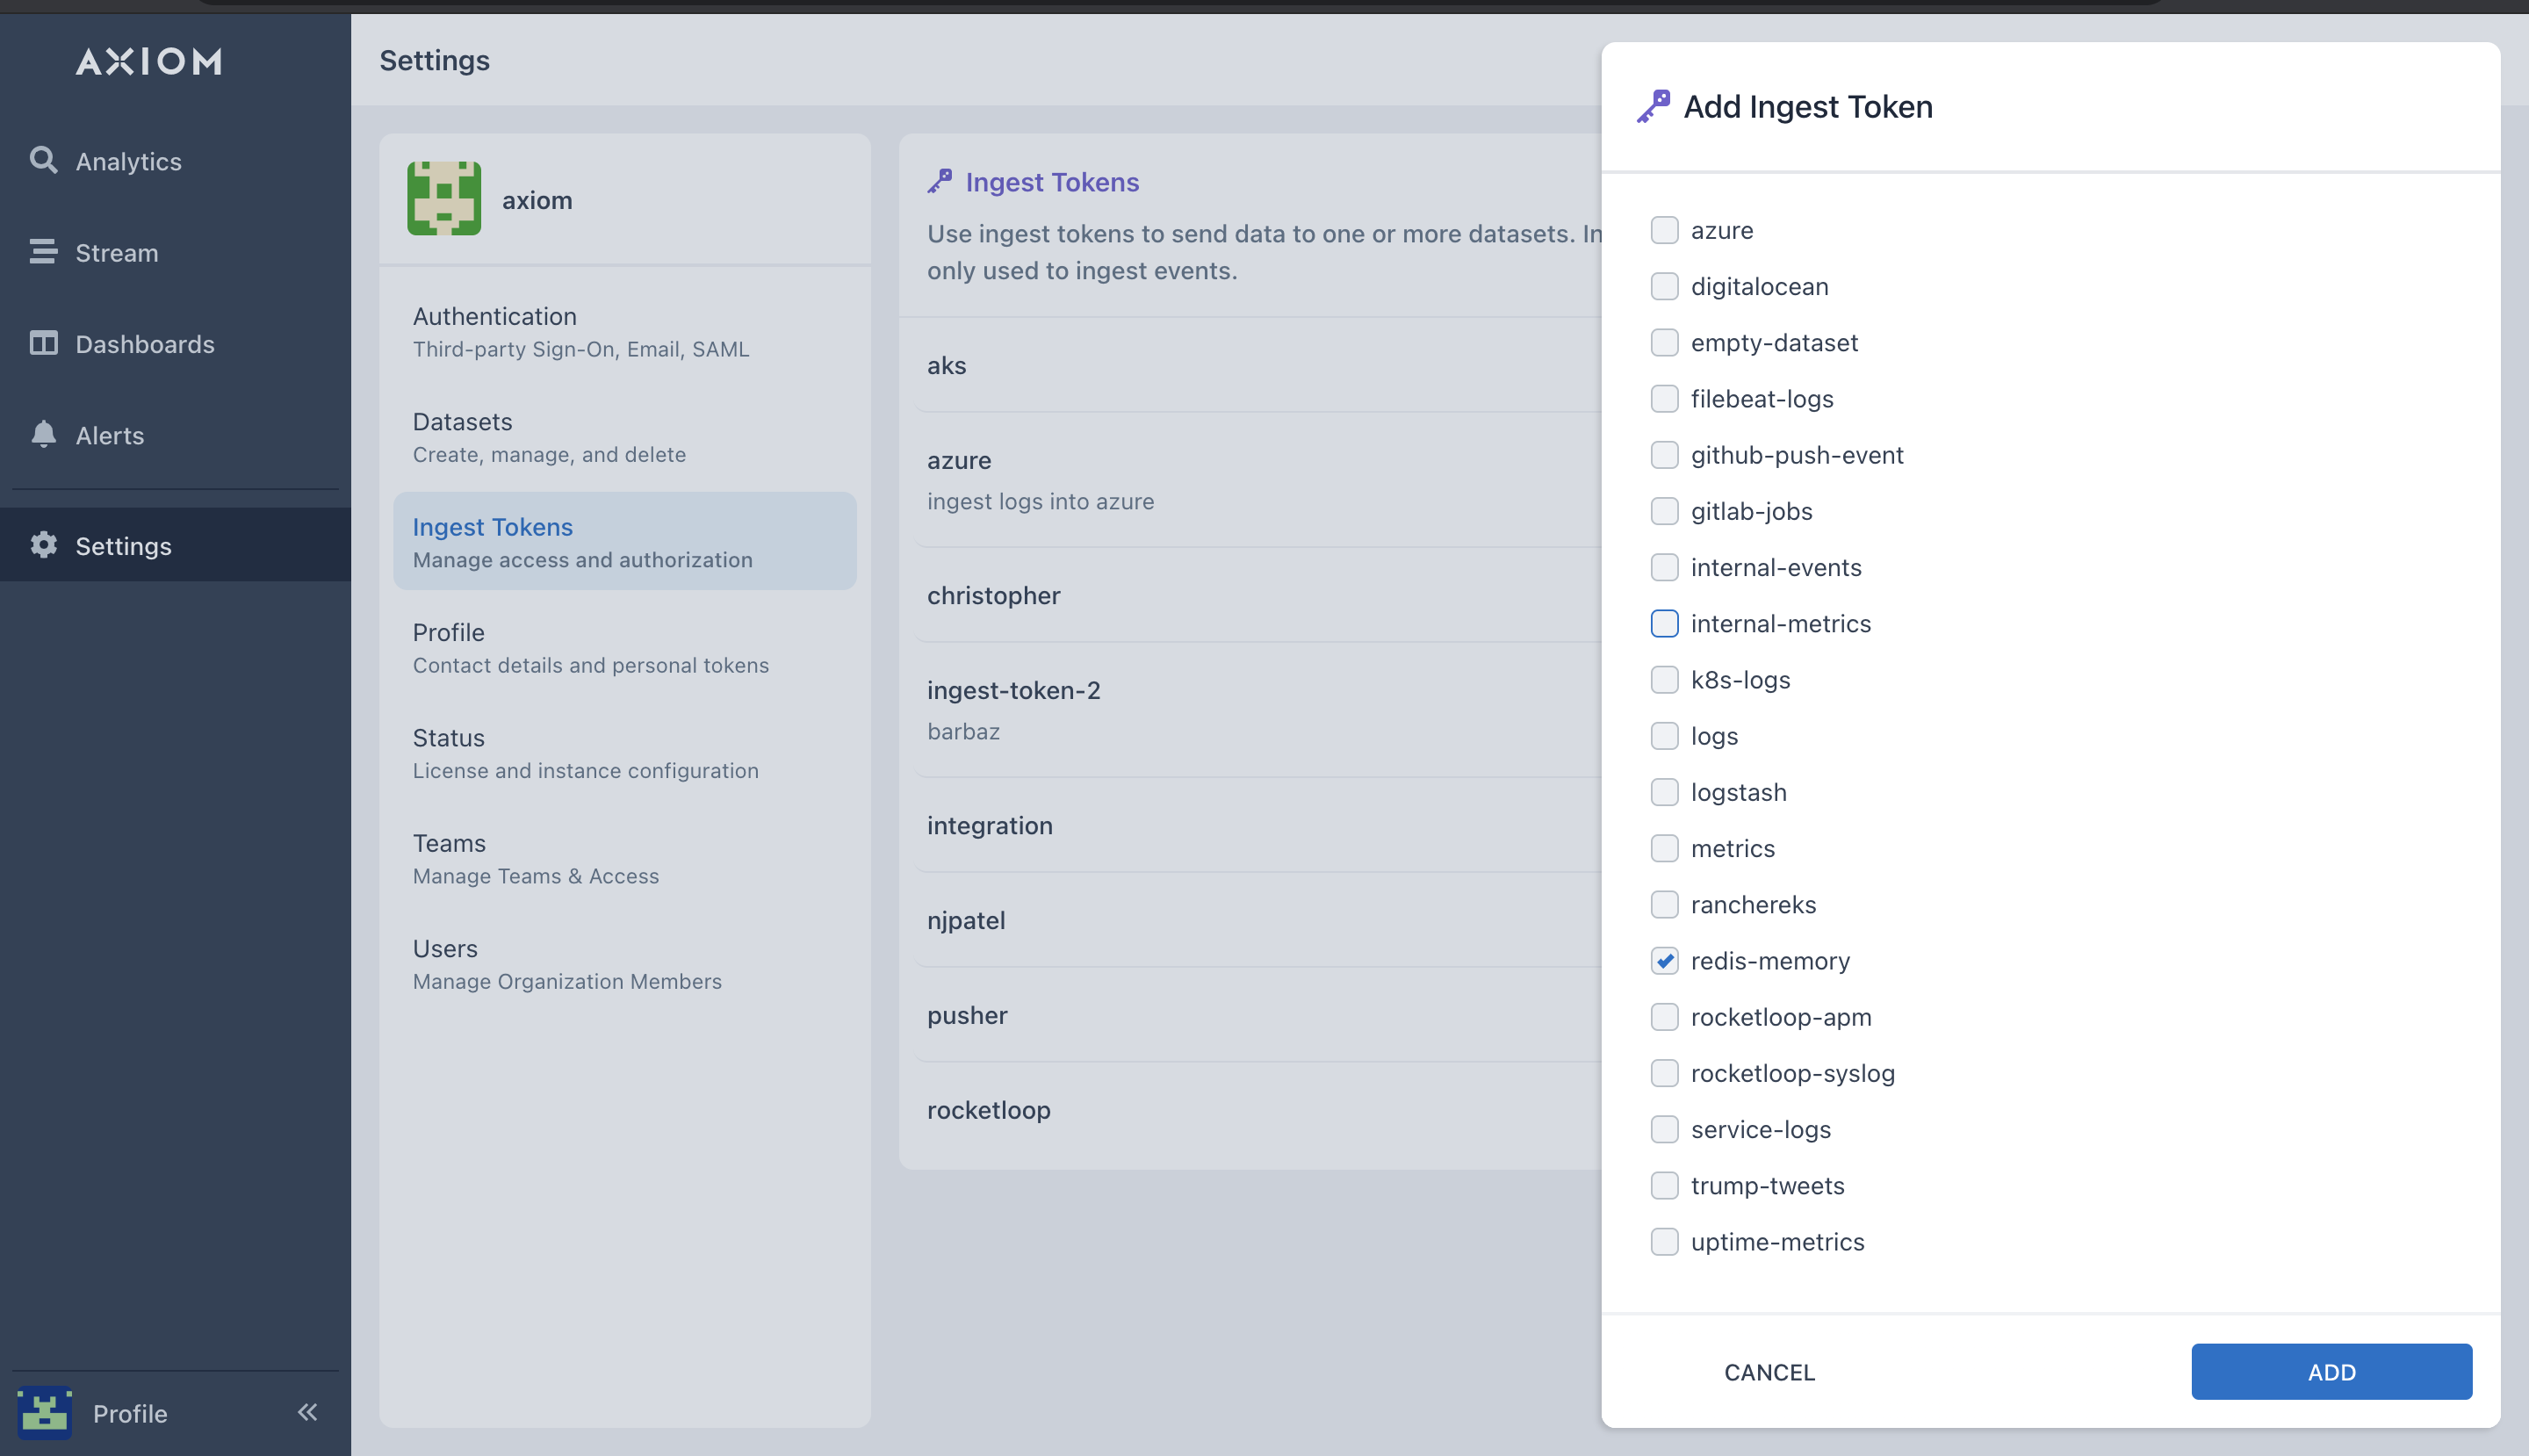
- In the Axiom UI, click on settings, select ingest token.
- Select Add ingest token.
- Enter a name and description and select ADD.
- Copy the generated token to your clipboard. Once you navigate from the page, the token can be seen again by selecting Ingest Tokens.
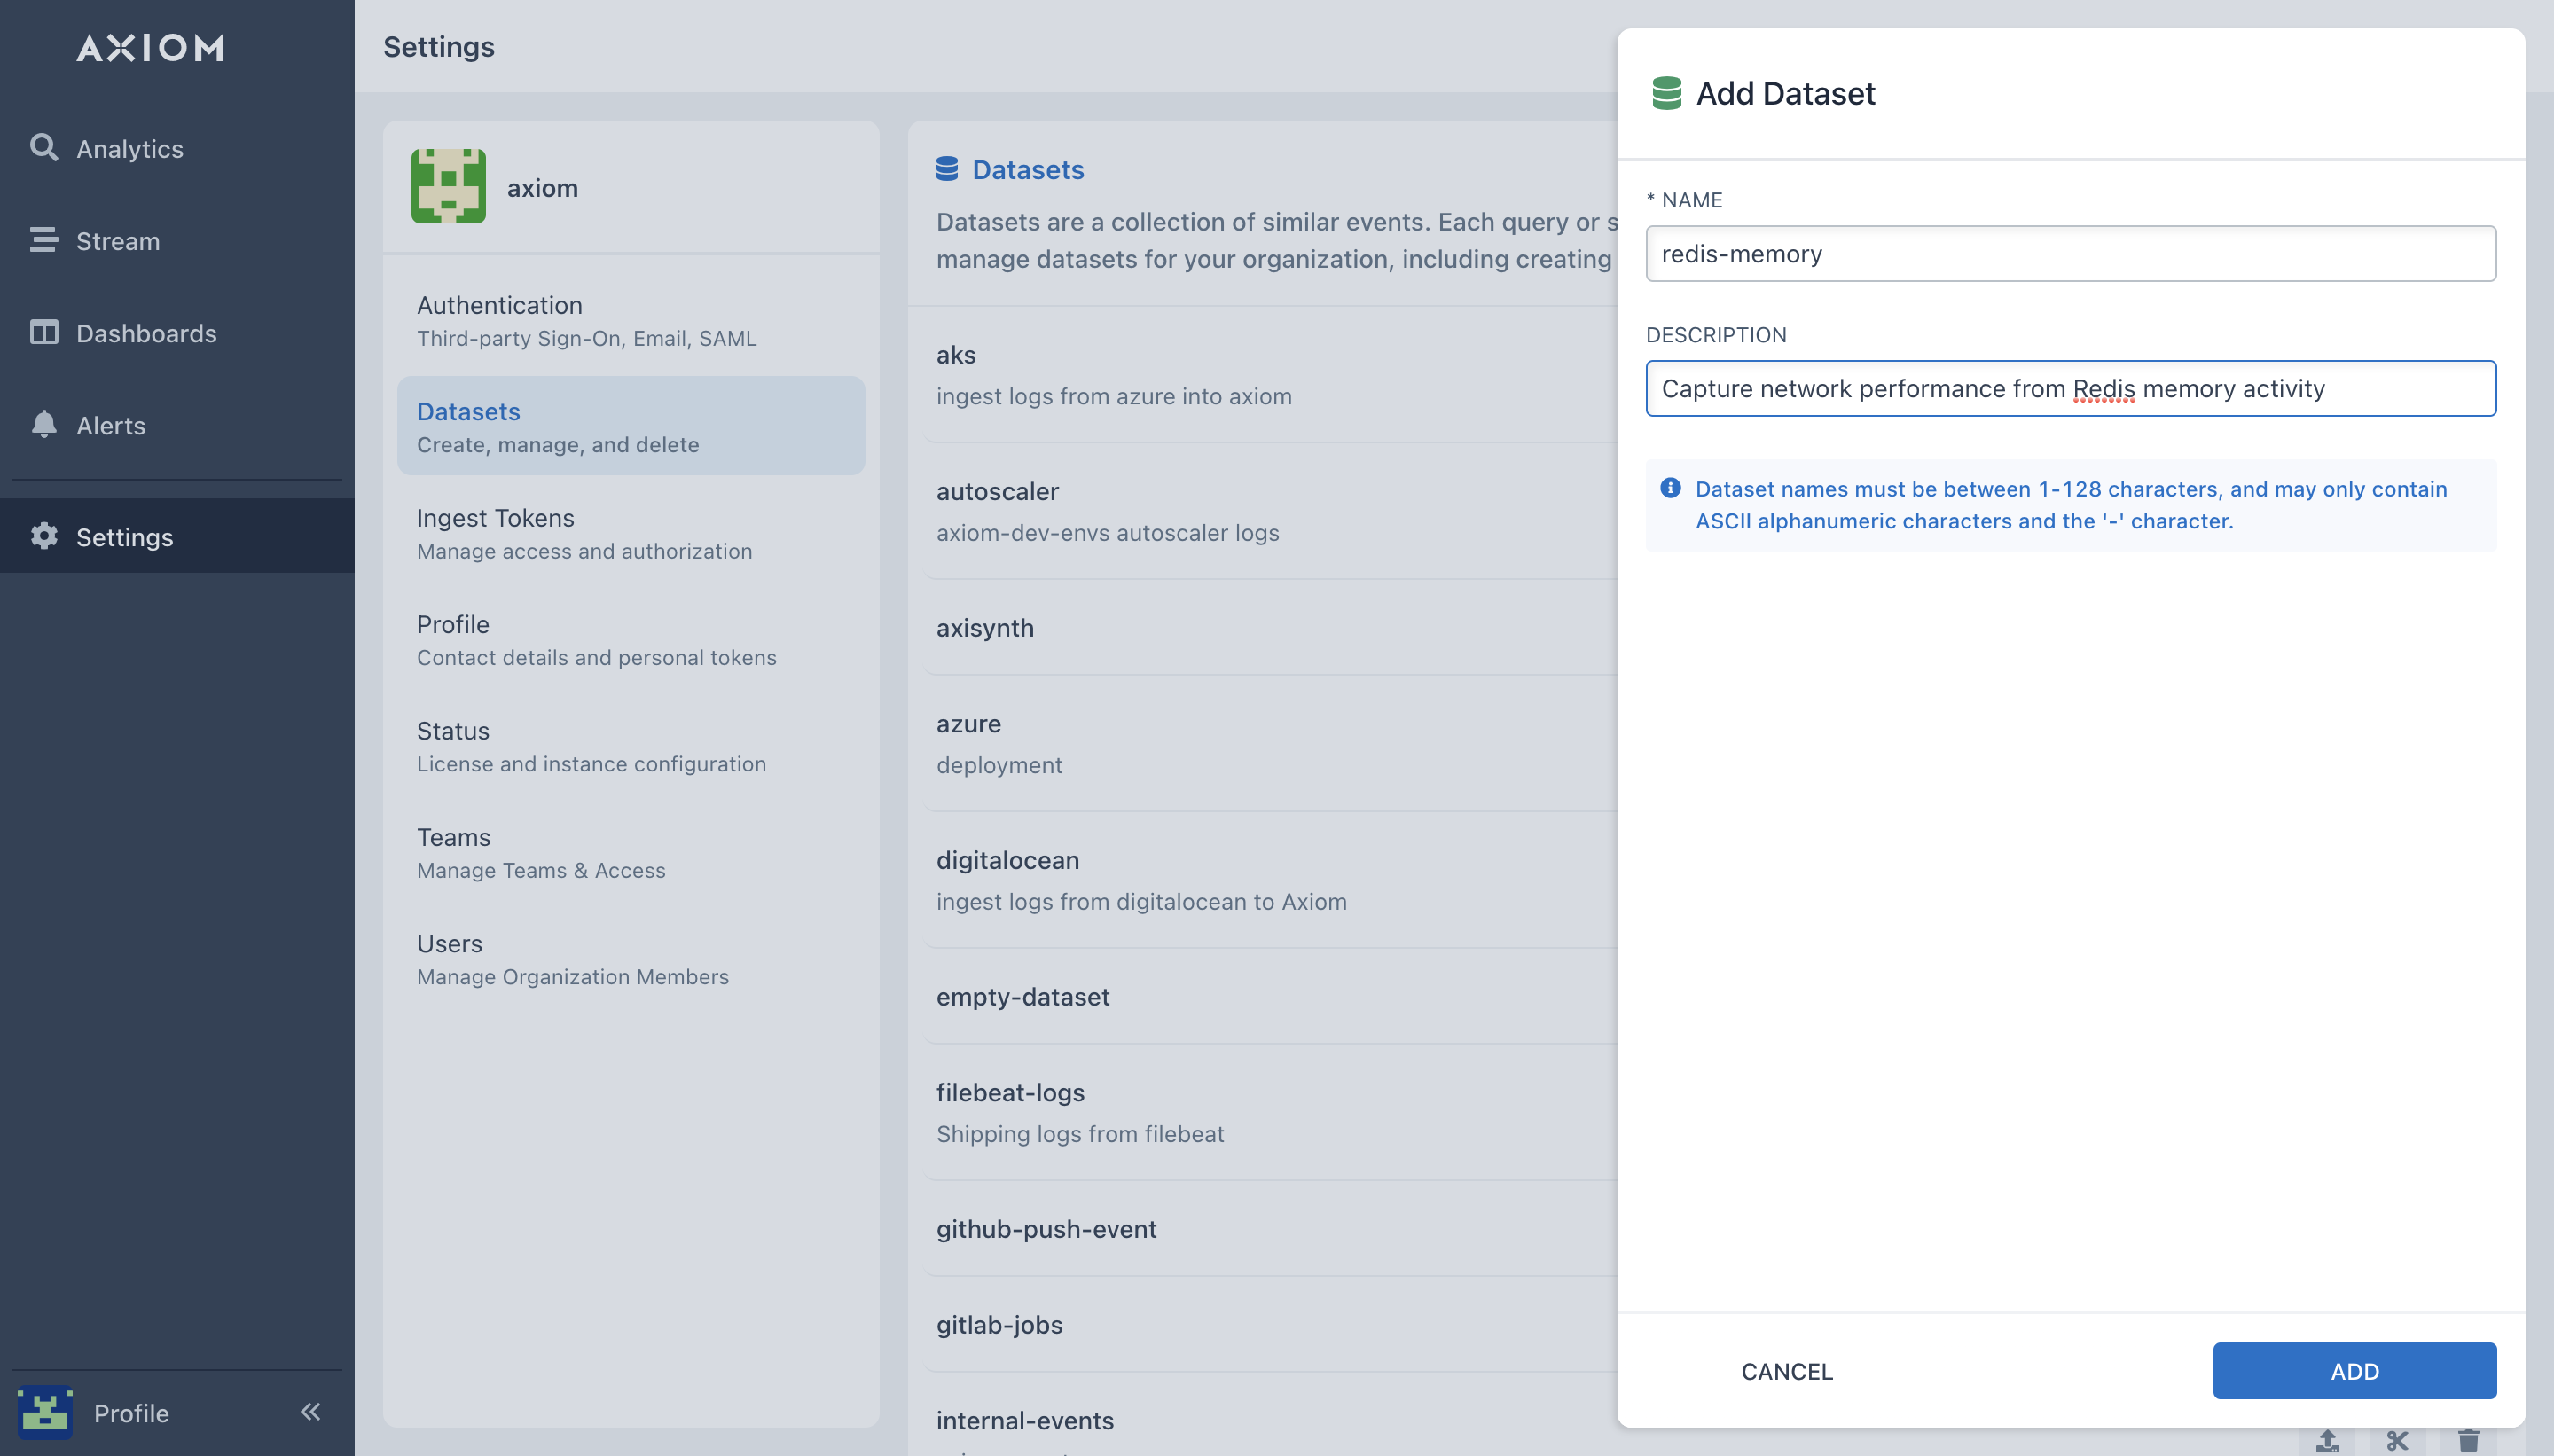
- Track your Redis performance logs, CPU, memory usage, redis metrics, and rejected connections metrics in your dataset created on Axiom. To create a dataset on Axiom, select Settings → Datasets on the Axiom UI.
-
Update the changes with the new Host URL and Dataset name on your Redis metrics configuration file so you can ingest Redis performance monitoring number of client errors, memory usage, throughput data, used memory, and fragmentation ratio into Axiom.
-
Analyse and get queries using different aggregations on the Axiom UI. You can group and extract statistics/insights from your Redis memory usage, Redis metrics by running aggregations across your Redis integrations and Redis metrics dataset: Below is a list of aggregations you can run on your Redis dataset.
Redis Monitoring Aggregations:
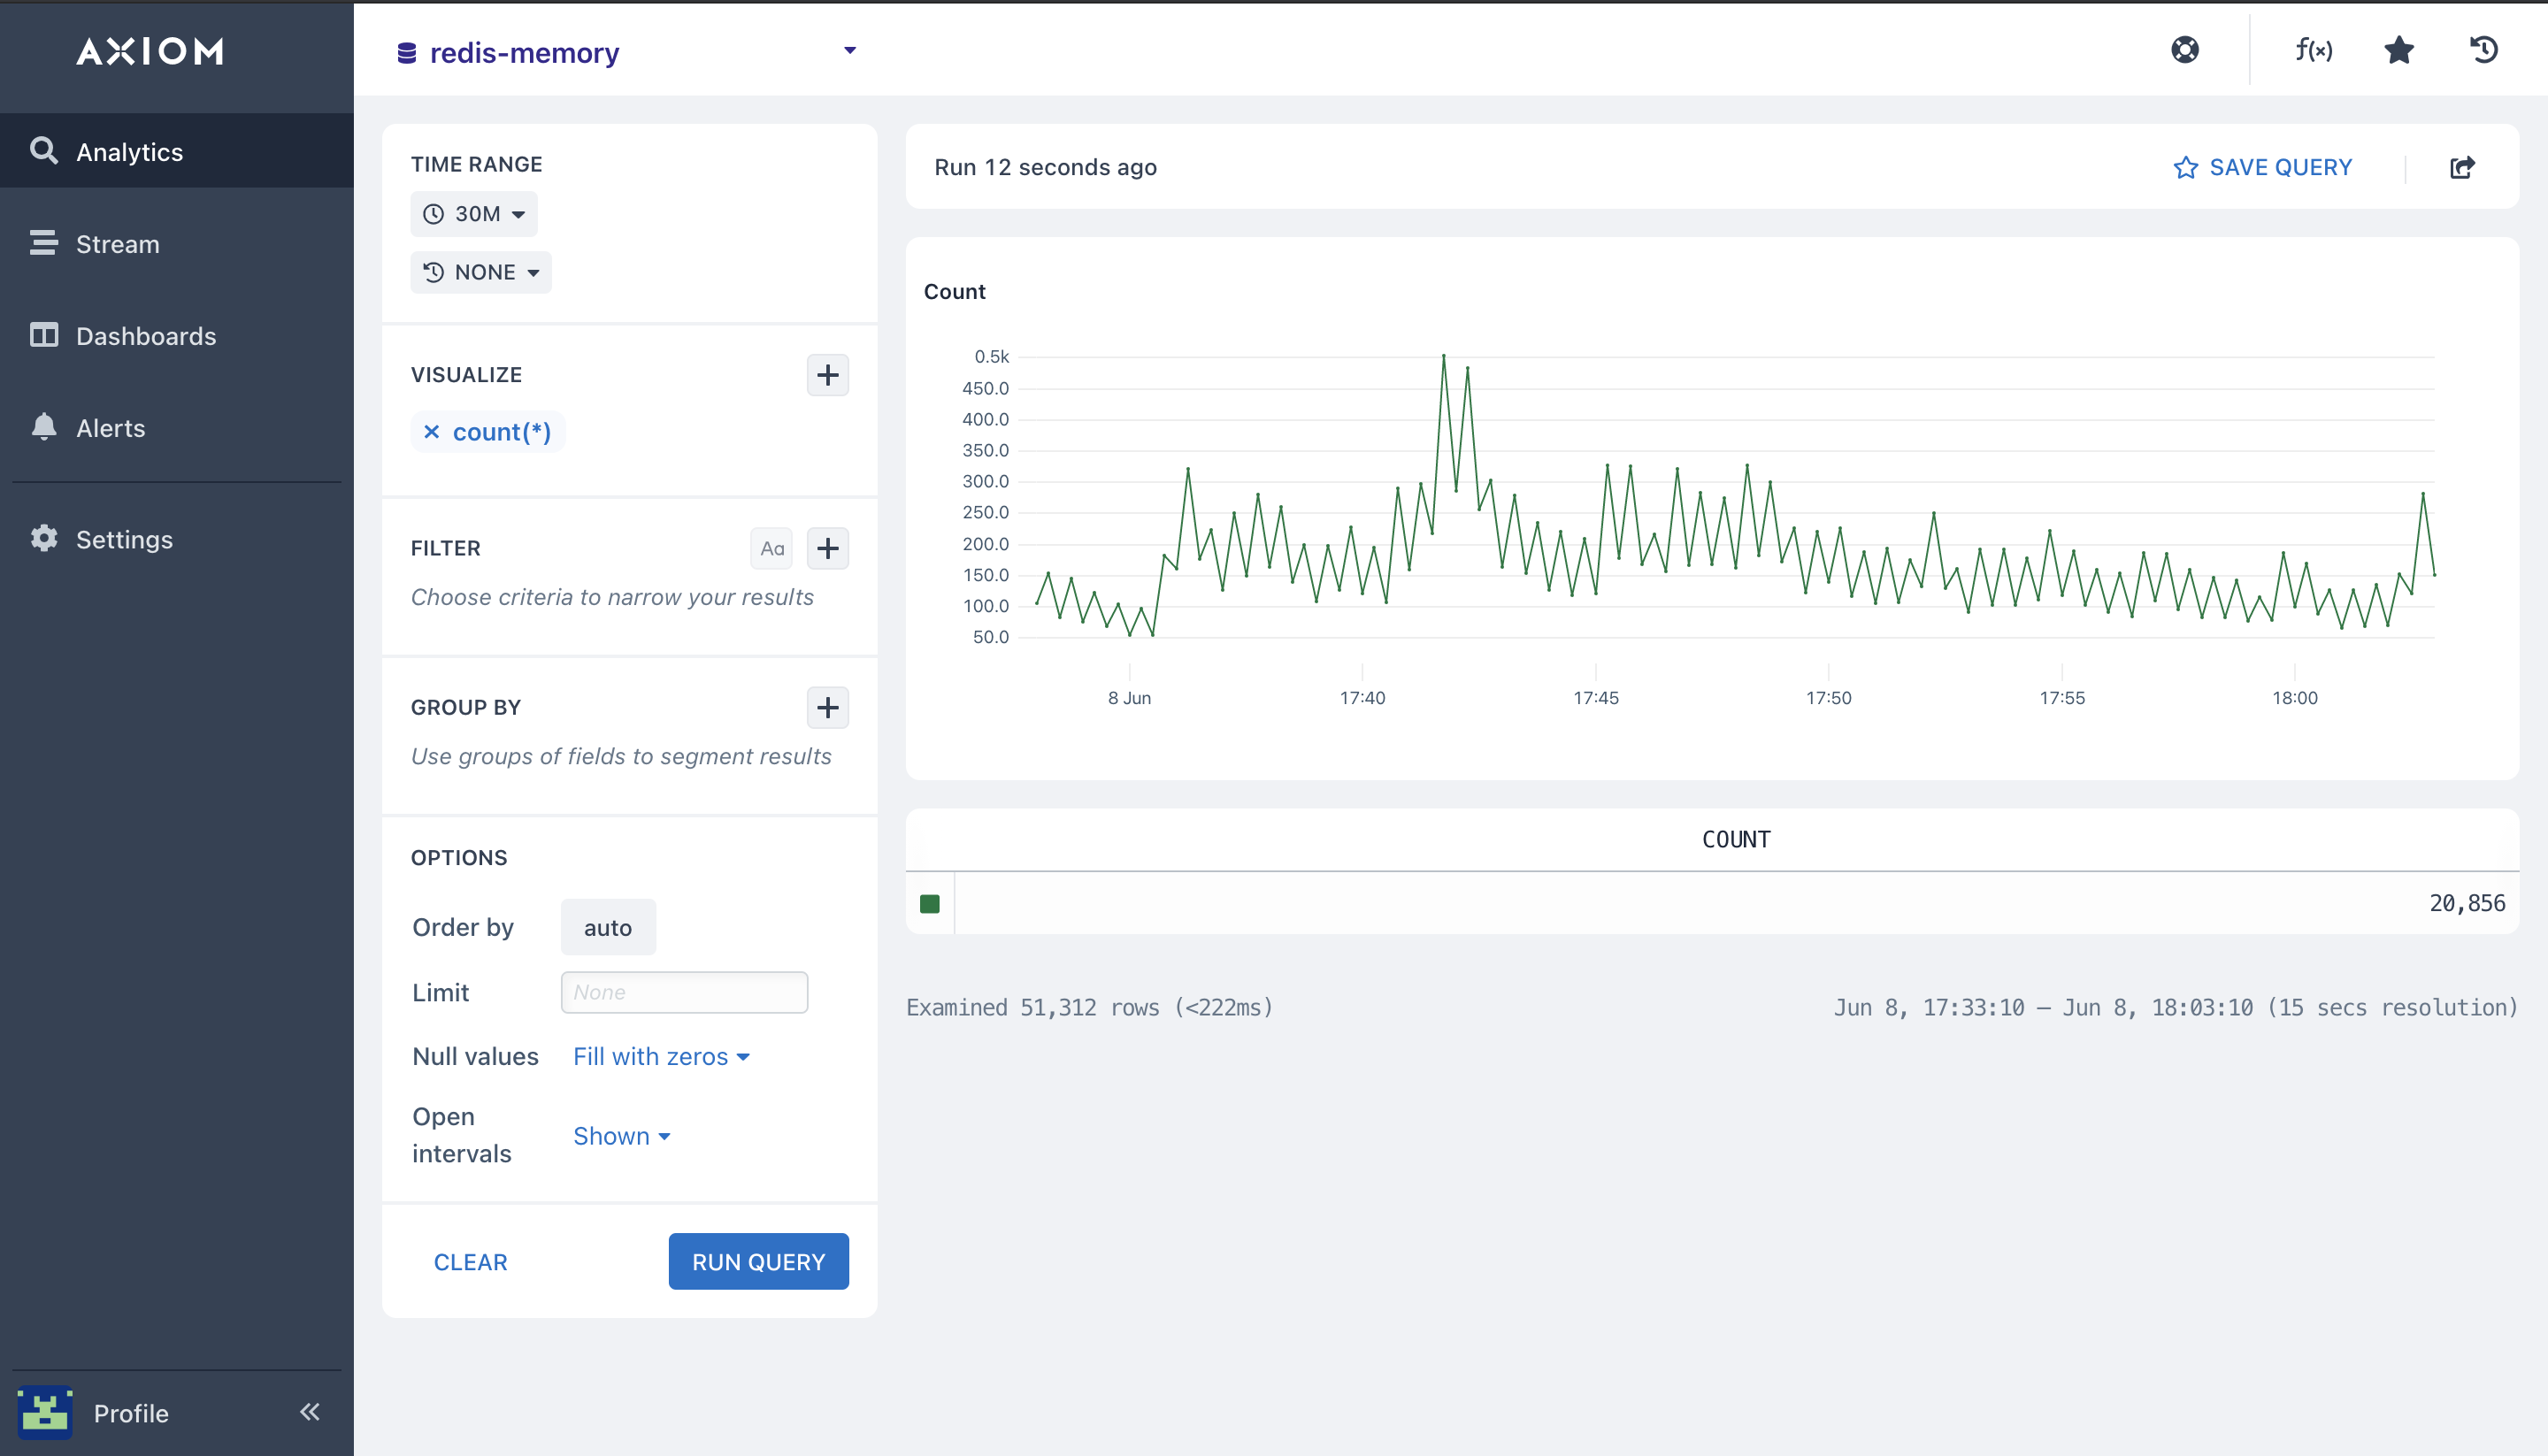
- Count(): Here I am running the
countaggregation, this will count all matching Redis metrics, and Redis performance events in your Redis dataset, bucketed by a time duration, a line chart is then rendered with the returned data that shows the number of Redis metrics, and Redis monitoring events in each time data in your Redis metrics, and Redis performance usage and nosql Redis logs in your graph.
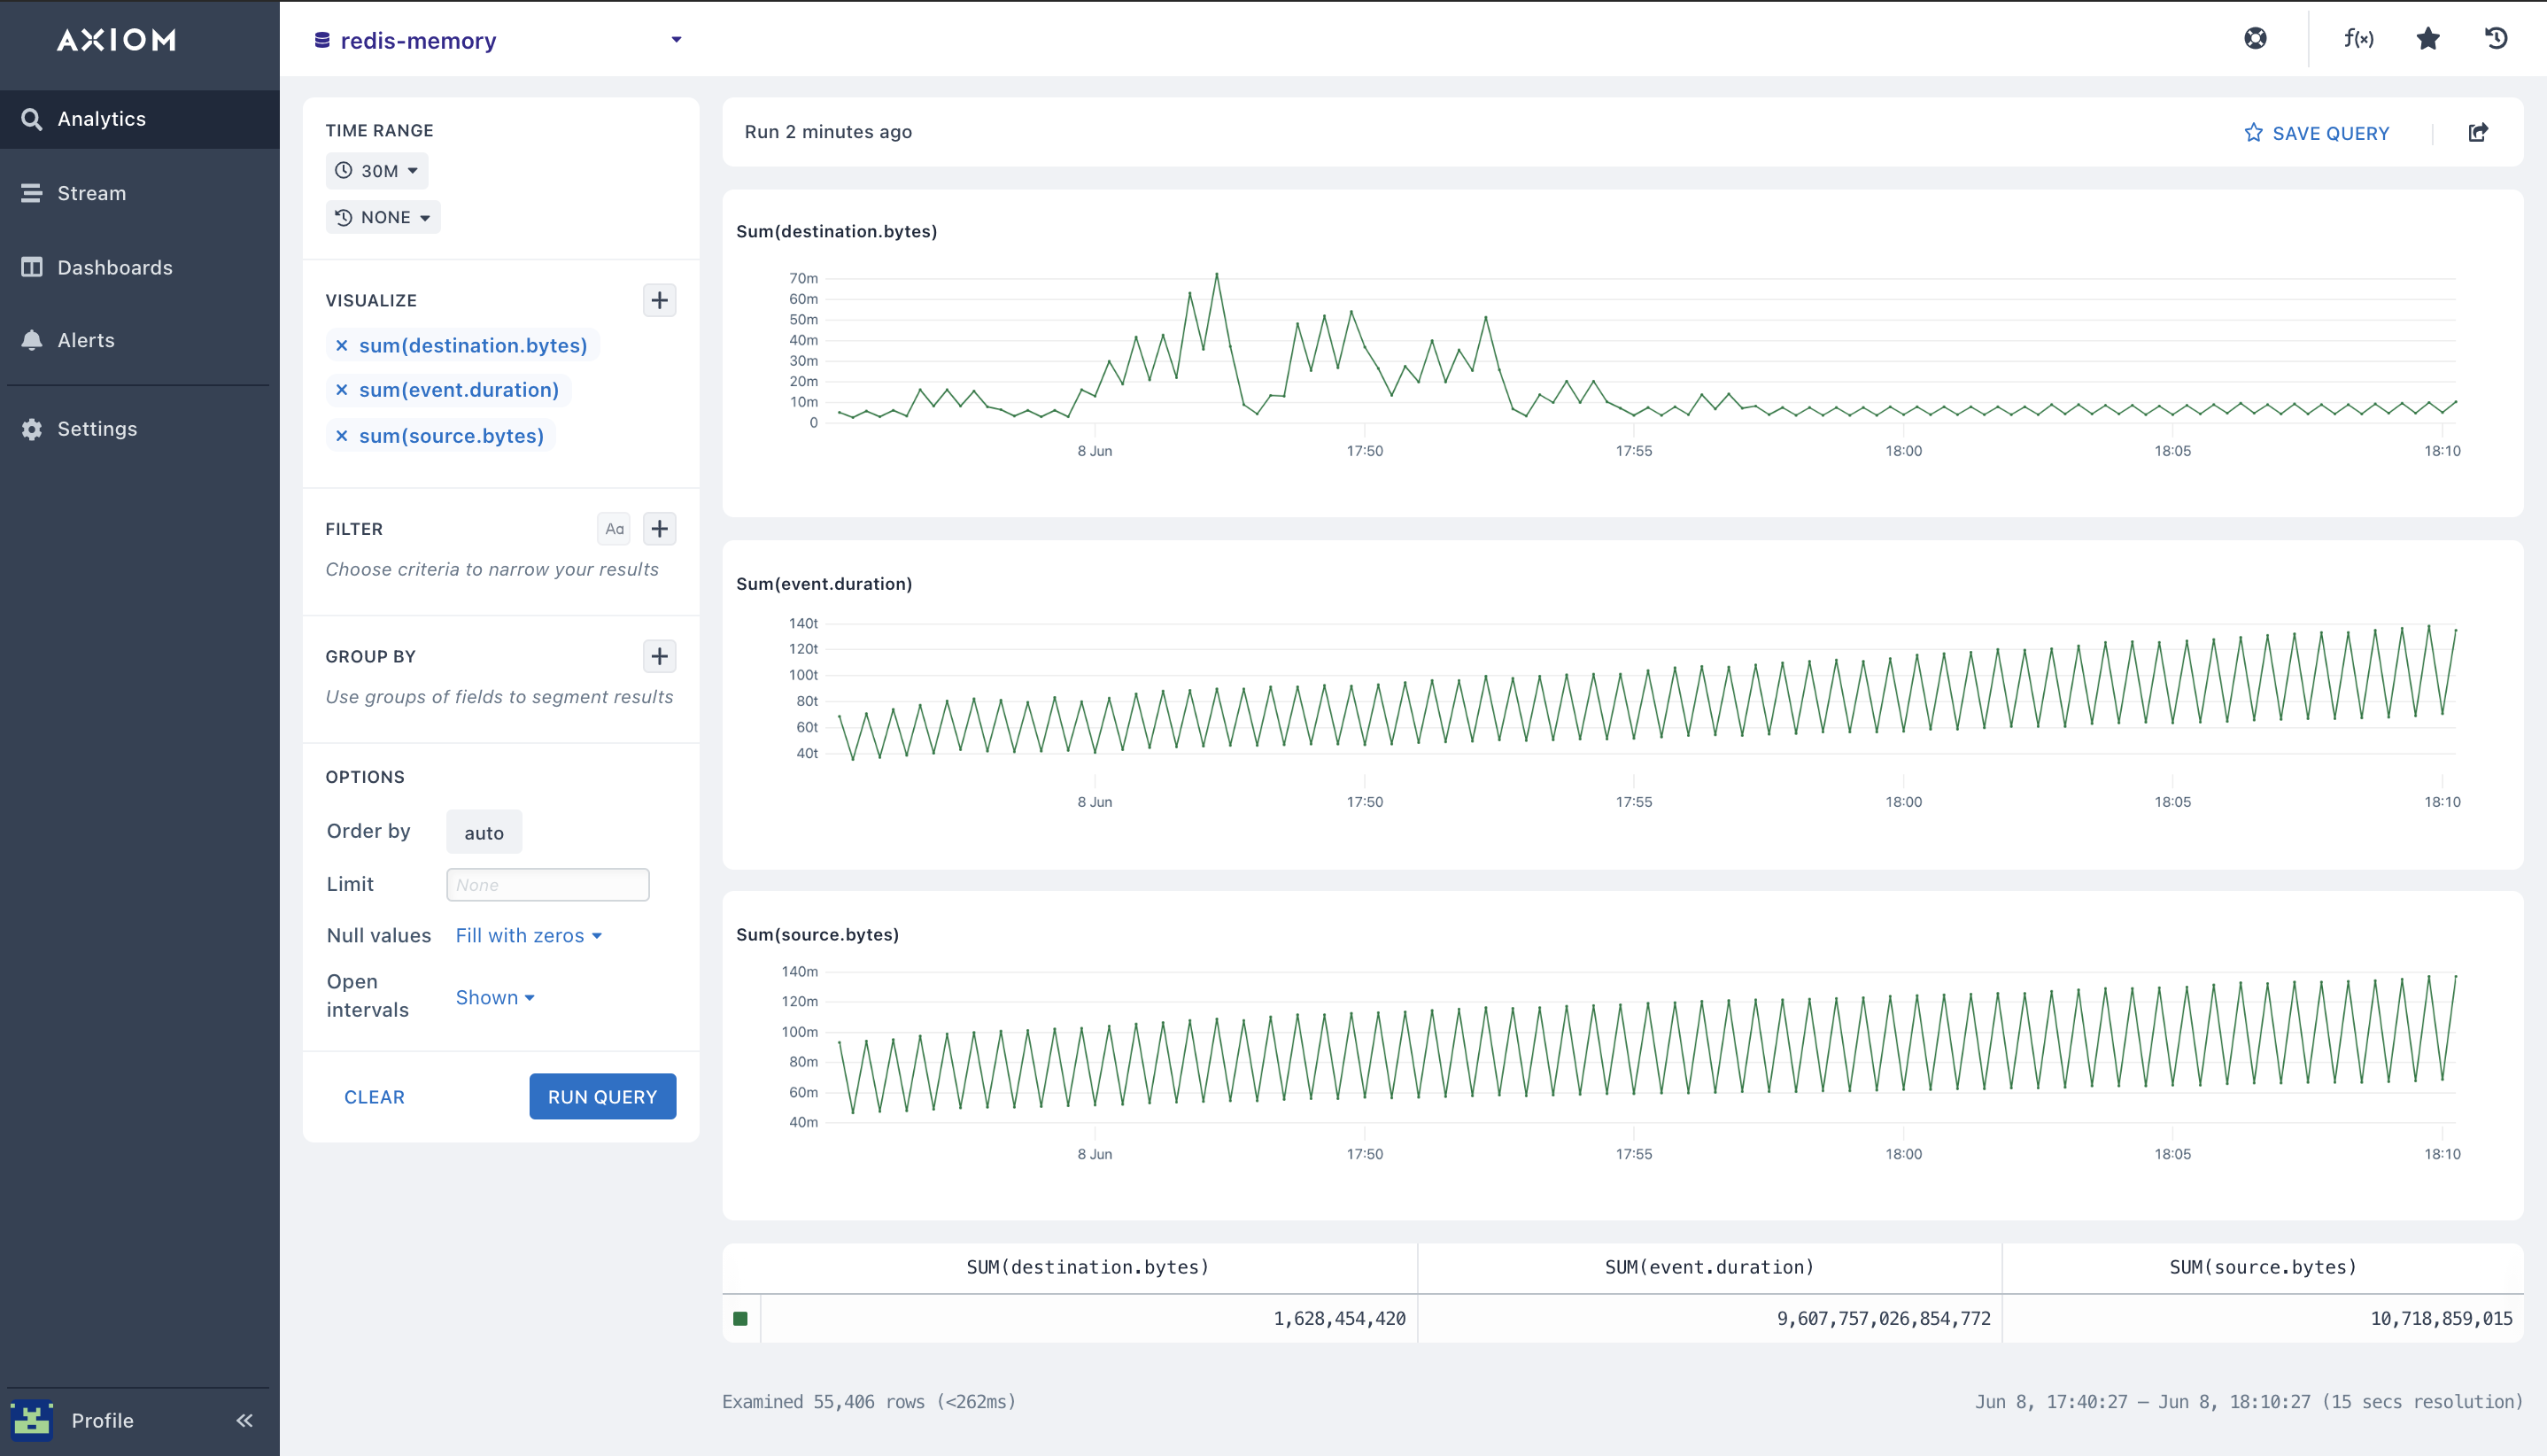
- Sum(): The
sumaggregation calculates the total value for a field across the Redis metrics, and Redis performance query time range. Select the field you want to run the sum aggregation on. With thesumaggregation you can calculate the total Redis metrics, cache hit ratio, connected slaves, Redis max memory, blocked clients, Redis memory usage, throughput data, and CPU Redis memory.
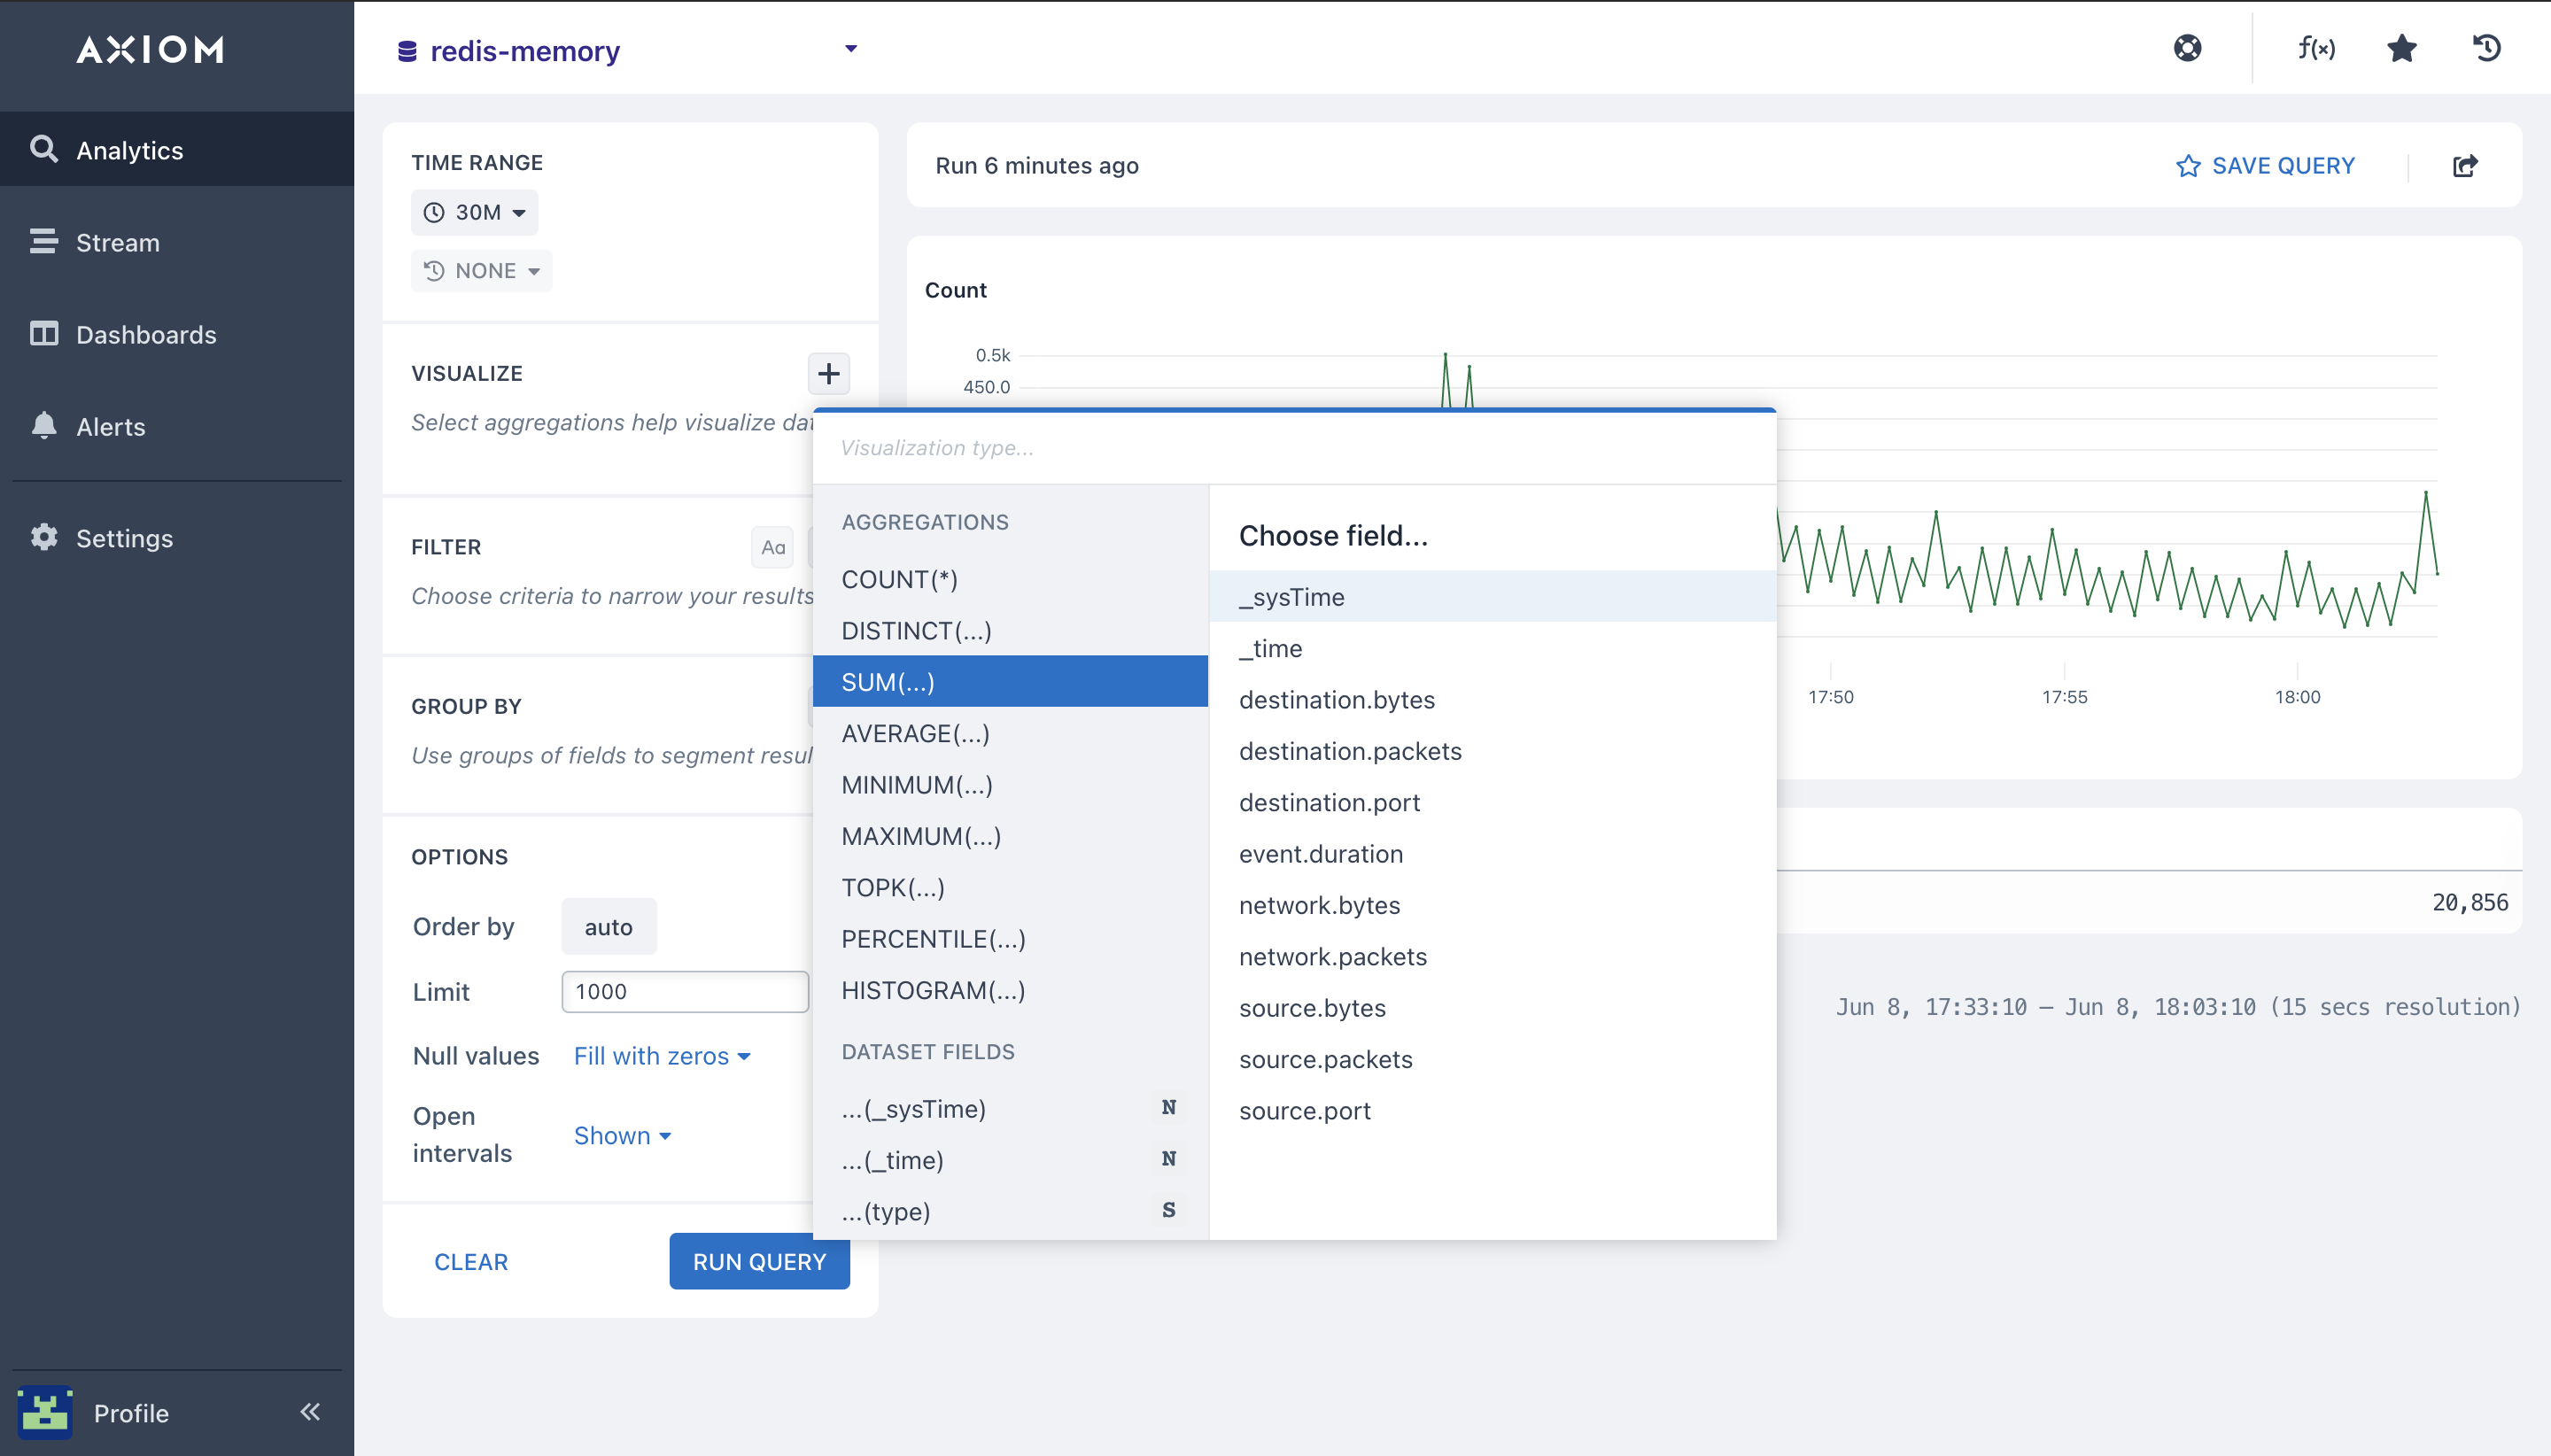
A chart is rendered that shows the sum in each bucket of time, and the overall total Redis metrics available in the table beneath the chart.
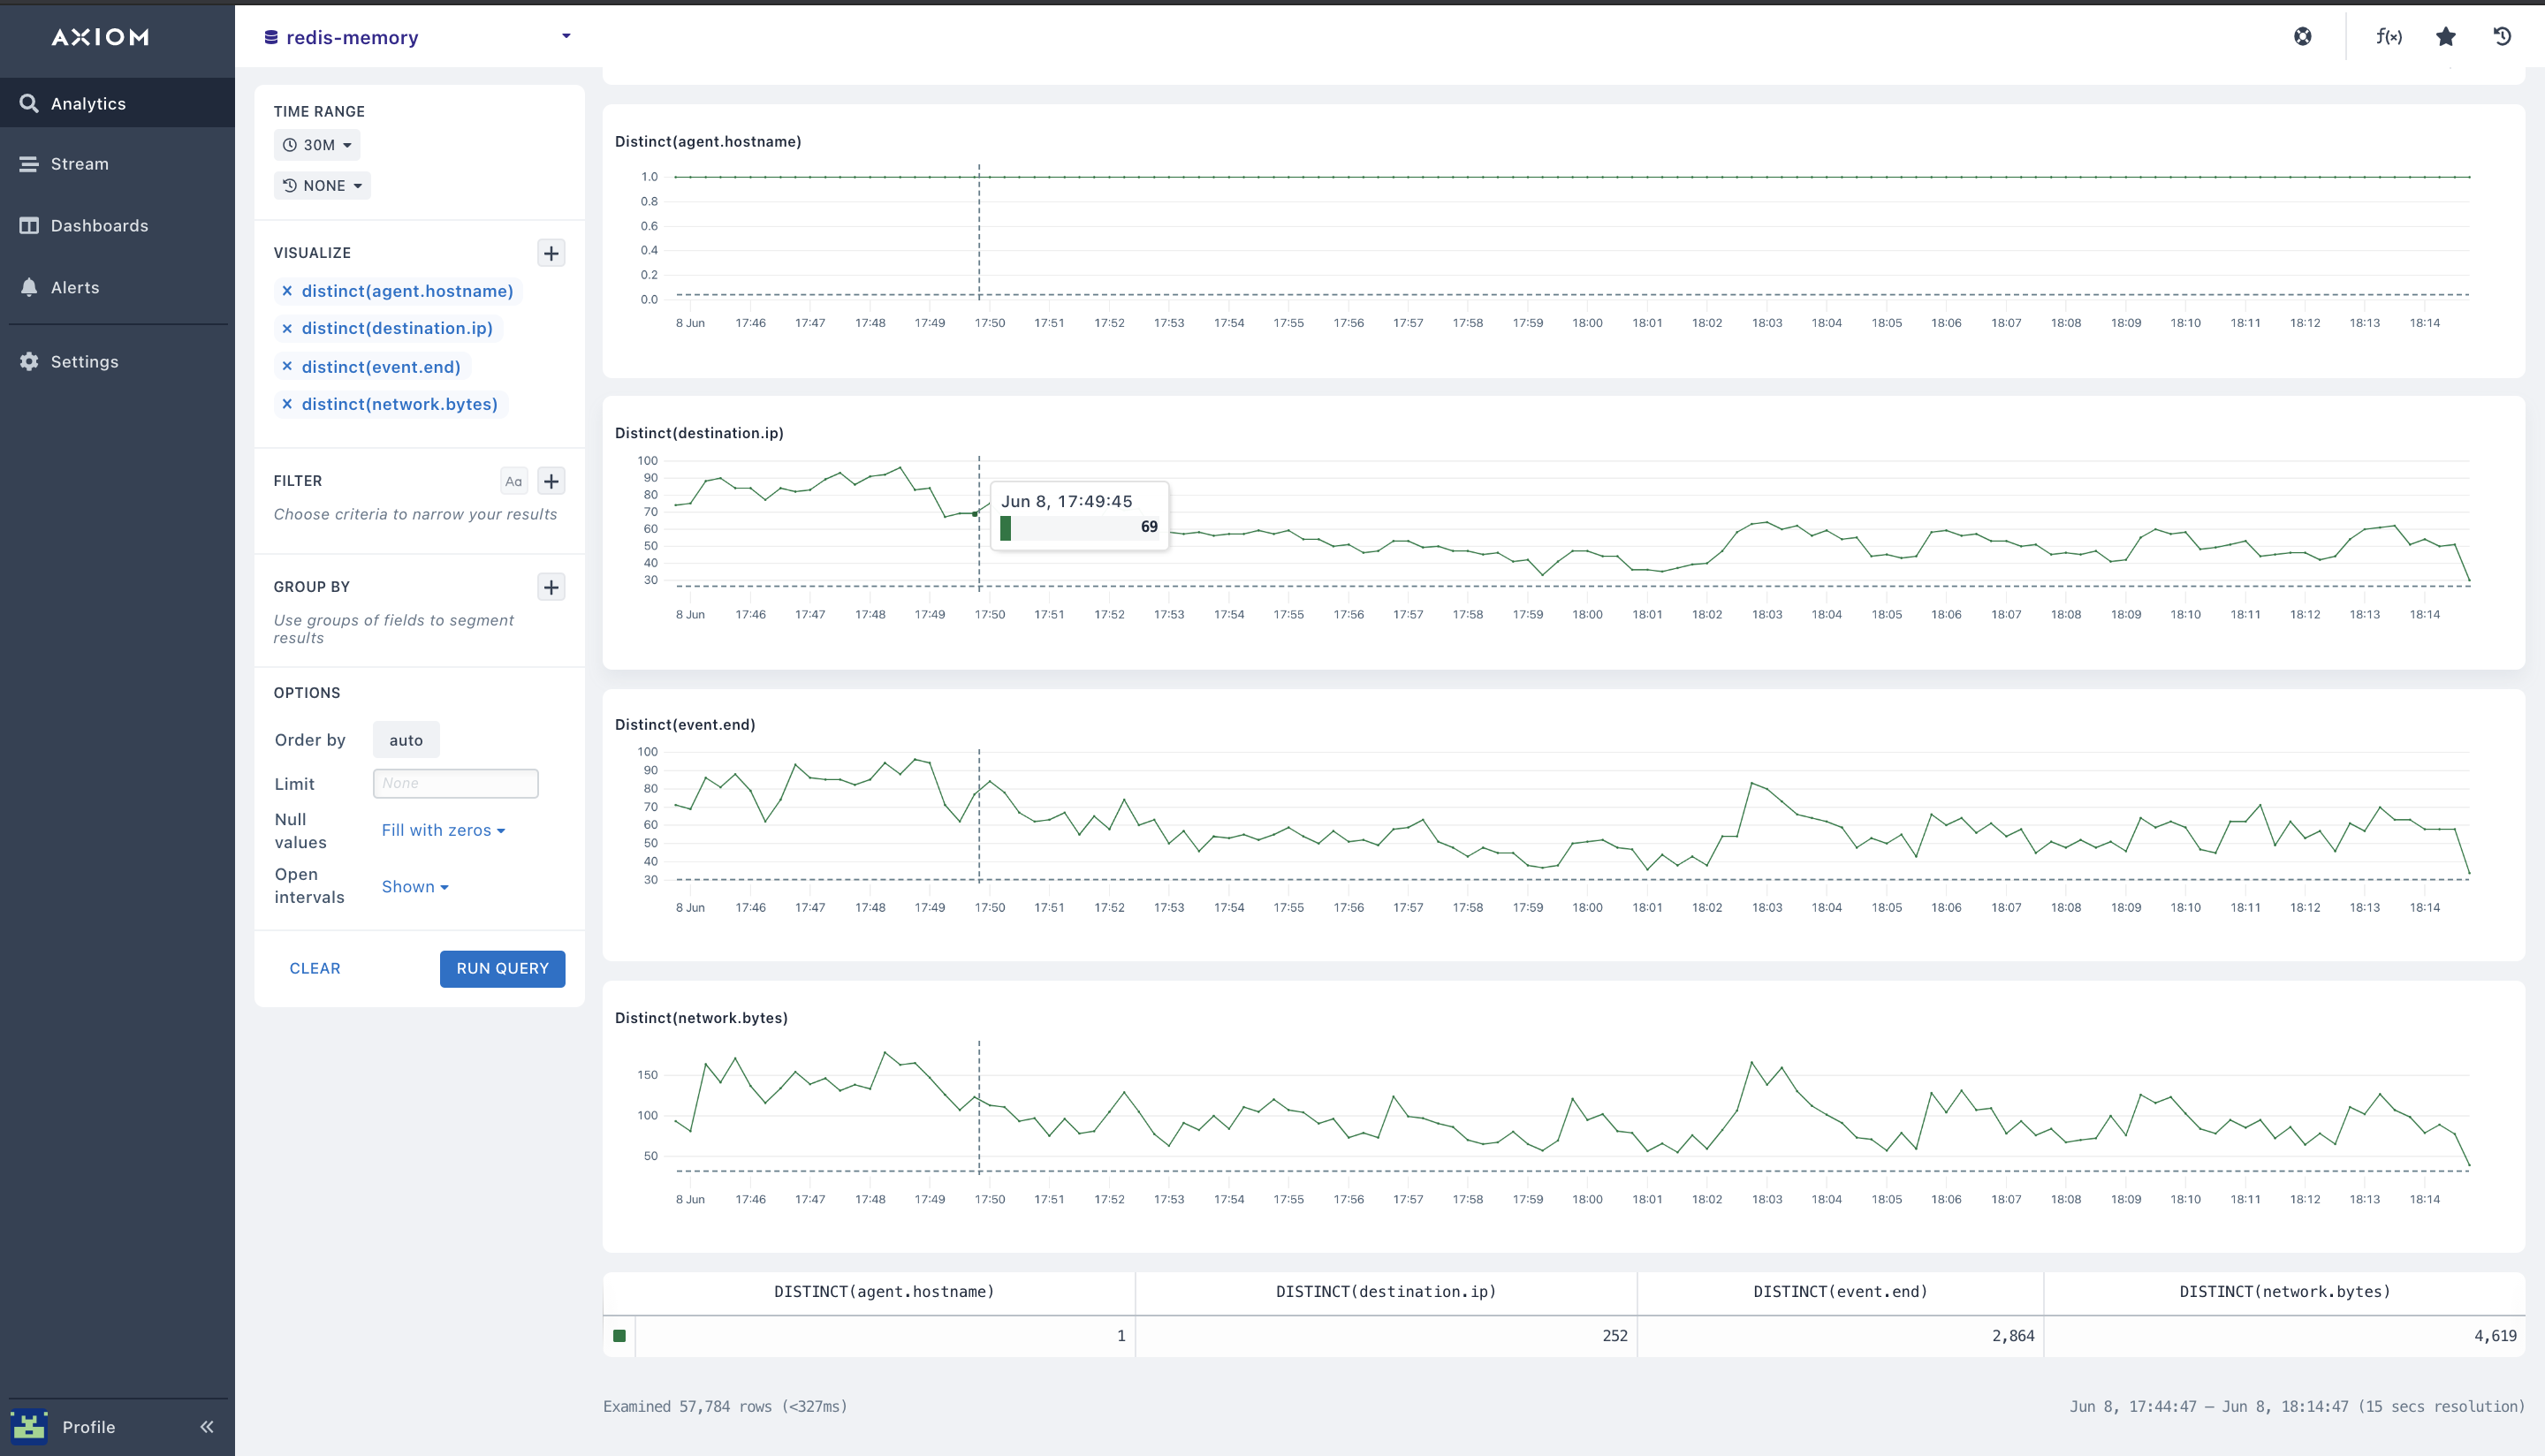
- distinct(): The Distinct aggregation calculates the number of unique values for a field in each time duration in your Redis metrics instance. You can specify the
distinct($fieldName)function to get the chart for the values in the Redis and Redis performance key metrics fields you selected. The table beneath the chart shows the total number of distinct values for the entire Redis metrics, Redis monitoring, and Redis performance time period that took place while tracking the unique Redis performance and monitoring of your entire Redis database
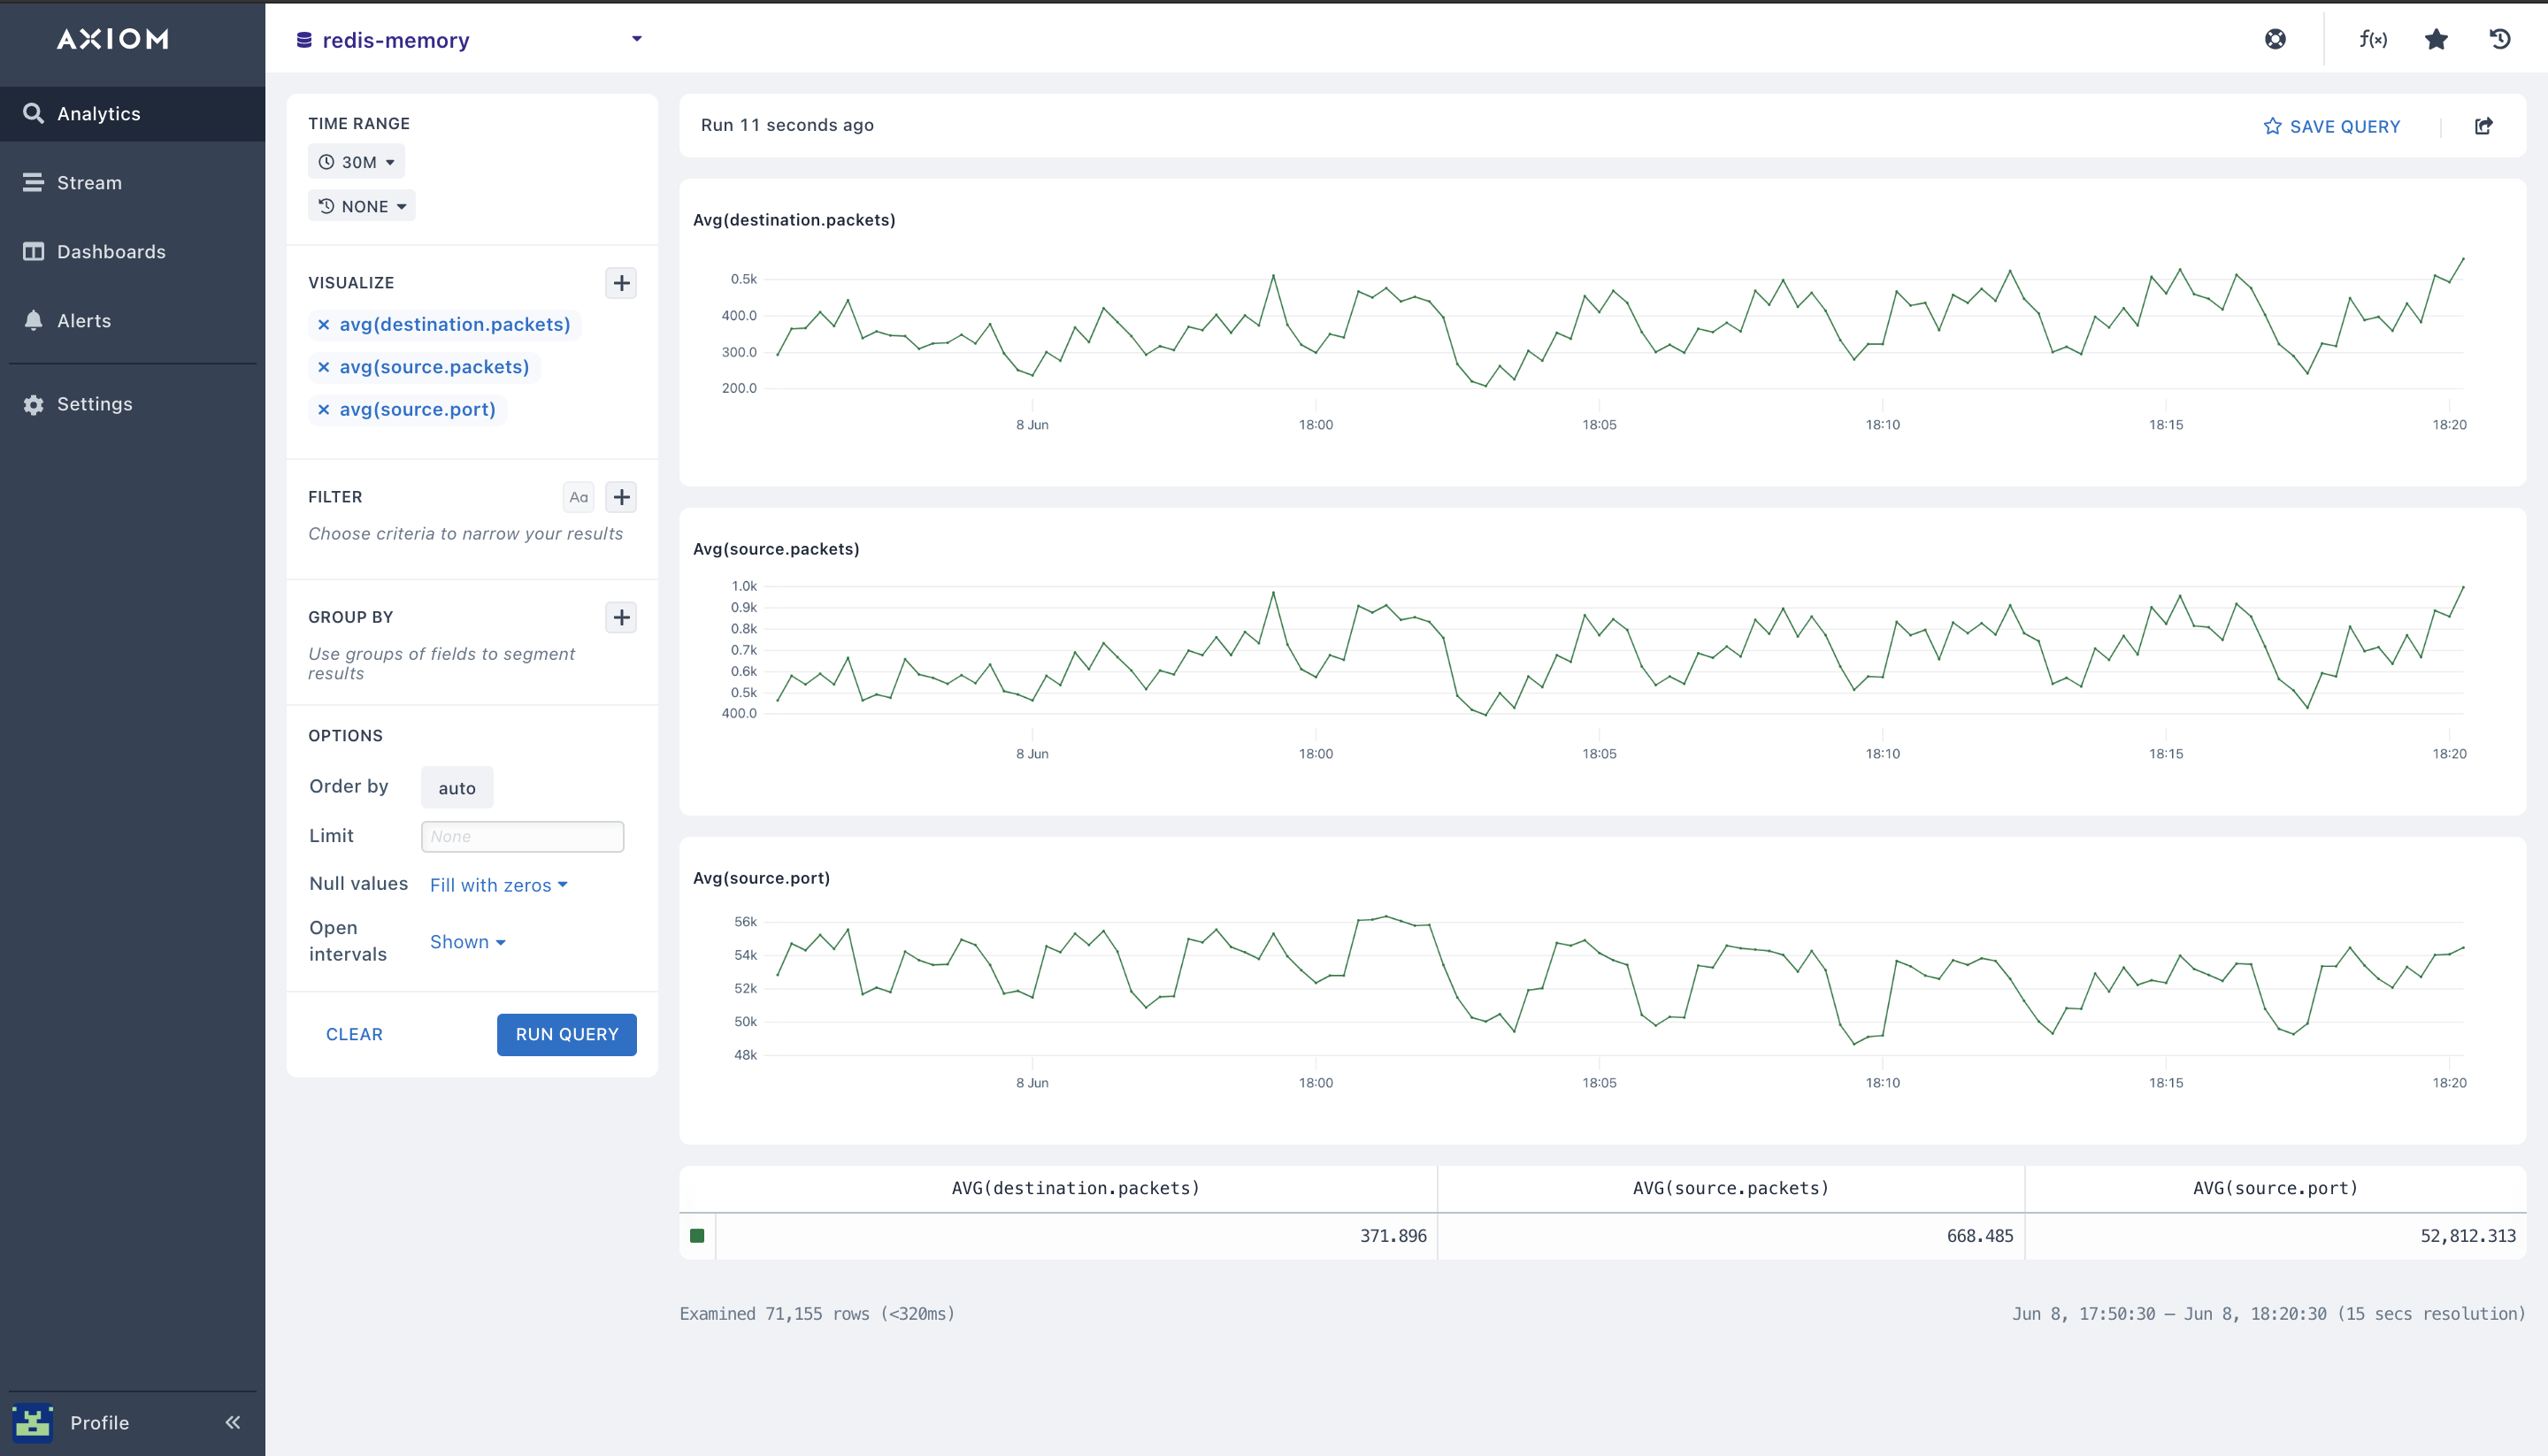
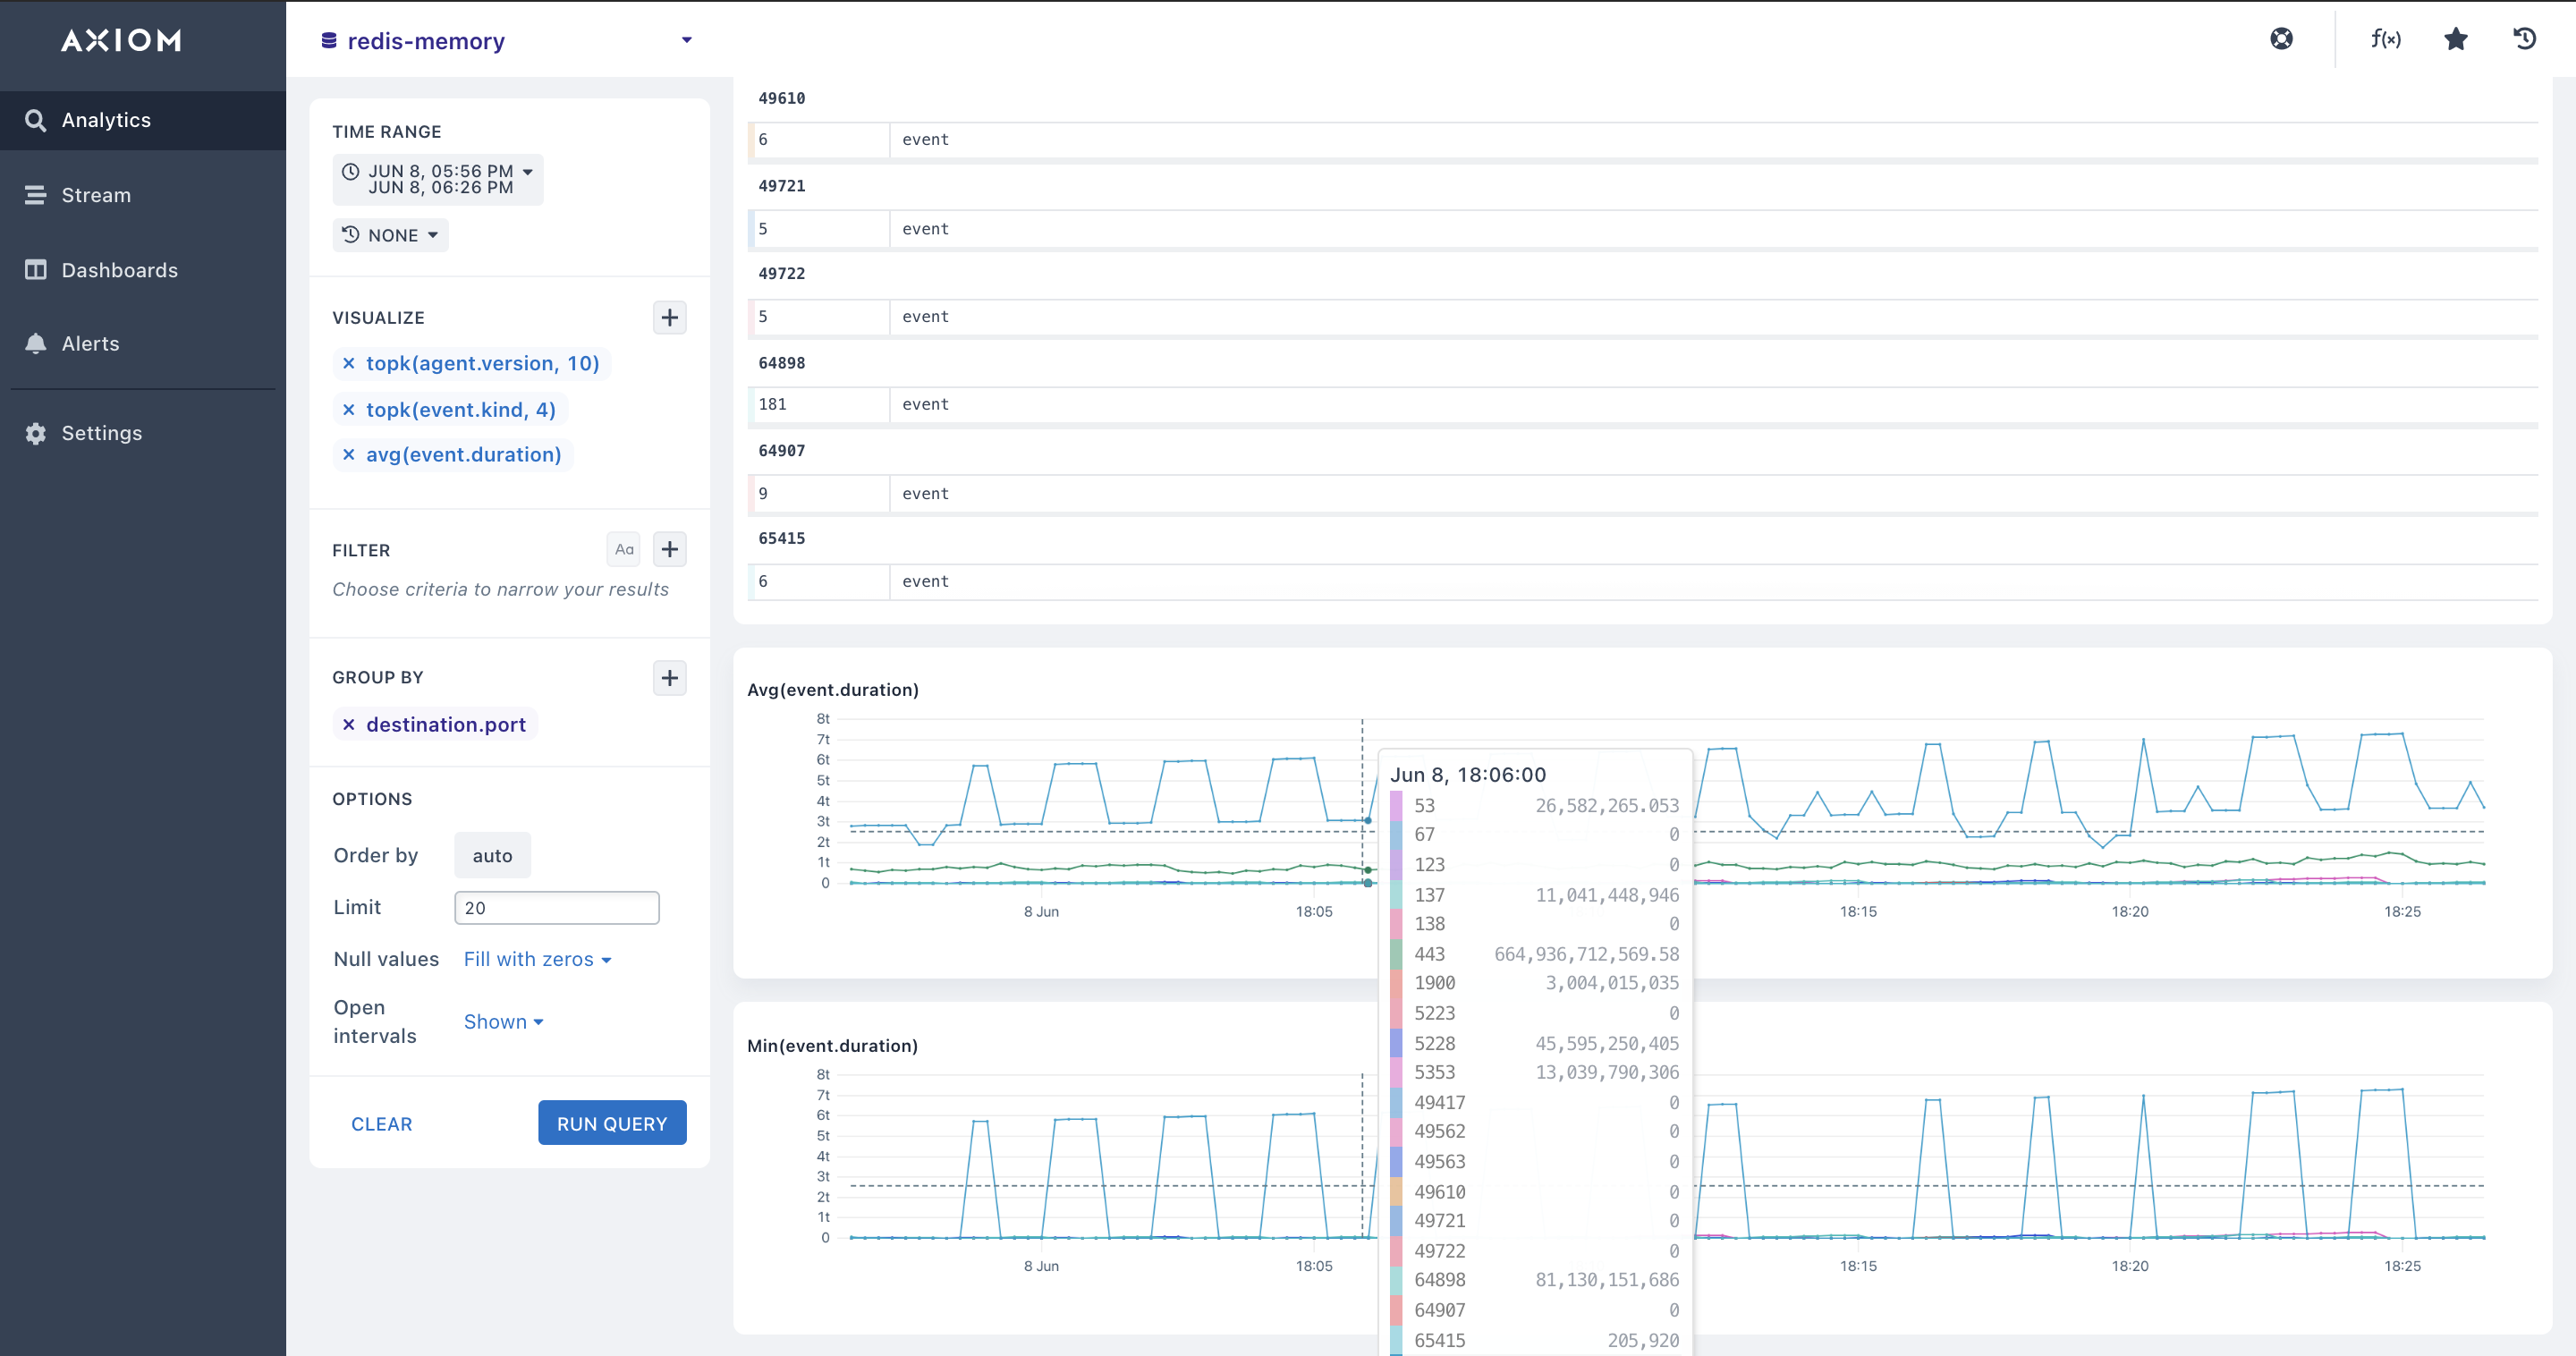
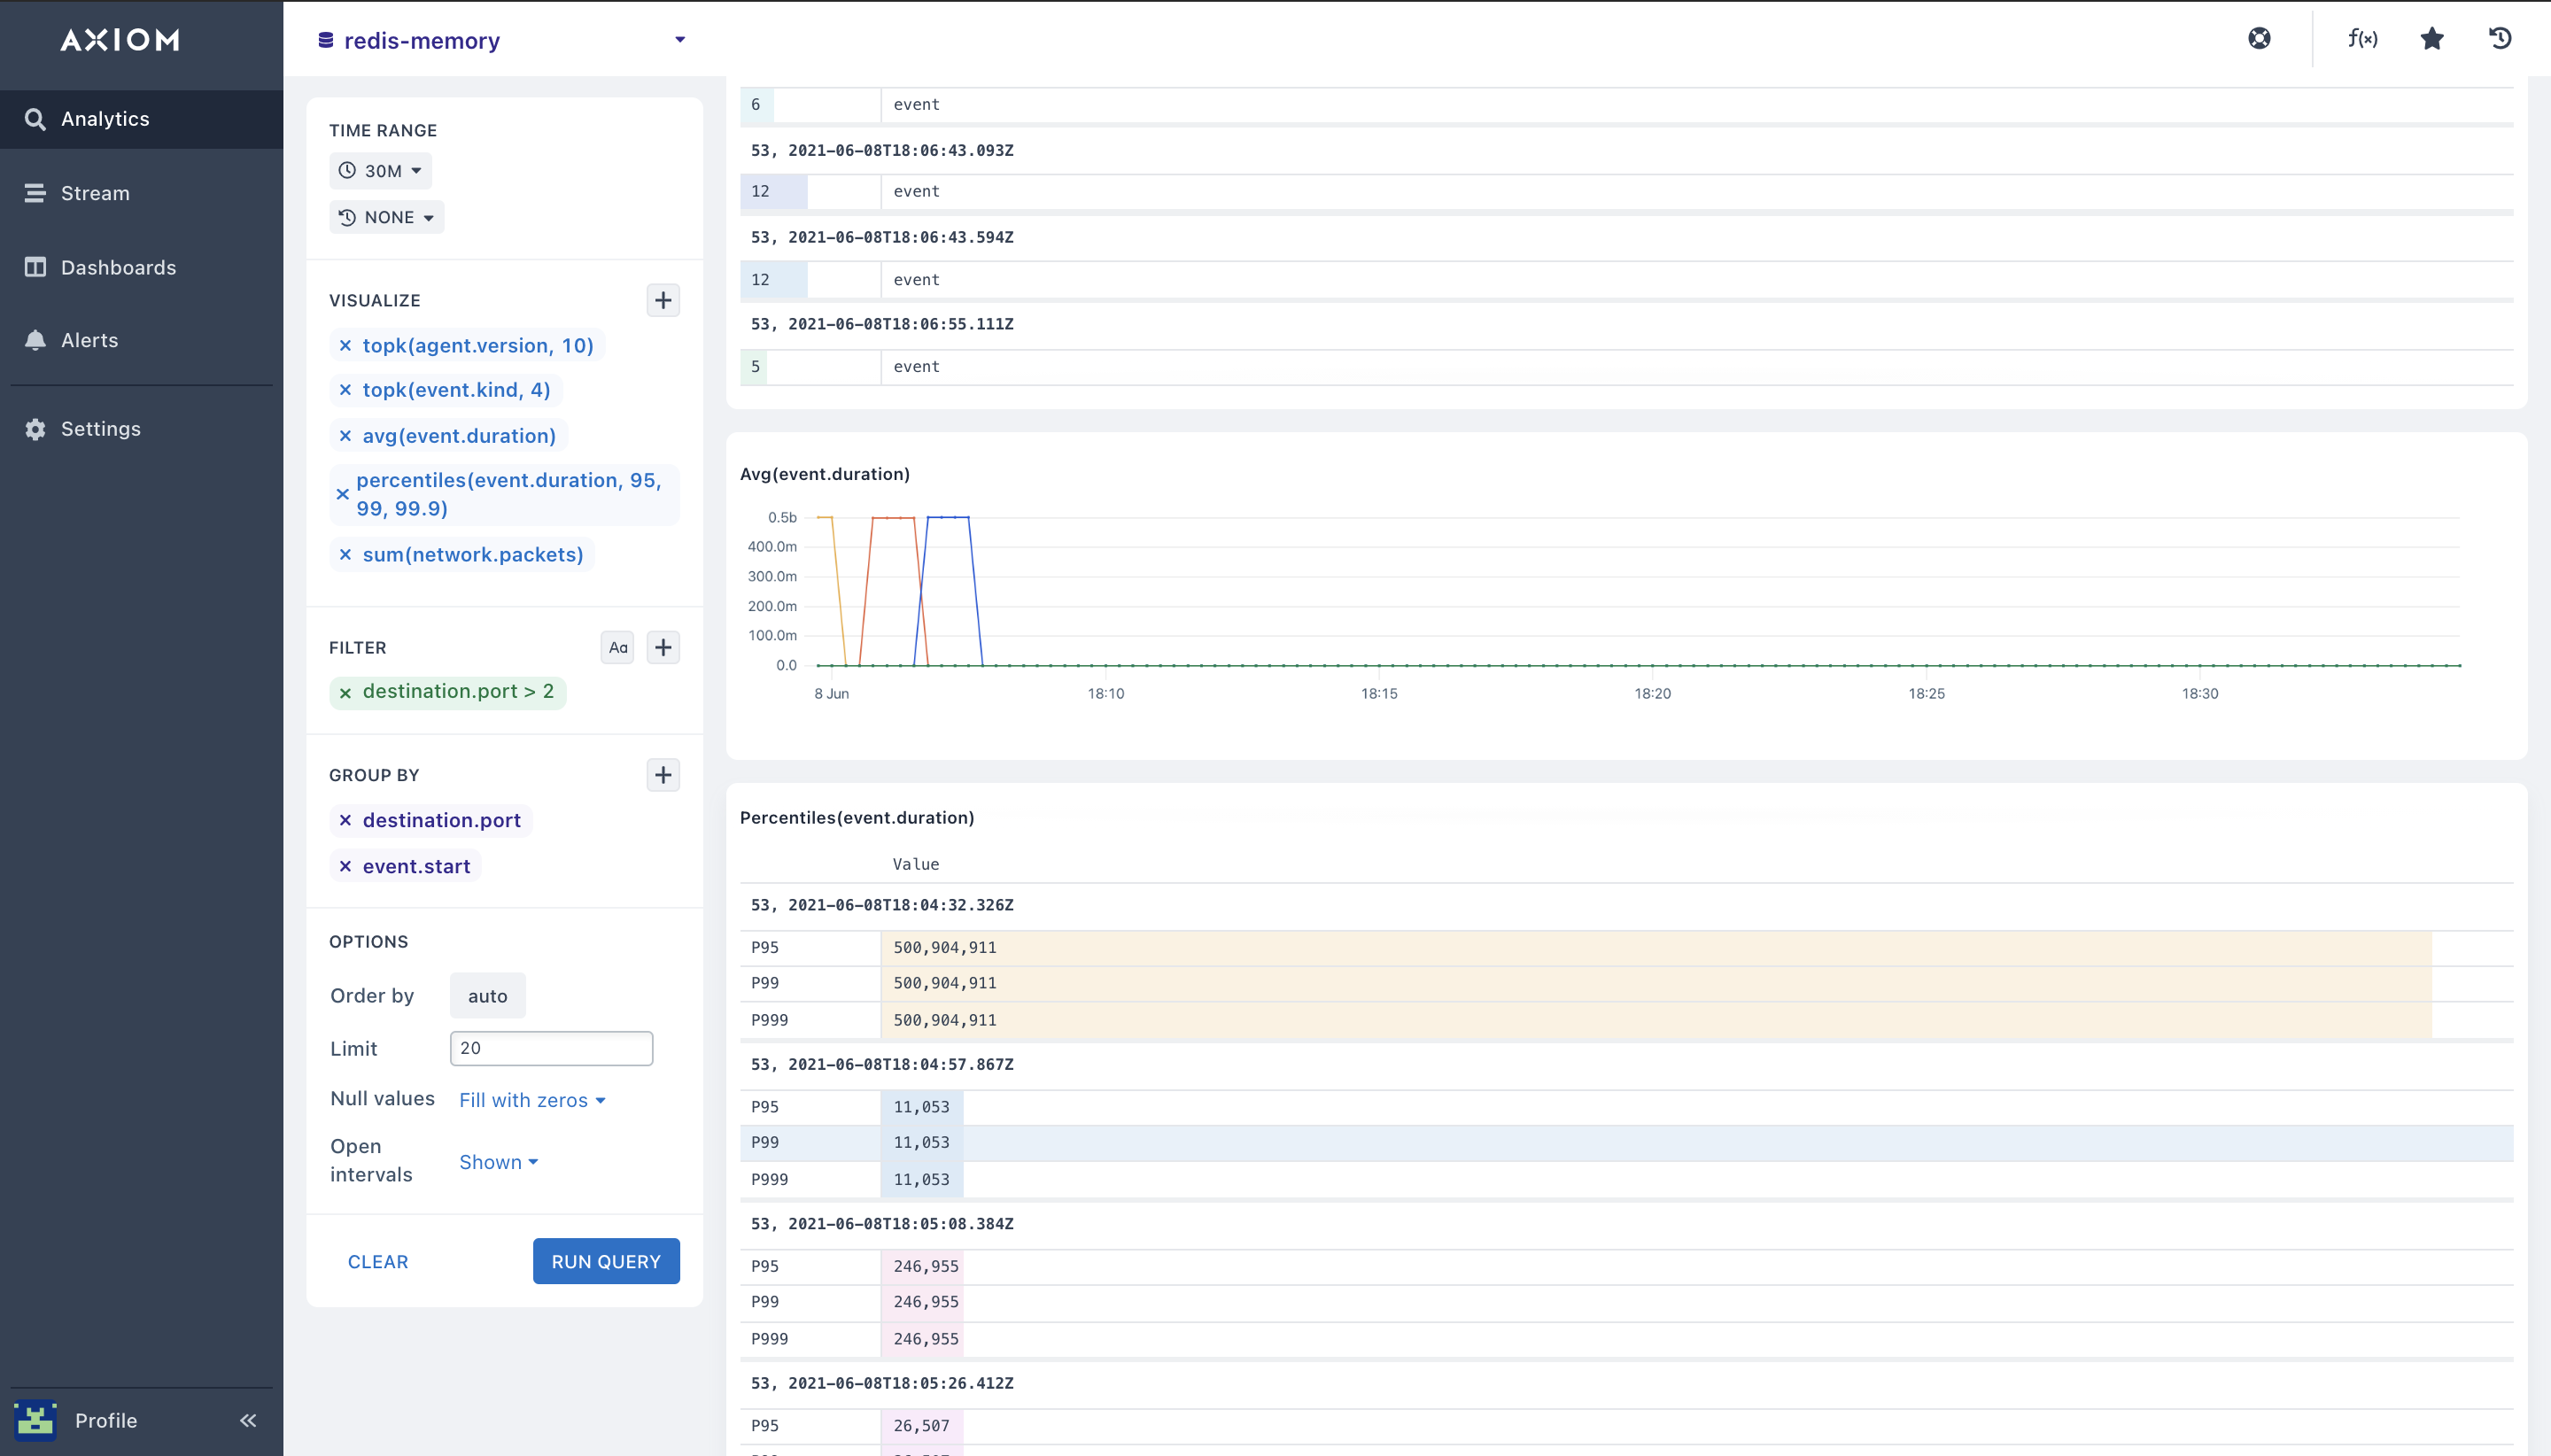
- average (): You can calculate the mean value for a numeric field in each time duration on your Redis database. With the
average()response time aggregation, you can get the mean value of your Redis events and Redis memory usage. Below is the overall average across the entire Redis time period of the query selected.
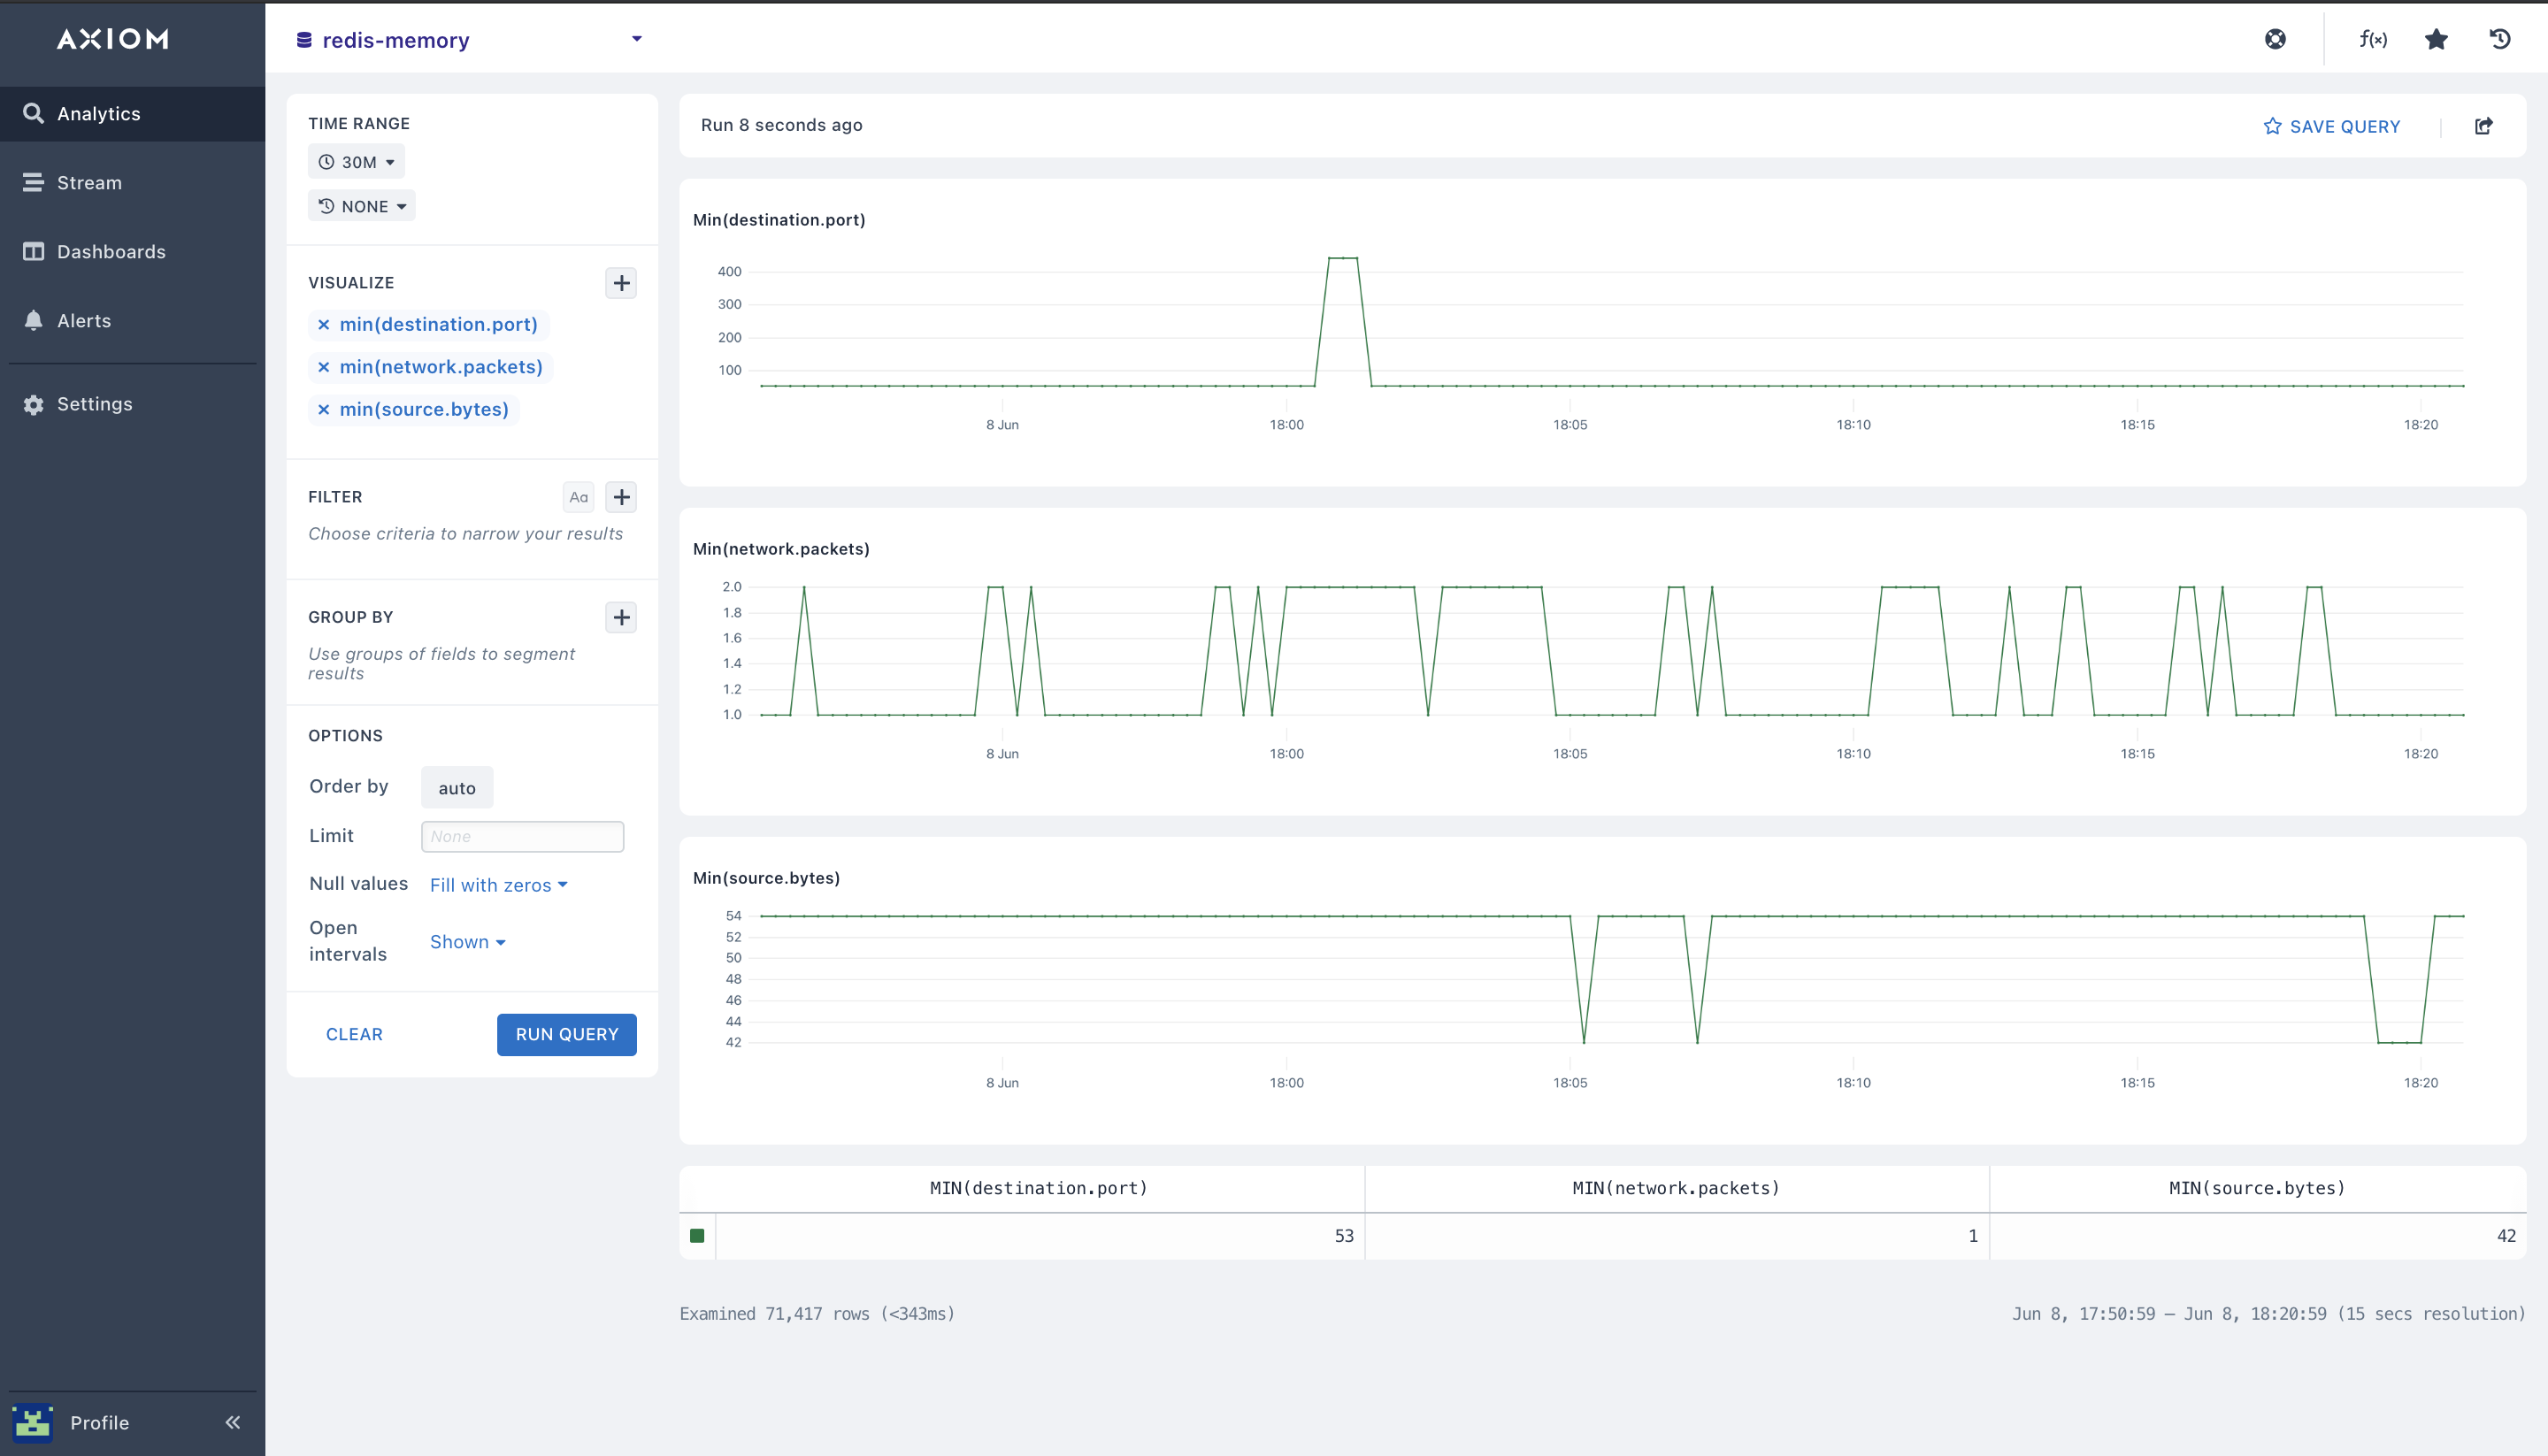
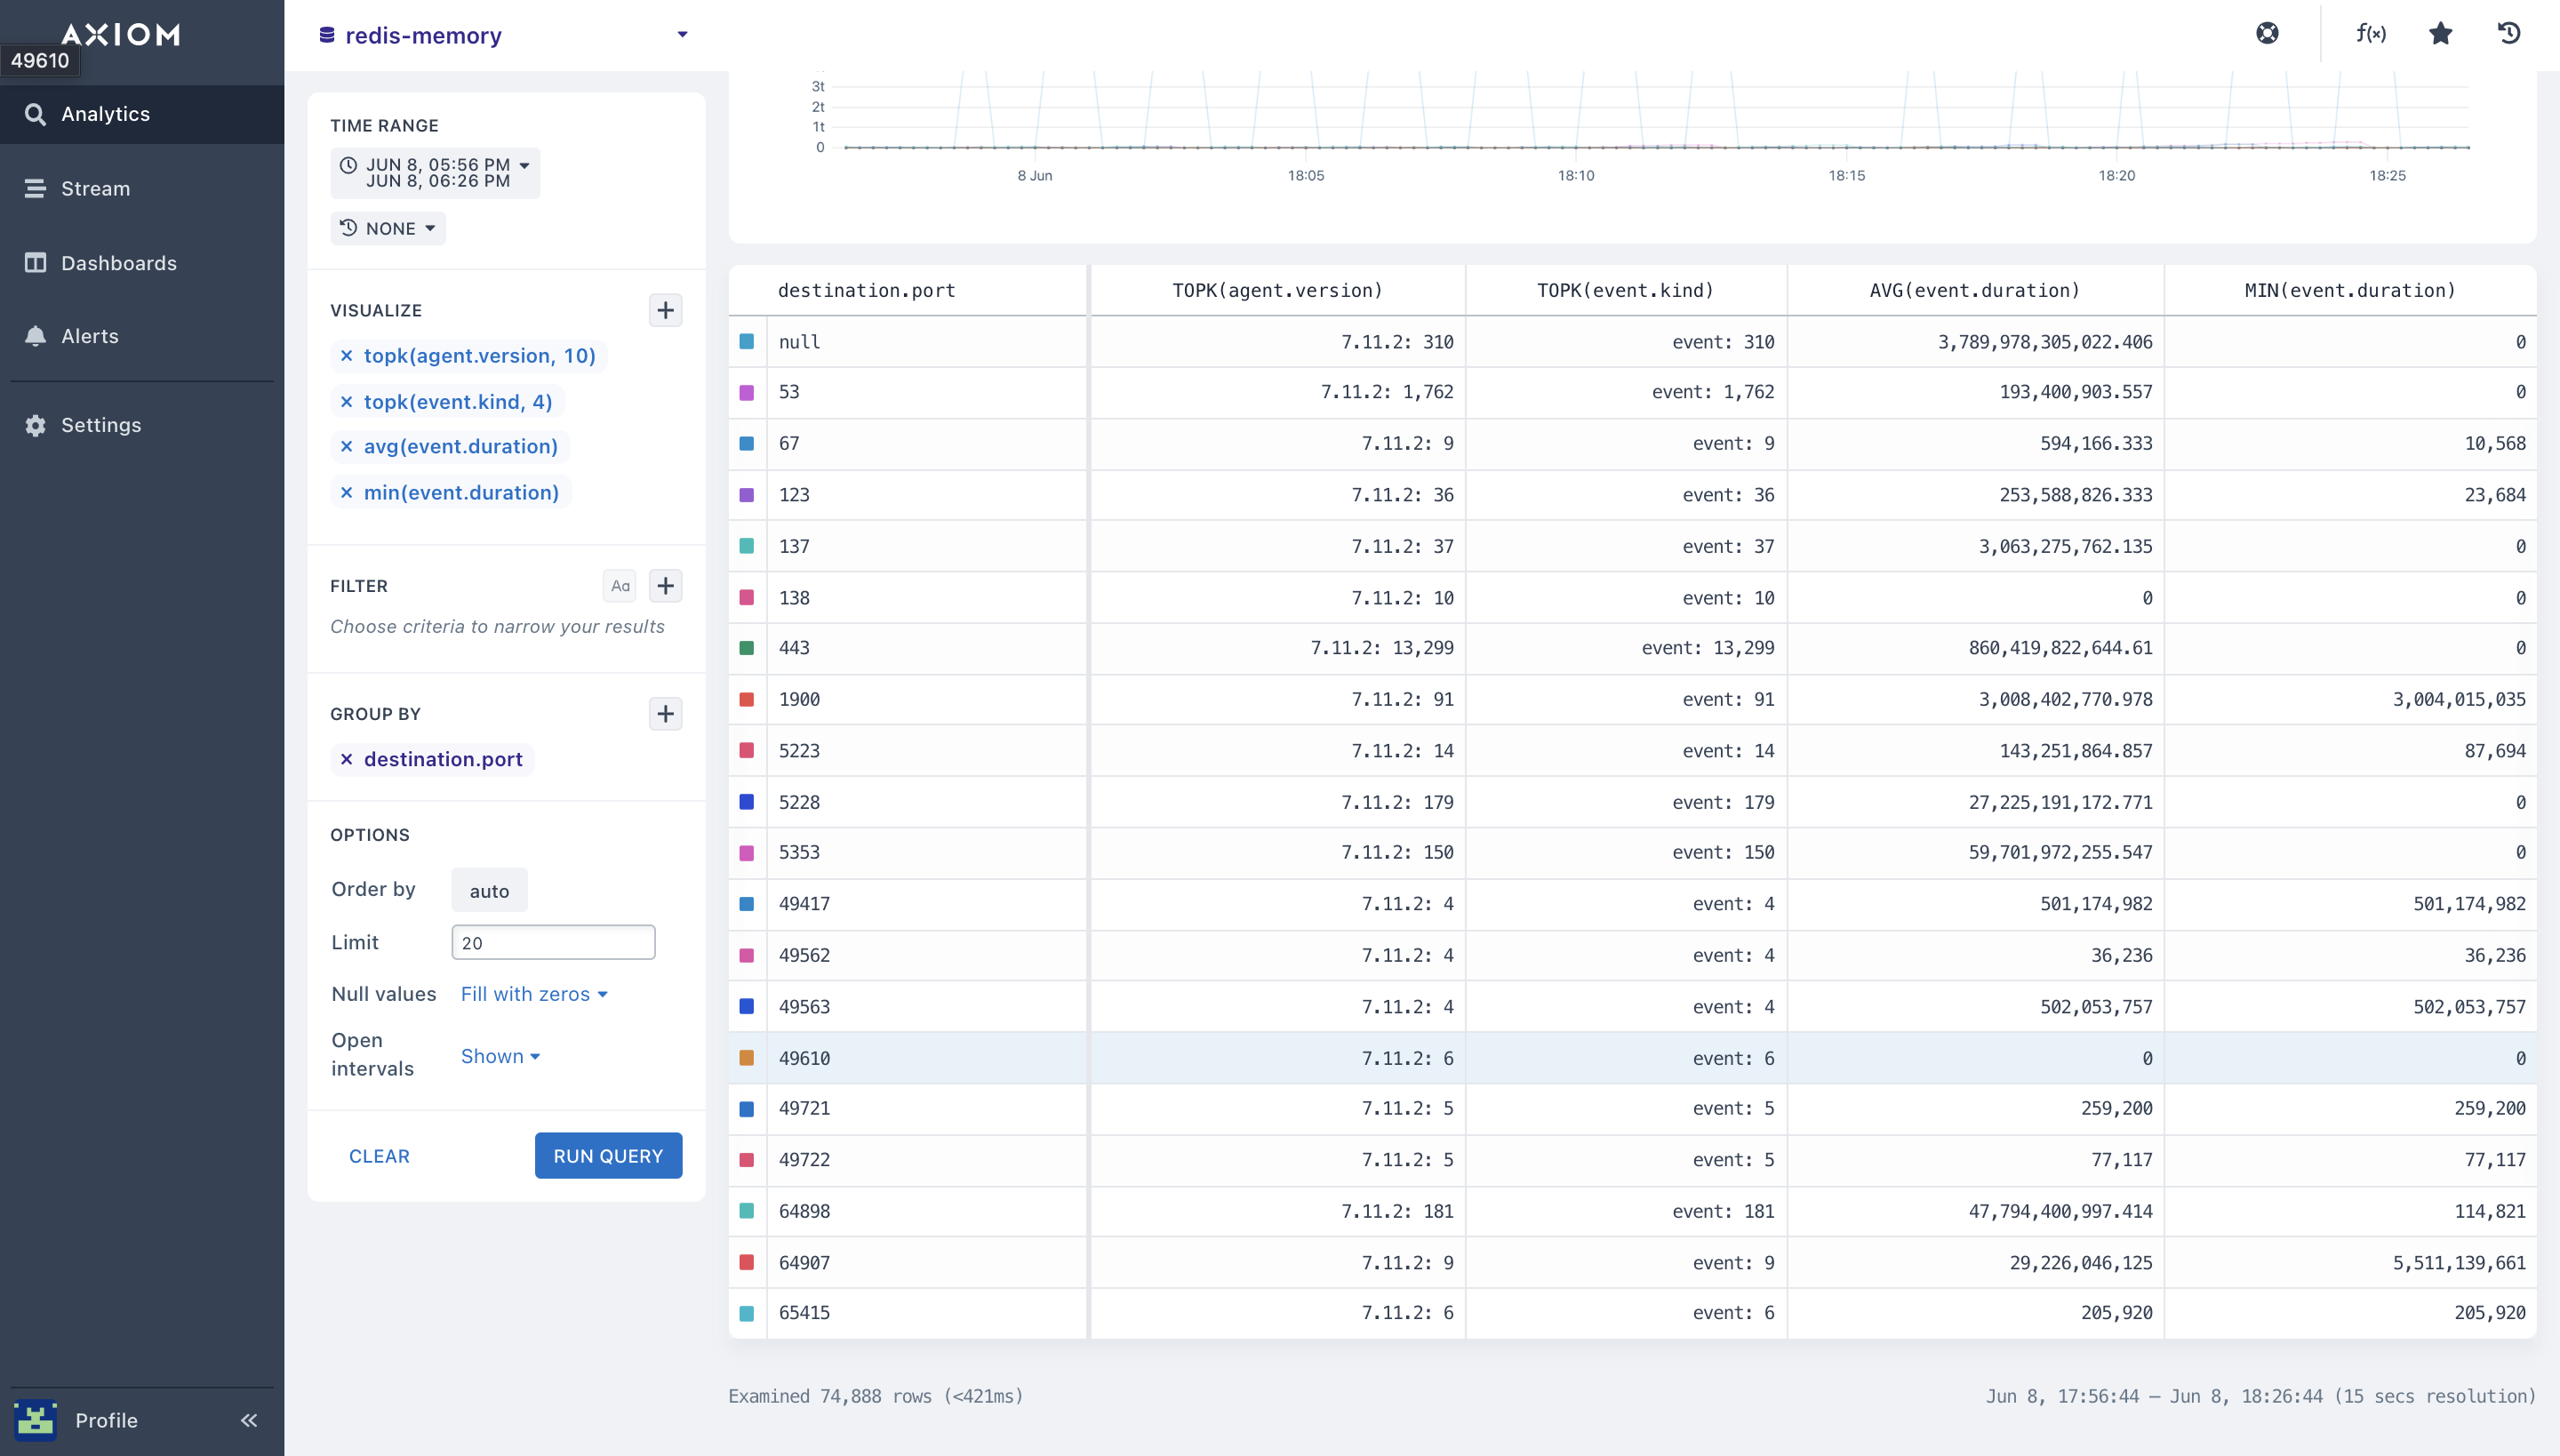
- minimum (): The
min()aggregation lets you get the minimum value for a numeric field from your Redis dataset using this aggregation. When you have selected your field, it outputs a chart that contains the minimum value for each time duration in the table below the chart. With the minimum visualization you can get the minimum number of memory usage from your Redis data structure, track the minimum Redis throughput data, and know when there’s a low response time in your Redis allocator.
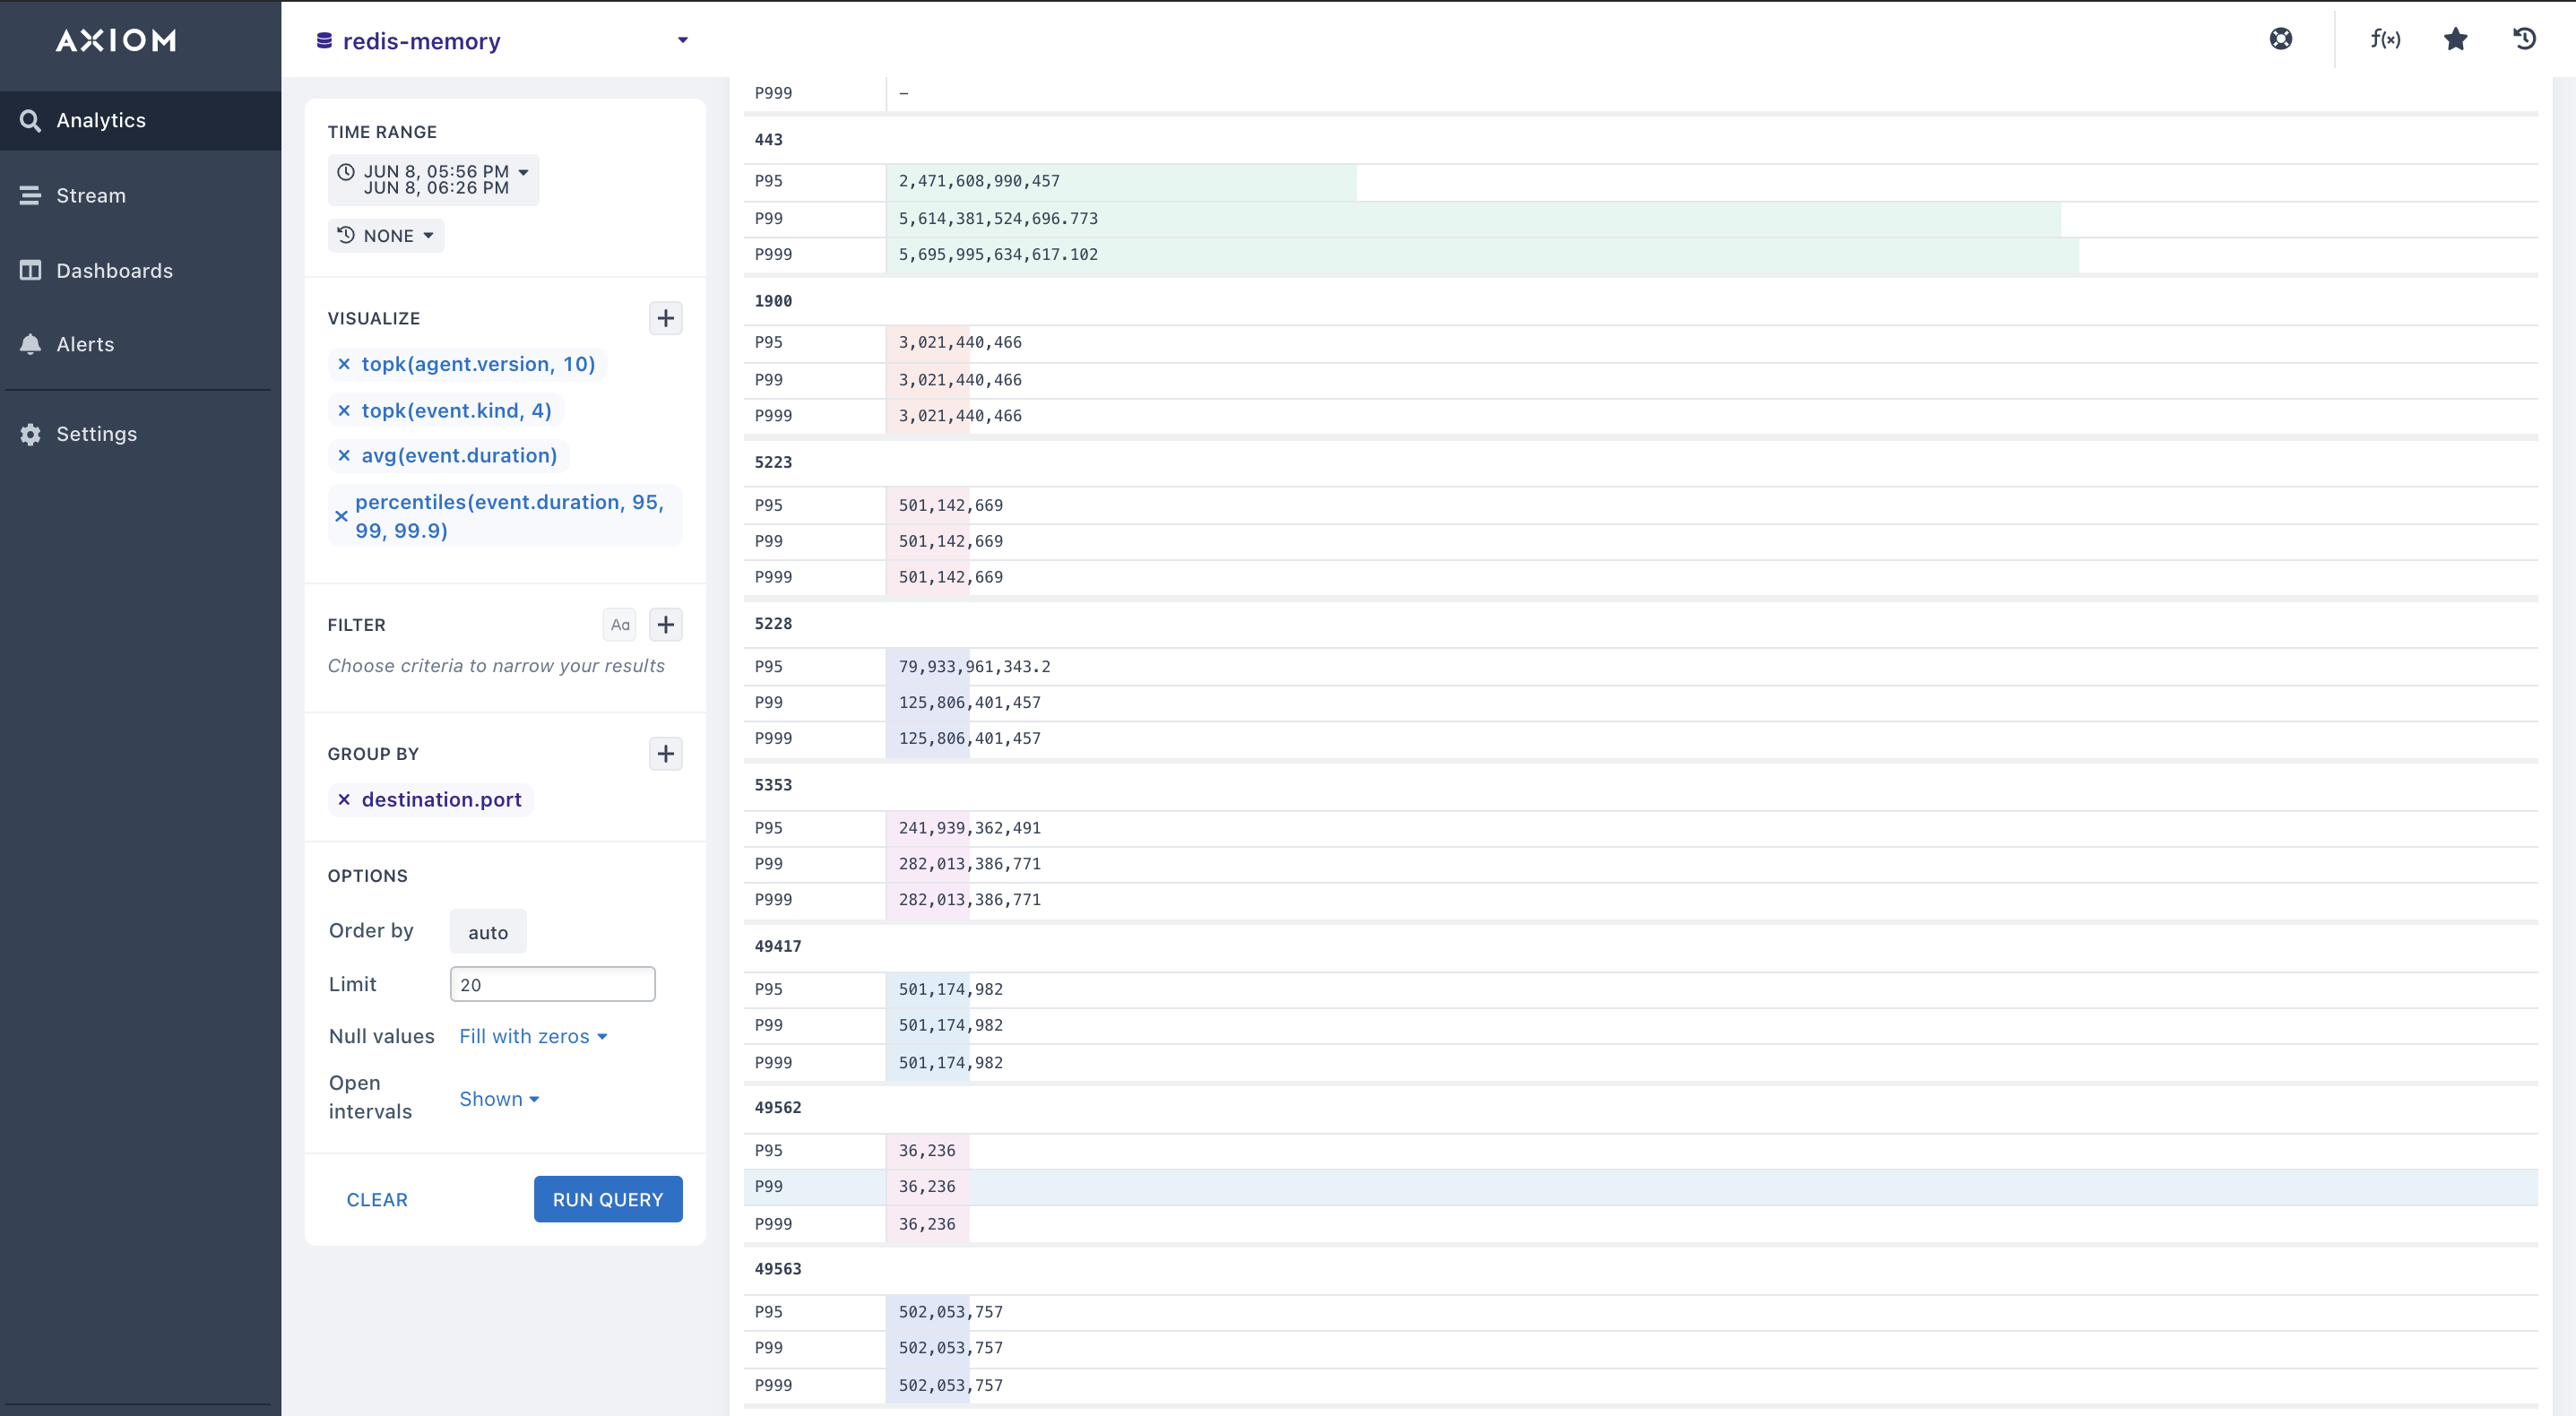
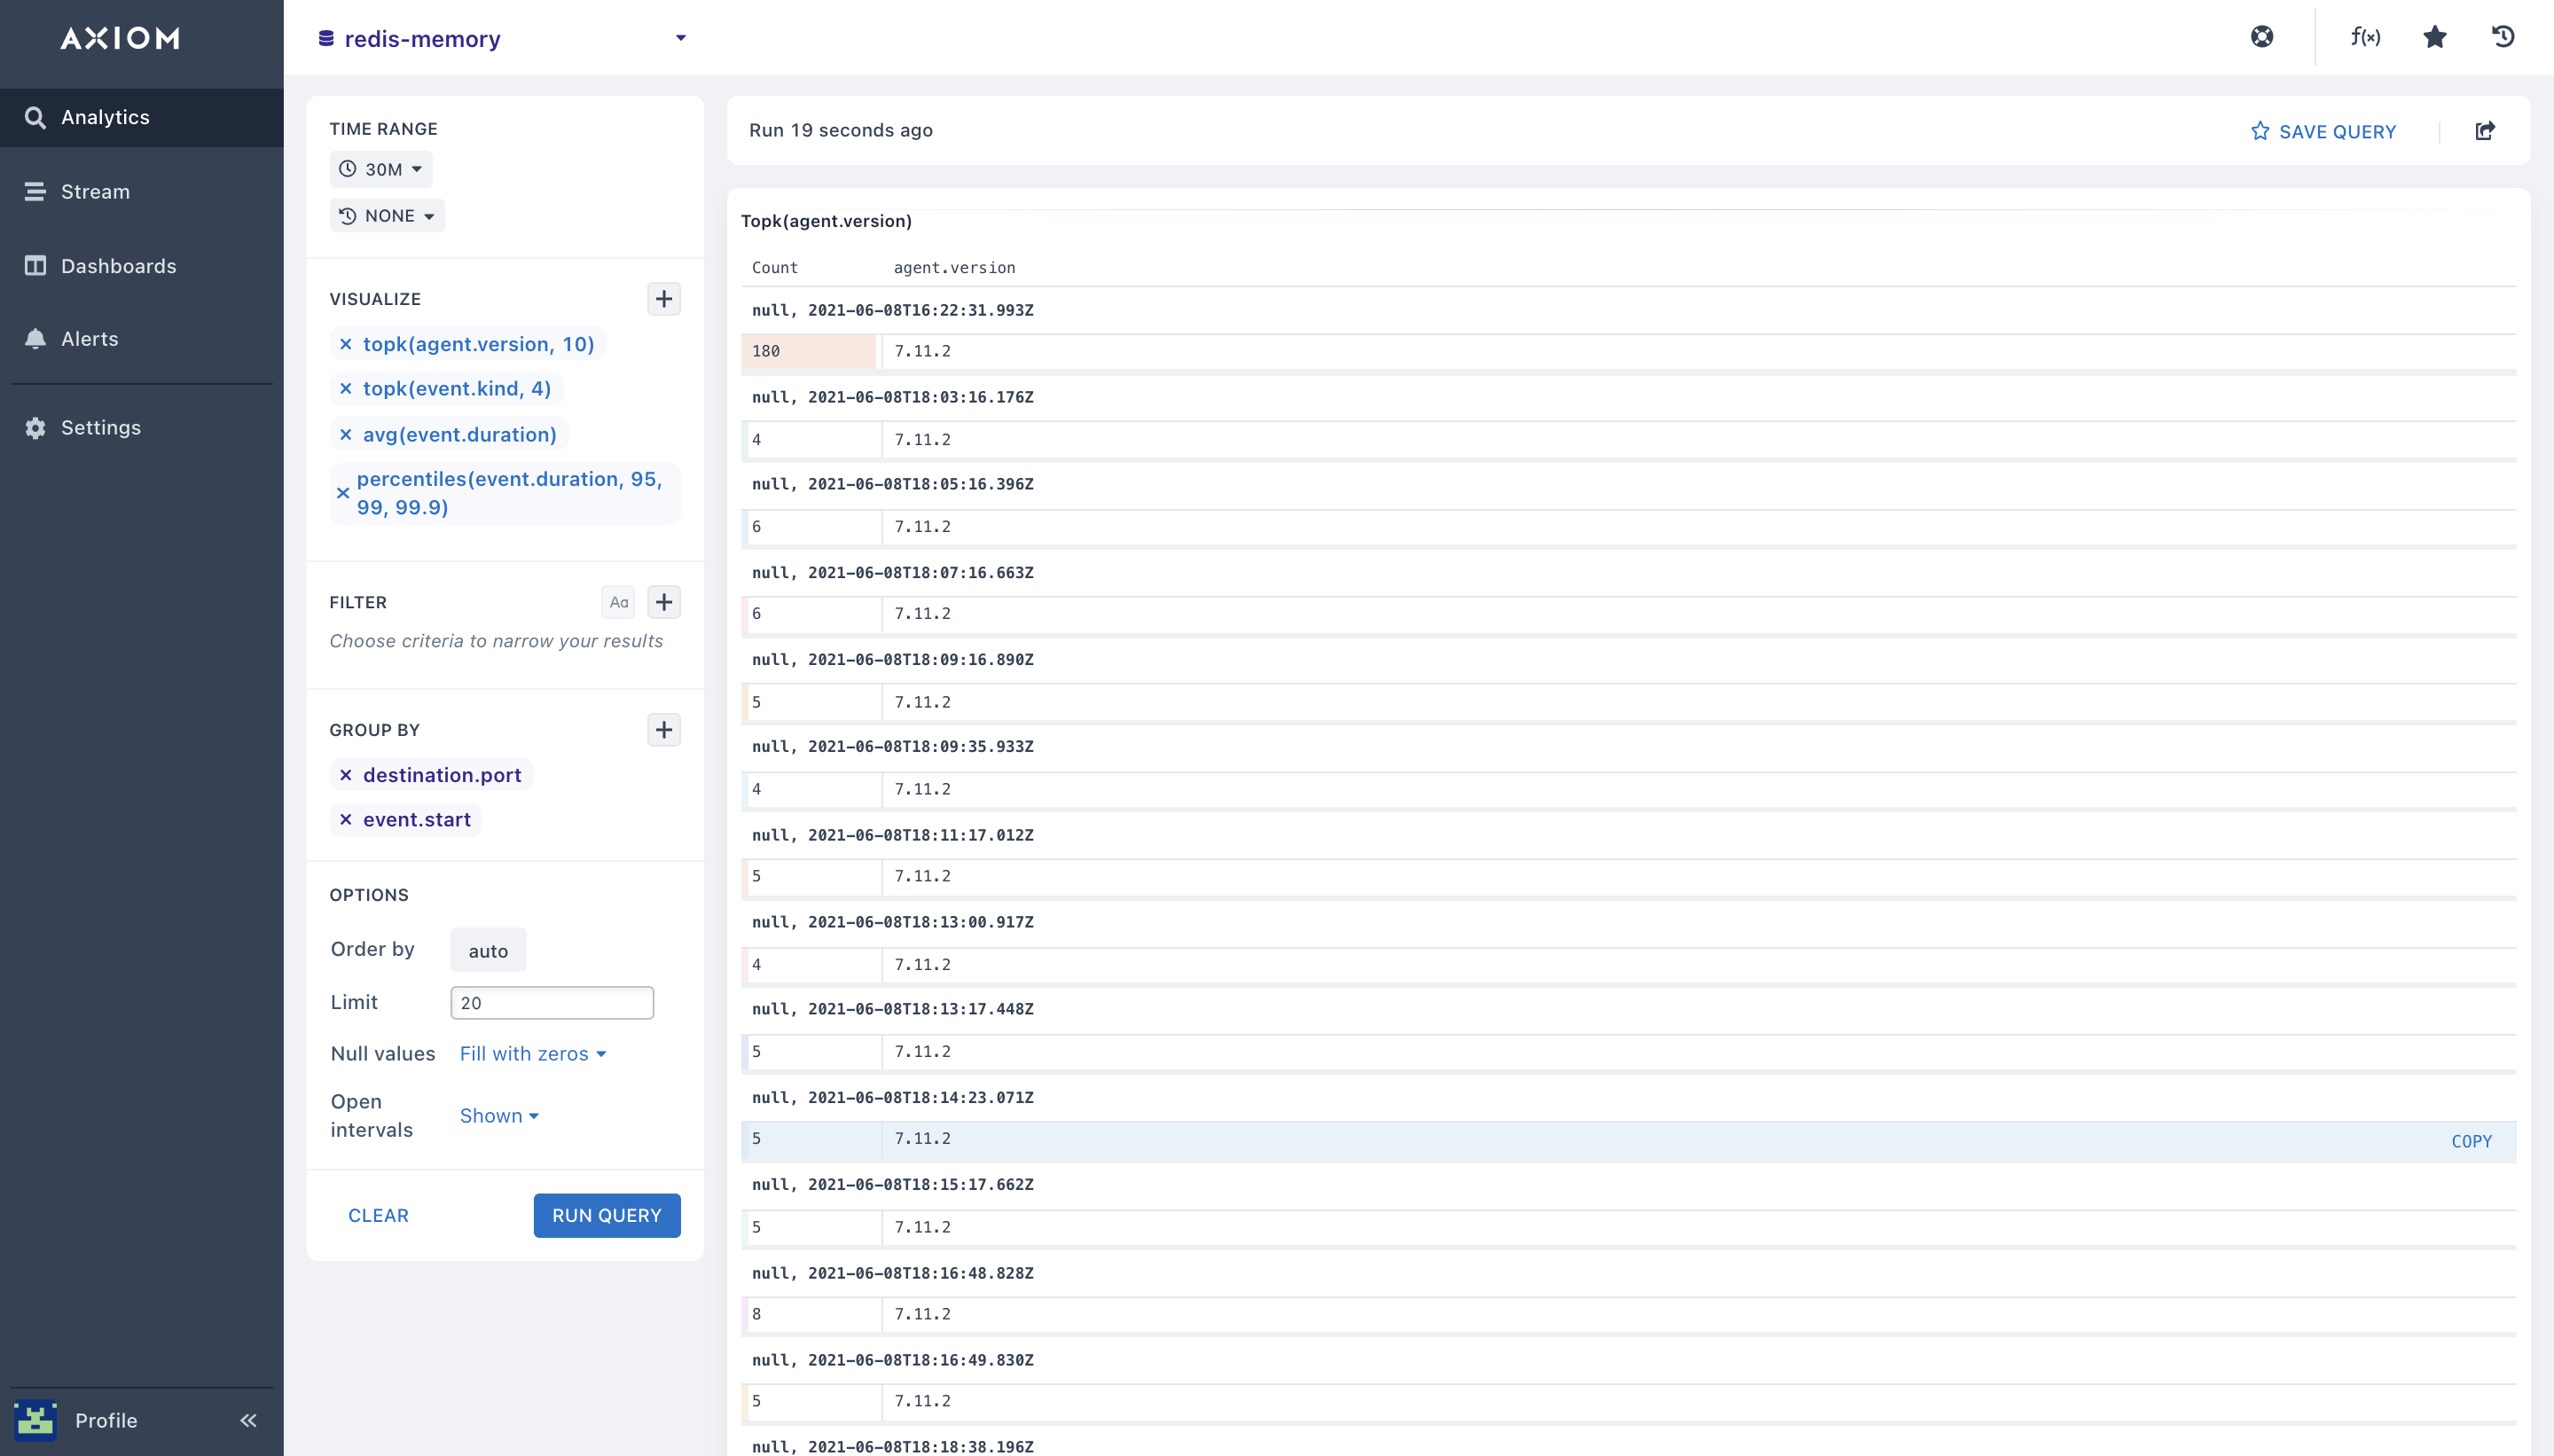
- topk(): using the
topk()Redis aggregation, you can obtain the “top 4” or “top 10” (where ‘4’ and ’10’ are ‘k’ in the topk) values for a field(s) in your Redis dataset. With this you can get the top Redis errors in a particular metrics time range, know the top redis performance graphs, and get the top Redis metrics.
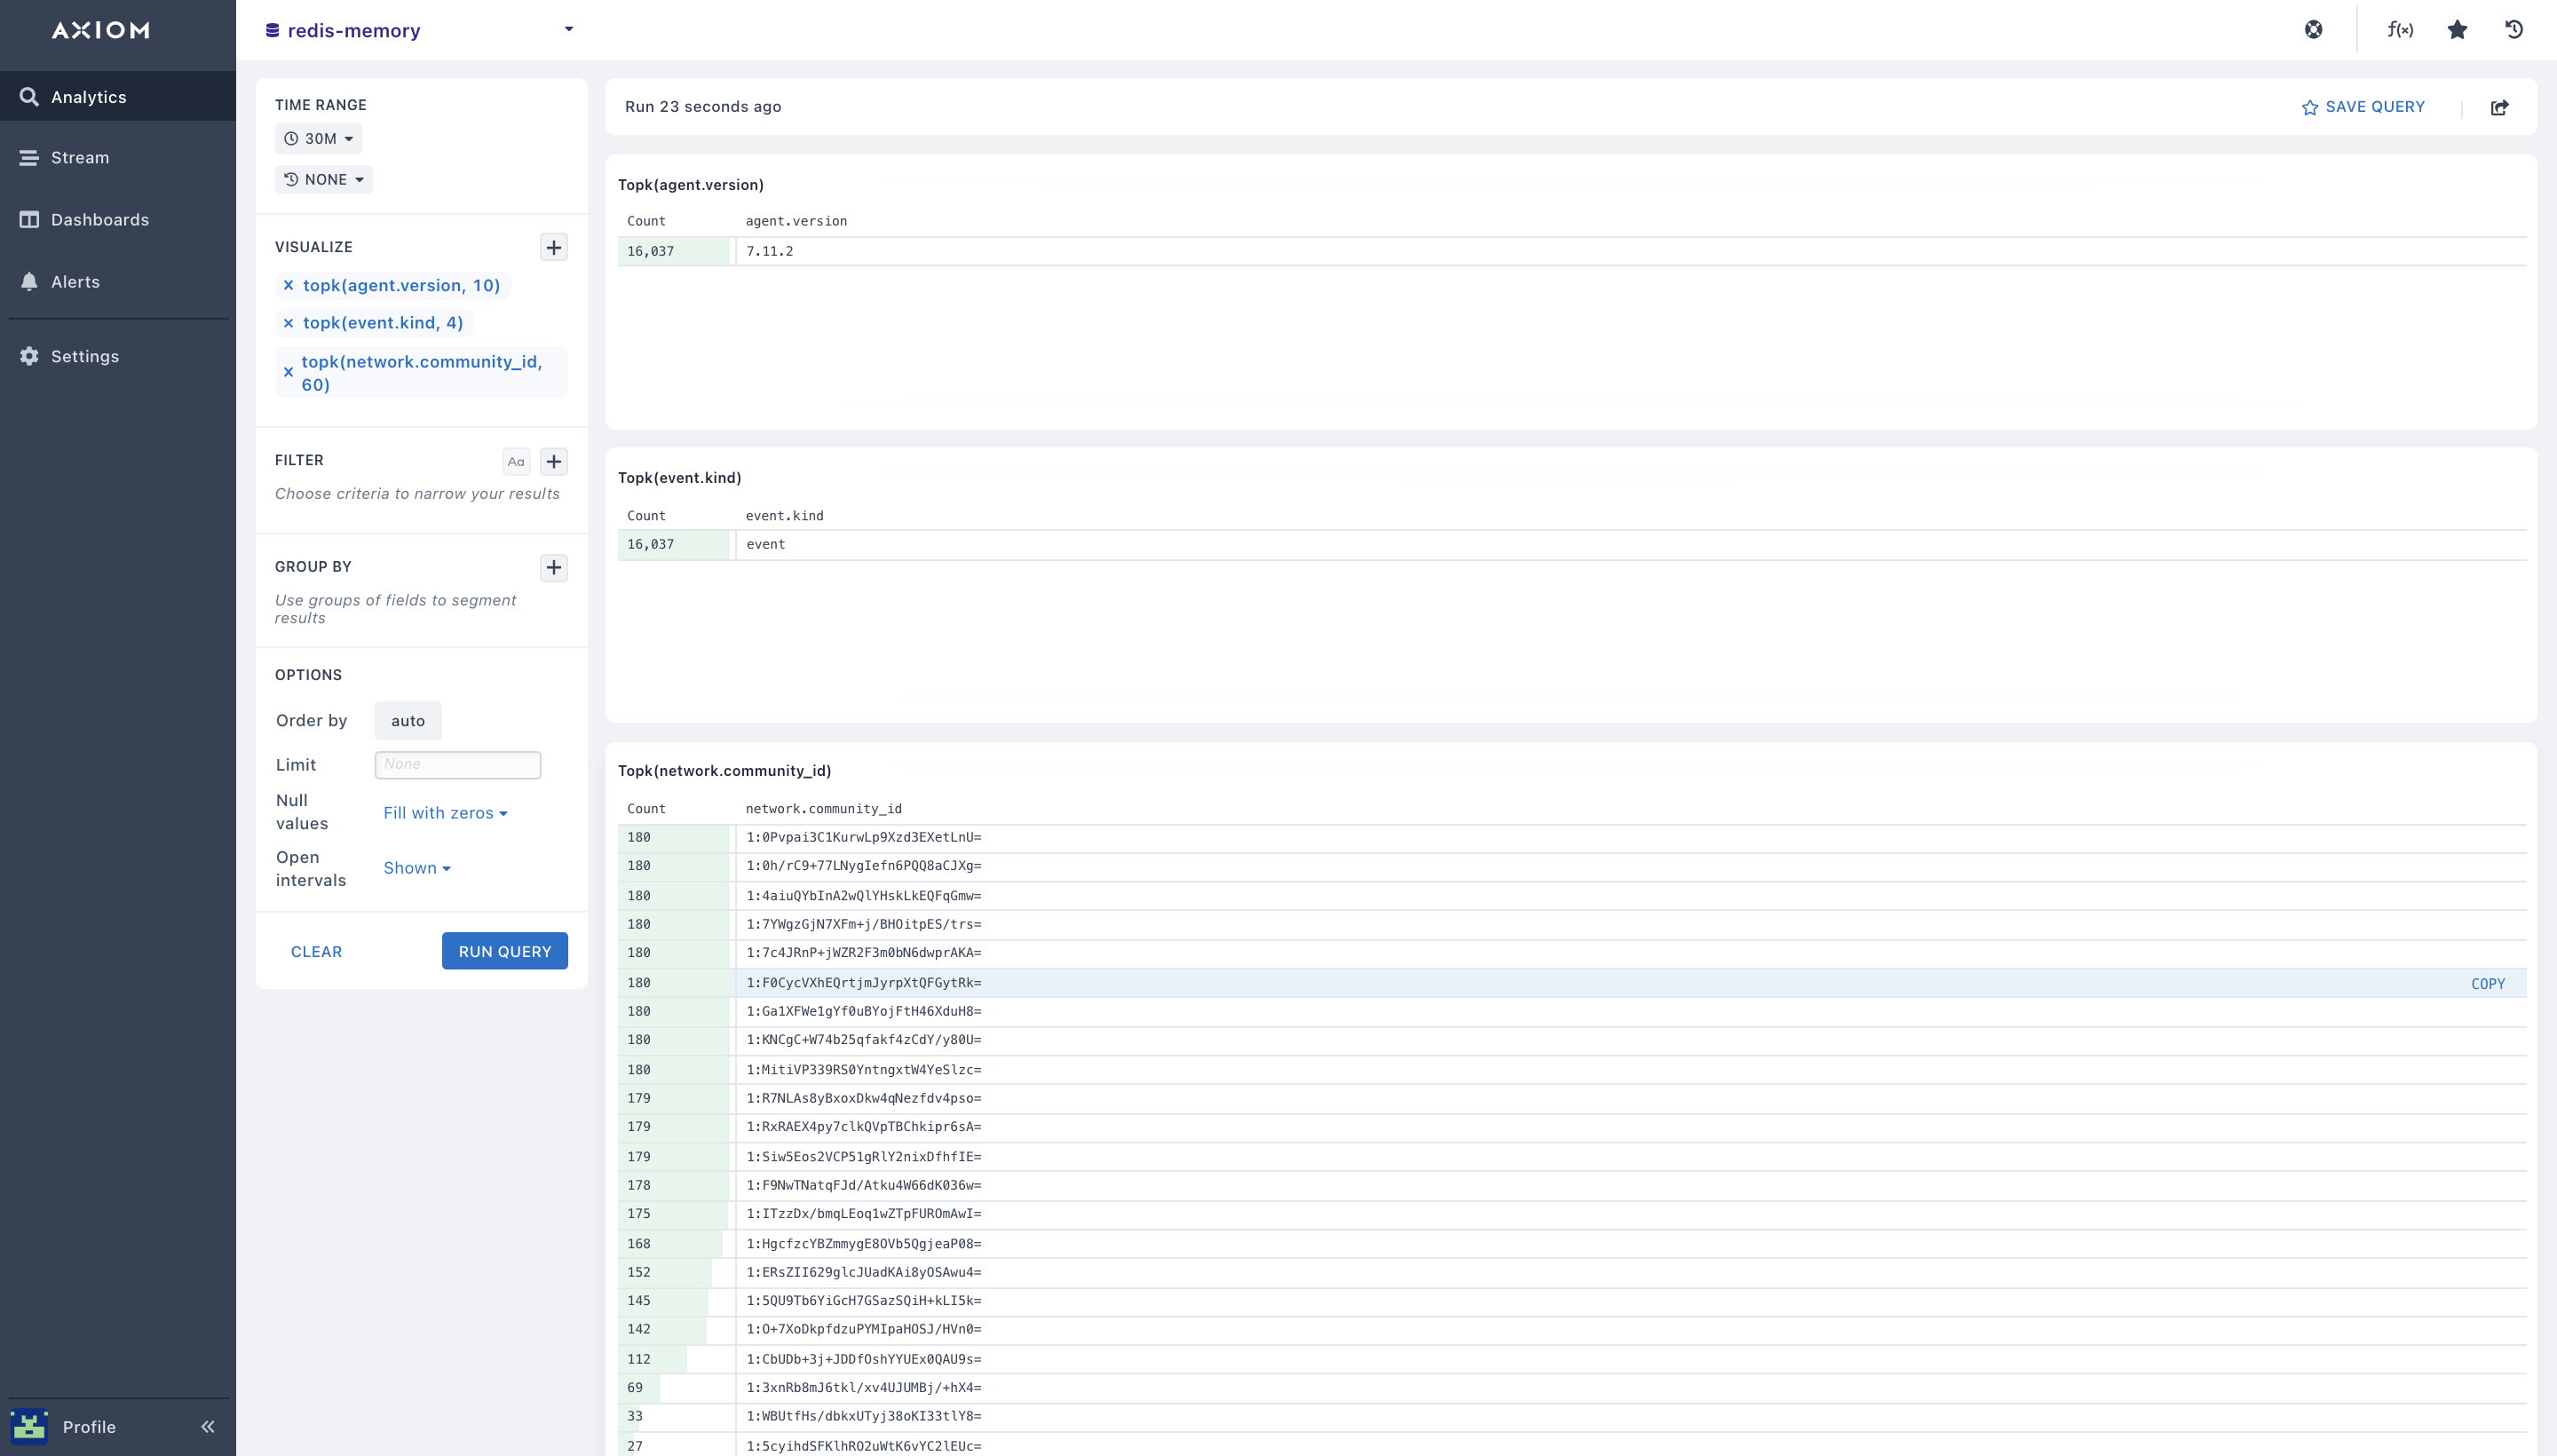
Before you can implement the topk aggregation it takes two arguments: The field to aggregate the Redis metrics and how many results to return. For example, getting the top agent version and the top event kind.
You can also combine topk + Groupby
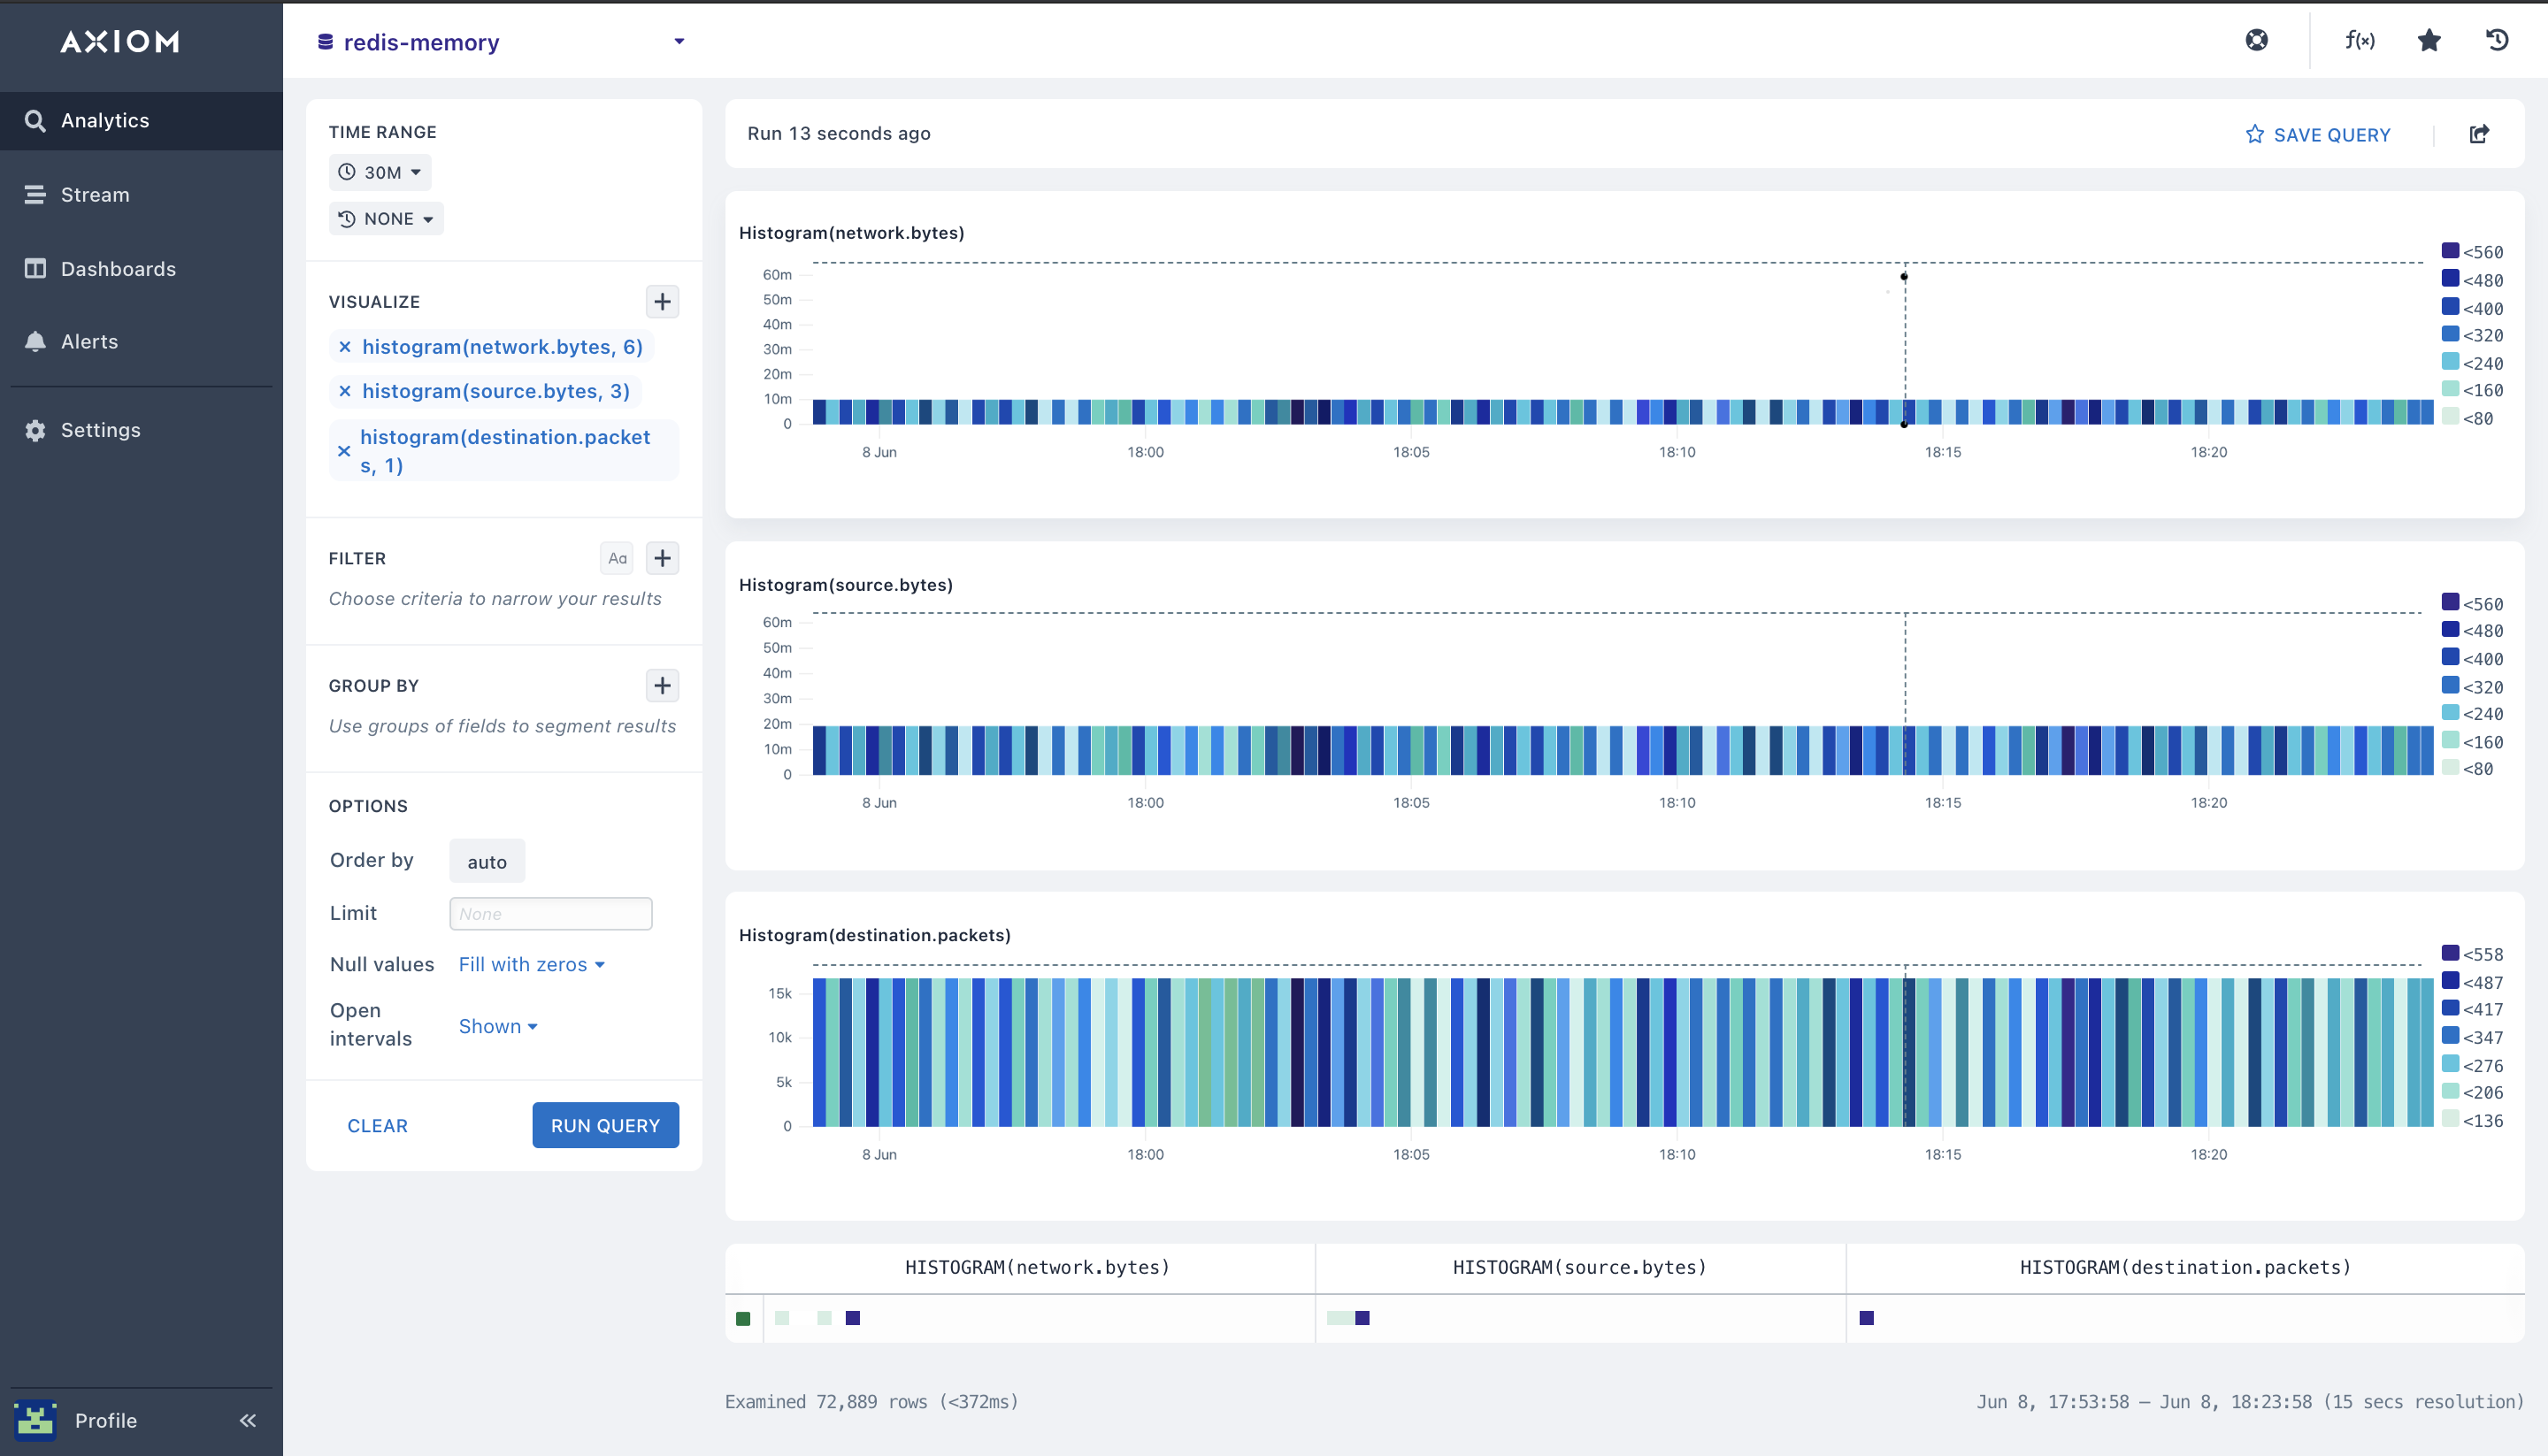
- histogram (): You can get the distribution values in your Redis metrics events field across a particular time range of your query using the
histogram()aggregation type. The histogram aggregation produces a Redis performance boxplot that makes it very easy for you to see variations and know how your Redis instance data, and redis cache hit ratio is being distributed across your Redis data store lookups logs.
The Histogram aggregation takes two arguments:
- The field you want to aggregate
- The number of buckets to split the values into (y-axis).
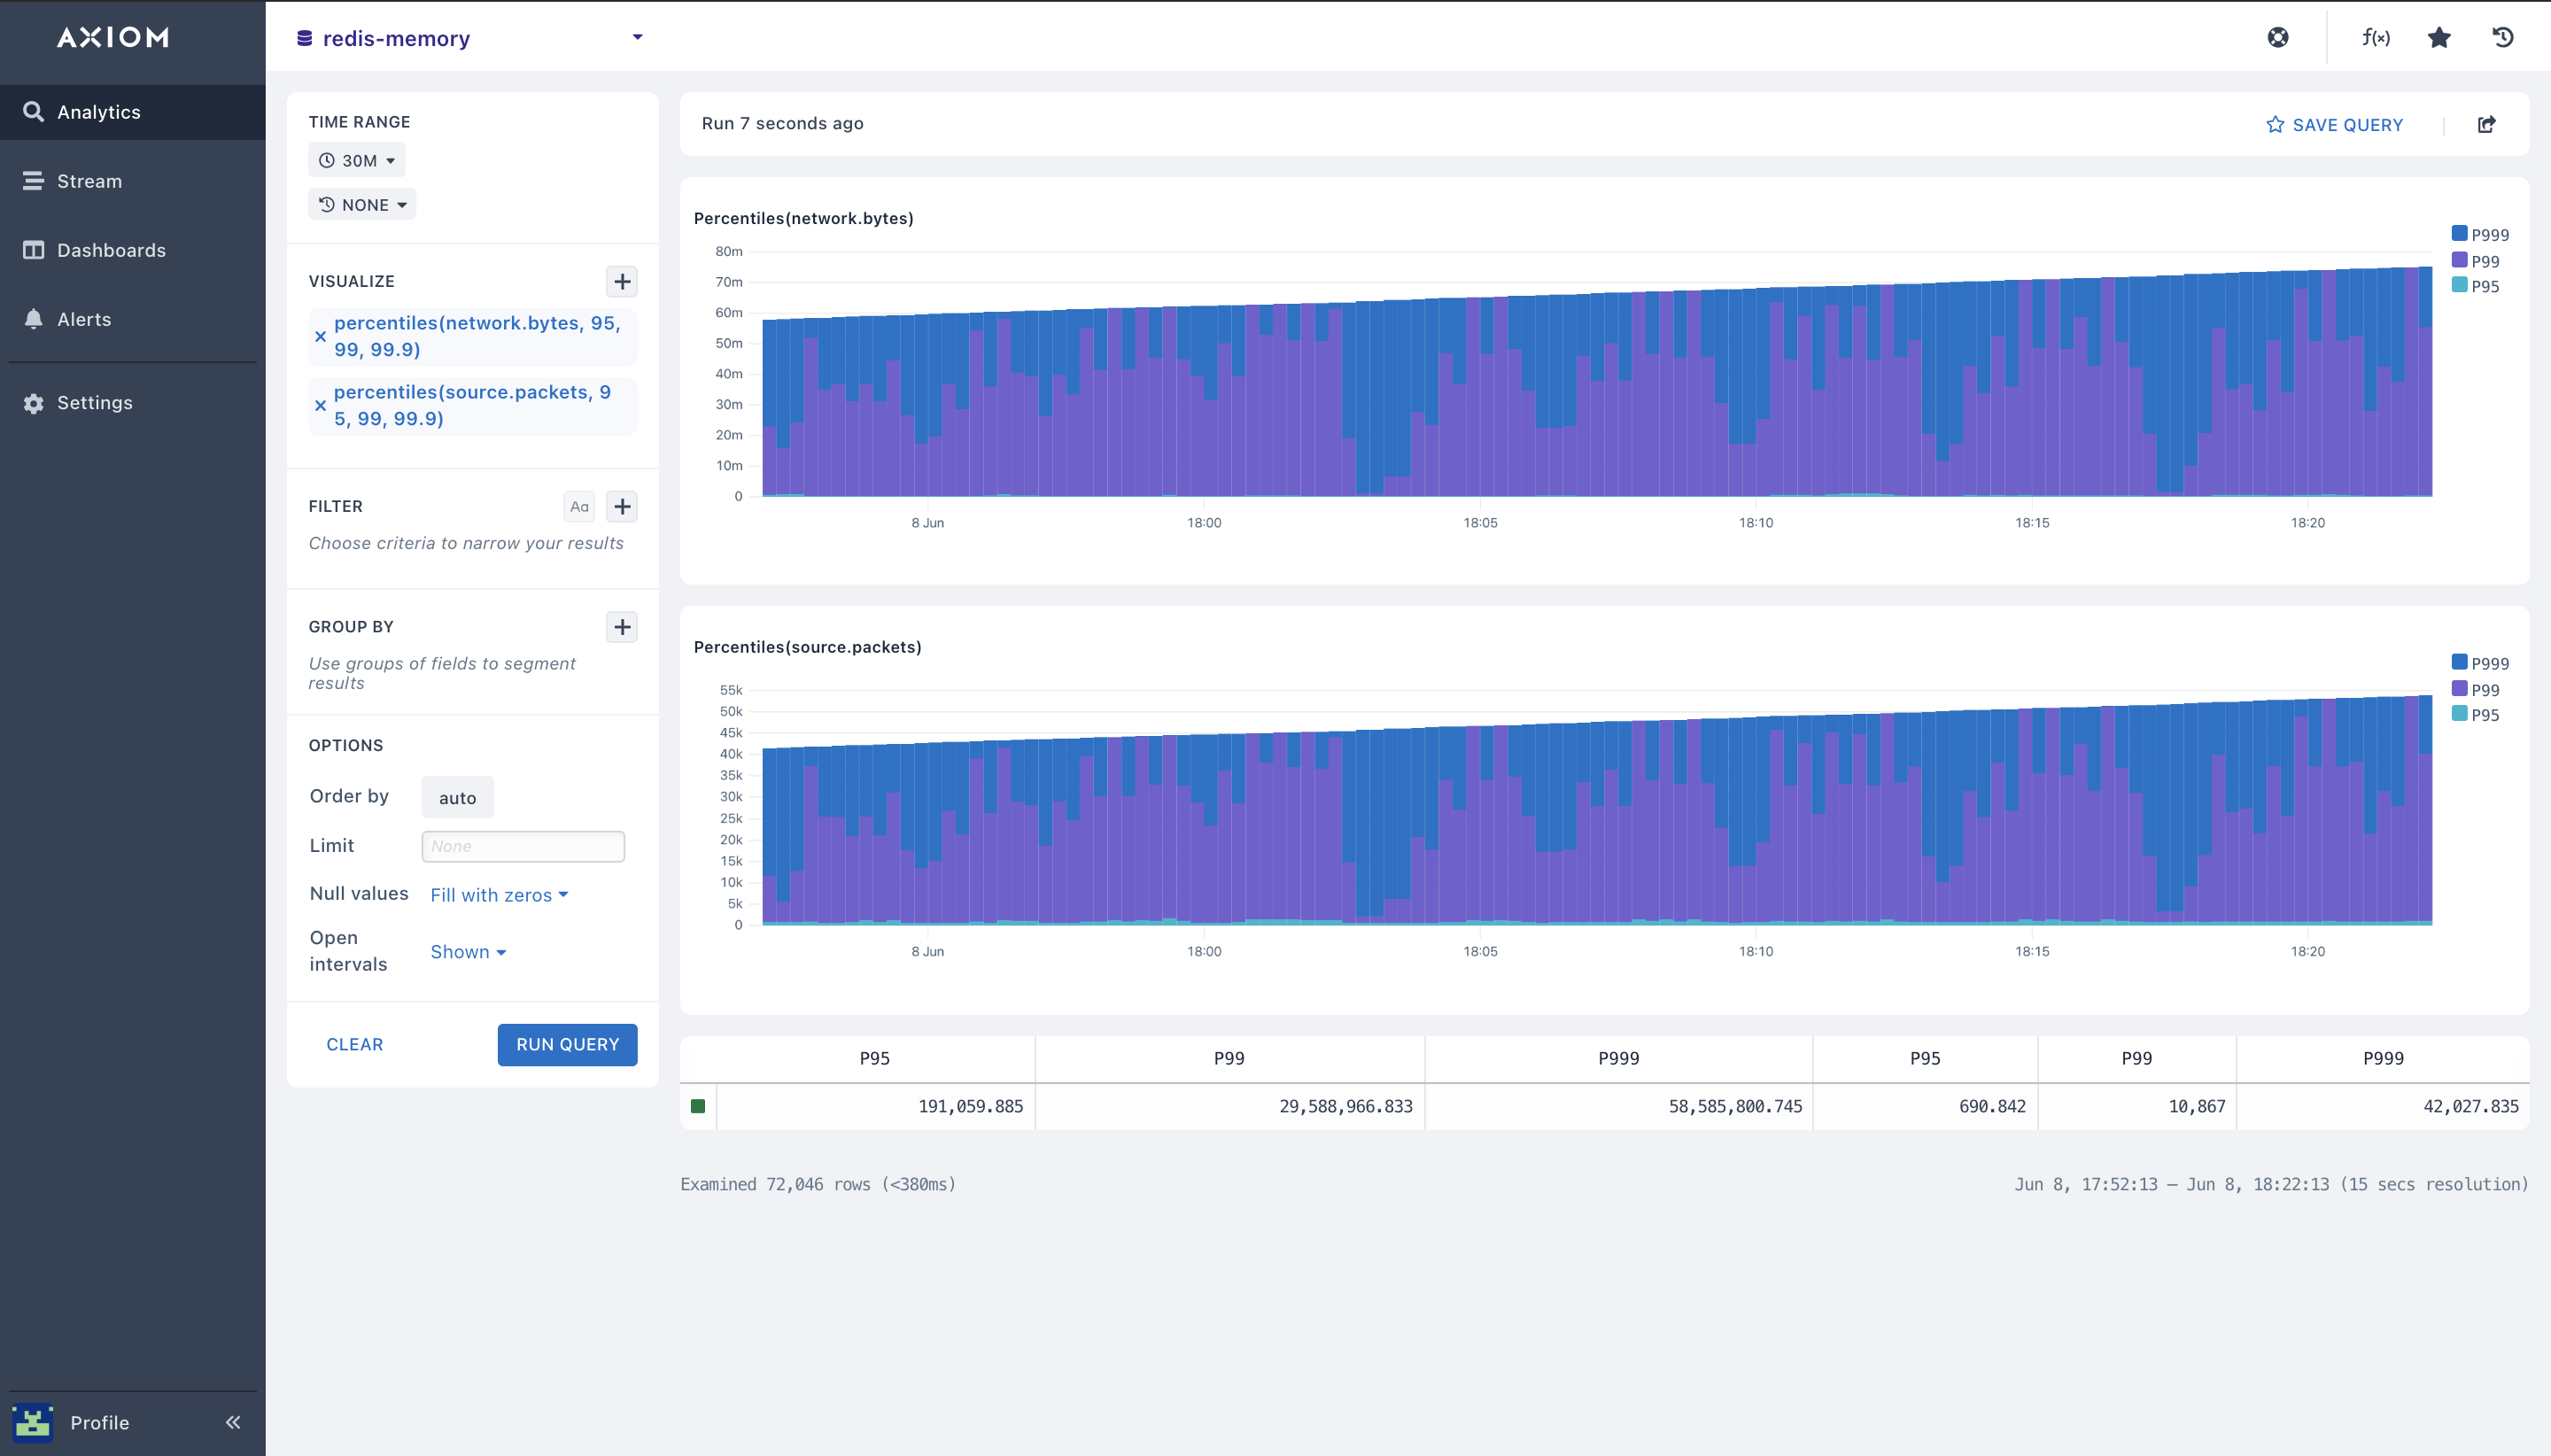
- percentile(): With the Percentile aggregation, you can calculate the value of a field of your Redis metrics data when it’s at or below which the percent of the results in the field fall. With this, you can send multiple percentiles to easily visualize the distribution of your redis server memory usage, performance metrics, get the total percentile of rejected connections when your Redis cluster hits the max memory. When you add a percentile aggregation, fill out the 95, 99, and 99.9 percentiles values. You can adjust these values whenever you want. With this, you’ll be able to view every Redis config deployment, and understand your Redis database metrics errors, and performance monitoring.
- Pairing Aggregations with Group By: Many of the aggregations above can be paired with a
Group By clausein your query to segment your Redis data. You can get a comprehensive view by pairing your aggregations above with the Group by expression in your query. This lets you segment your Redis metrics, and Redis number of client connections, Redis memory fragmentation and lets you have a view of how each fraction of your Redis metrics, Redis response time, and Redis network latency is operating.
- Pairing Aggregations with Against: You can get a measure and see the specific amount of Redis queries, Redis server errors, and Redis replicas blocked clients over a period of Redis metrics time,
(1 hour,3 hours, 7 days, 30mins)etc. This lets you know what Redis metrics or groups of performance monitoring metrics happened in the past.
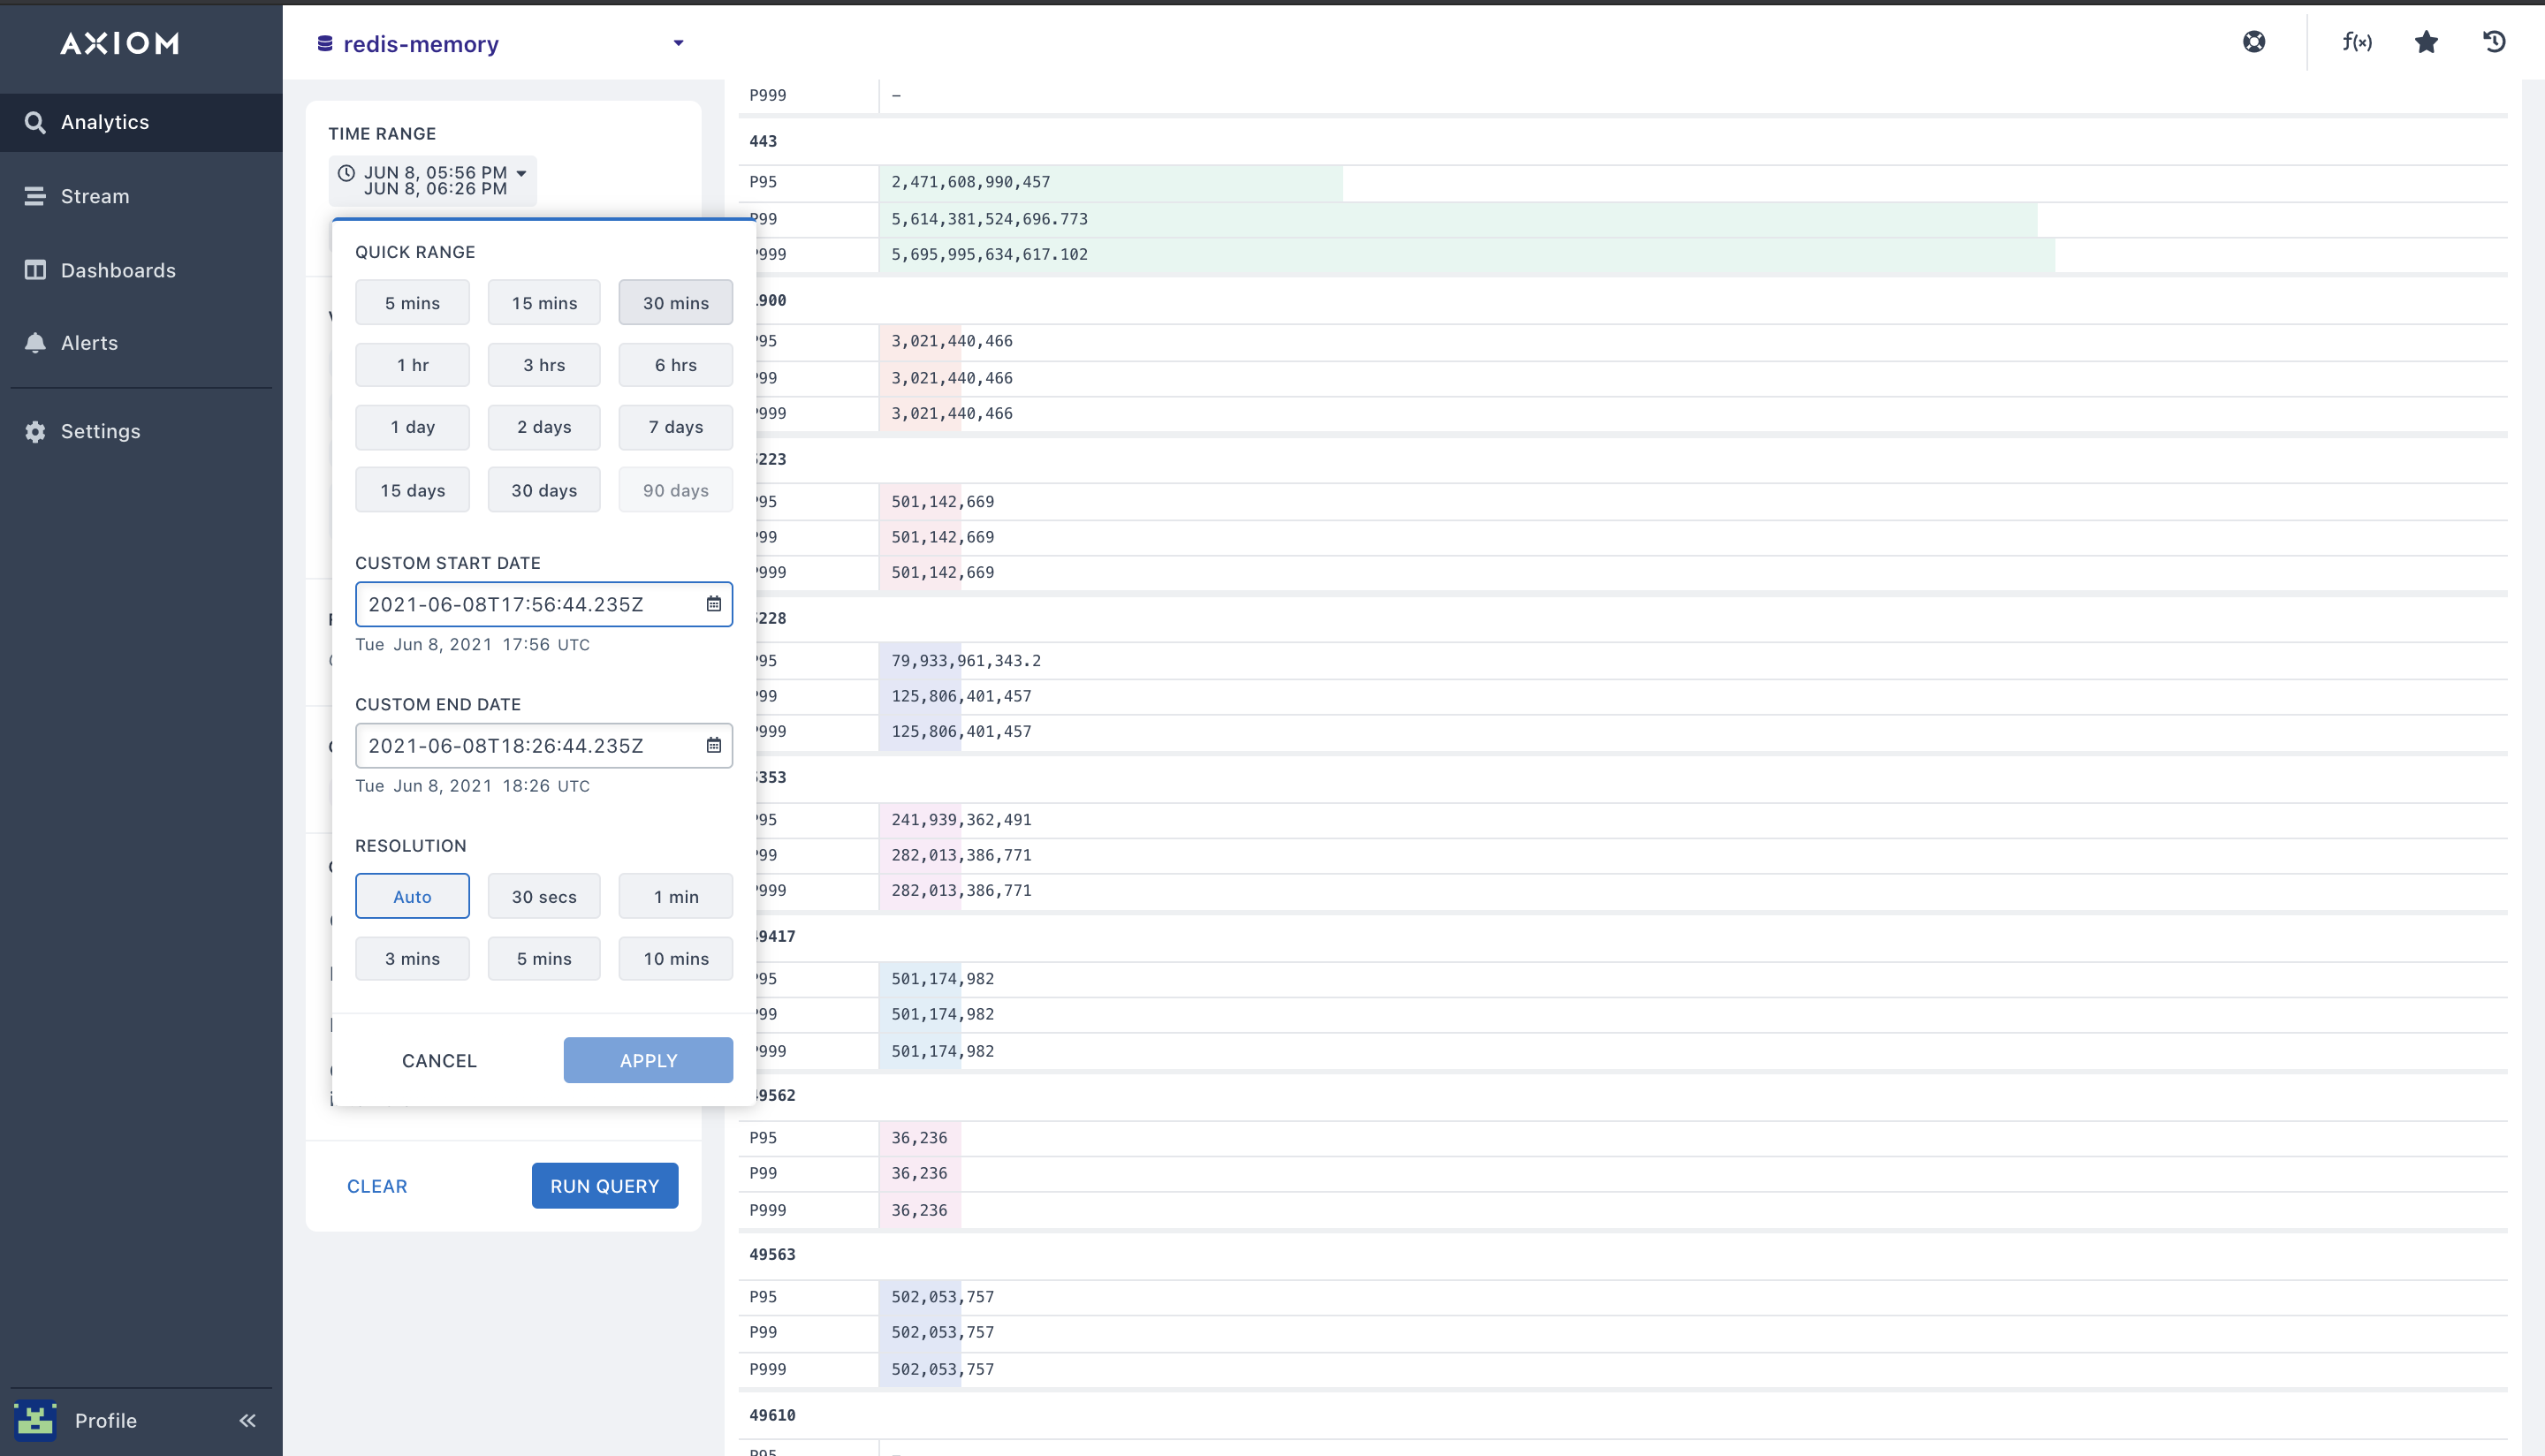
You can also compare the Redis metrics and throughput Redis data structure from different Redis monitoring use case to check if your network activity was similar to the network performance 2 days or 30 mins ago.
By using the Against query option, your query will be plotted against data from a preceding point in time so you can easily spot problems and activity flaws.
Can I do this myself?
Heck yeah you can!
If you have specific questions or troubleshooting Redis or issues configuring the Redis metrics config file, I'd love to hear about them. Contact us here or ask a question in our Discord community!
You can also follow us on Twitter and on our blog. And if you’ve enjoyed this post, please, take a second to share it on Twitter.
Explore more
- Read more about Packetbeat → Axiom Configuration on our docs
- Working with Virtualization.
- Working with Aggregations.


