
Working with Metricbeat and Axiom enables you to collect metrics and create extensive elasticsearch dashboards from different sources, like Apache, Nginx, Xpack, elastic stack, and elasticsearch, into Axiom. With our Metricbeat dashboard experience, you can get a comprehensive breakdown of how your system load, libbeat logs, kafka, system module, tls, elasticsearch metrics, and modules.d Metricbeat data memory is performing.
From your system metrics and Metricbeat, you can group your charts and queries, quickly identify faults, and share an overview of your dashboard usage with your team members as a unified workstation.
Learn to ship data from Metricbeat to Axiom. By correlating complex data, Axiom can show extensive breakdowns of system load metrics and data memory performance
Prerequisites
- Metricbeat is installed on your Linux, macOS, or Windows machine directly or via Docker or Kubernetes.
- Axiom Dataset & Token.
- Metricbeat system load module configured.
Use Axiom and MetricBeat to understand system performance
- Visit our docs to copy, edit and configure your Metricbeat modules to ship system metrics to Axiom. Metricbeat metric sets include CPU usage, filesystem, and other operating system sources like open source reload, redis tutorial, ubuntu logs, and postgresql. Here’s a sample snippet from
metricbeat.ymlin yaml format.
setup.ilm.enabled: false
metricbeat.config.modules:
metricbeat.modules:
  - module: system
    metricsets:
      - load
output.elasticsearch:
  hosts: ['$YOUR_AXIOM_URL:443/api/v1/datasets/<dataset>/elastic']
  # api_key can be your ingest or personal token
  api_key: 'user:token'
The $YOUR_AXIOM_URL is the URL of your Axiom deployment. The user:token is the ingest token for your deployment (always in a string format such as xapt-274dc2a2-5db4-4f8c-92a3-92e33bee92a7 ).
- Run your command after entering your
api_keyandAxiom_URL
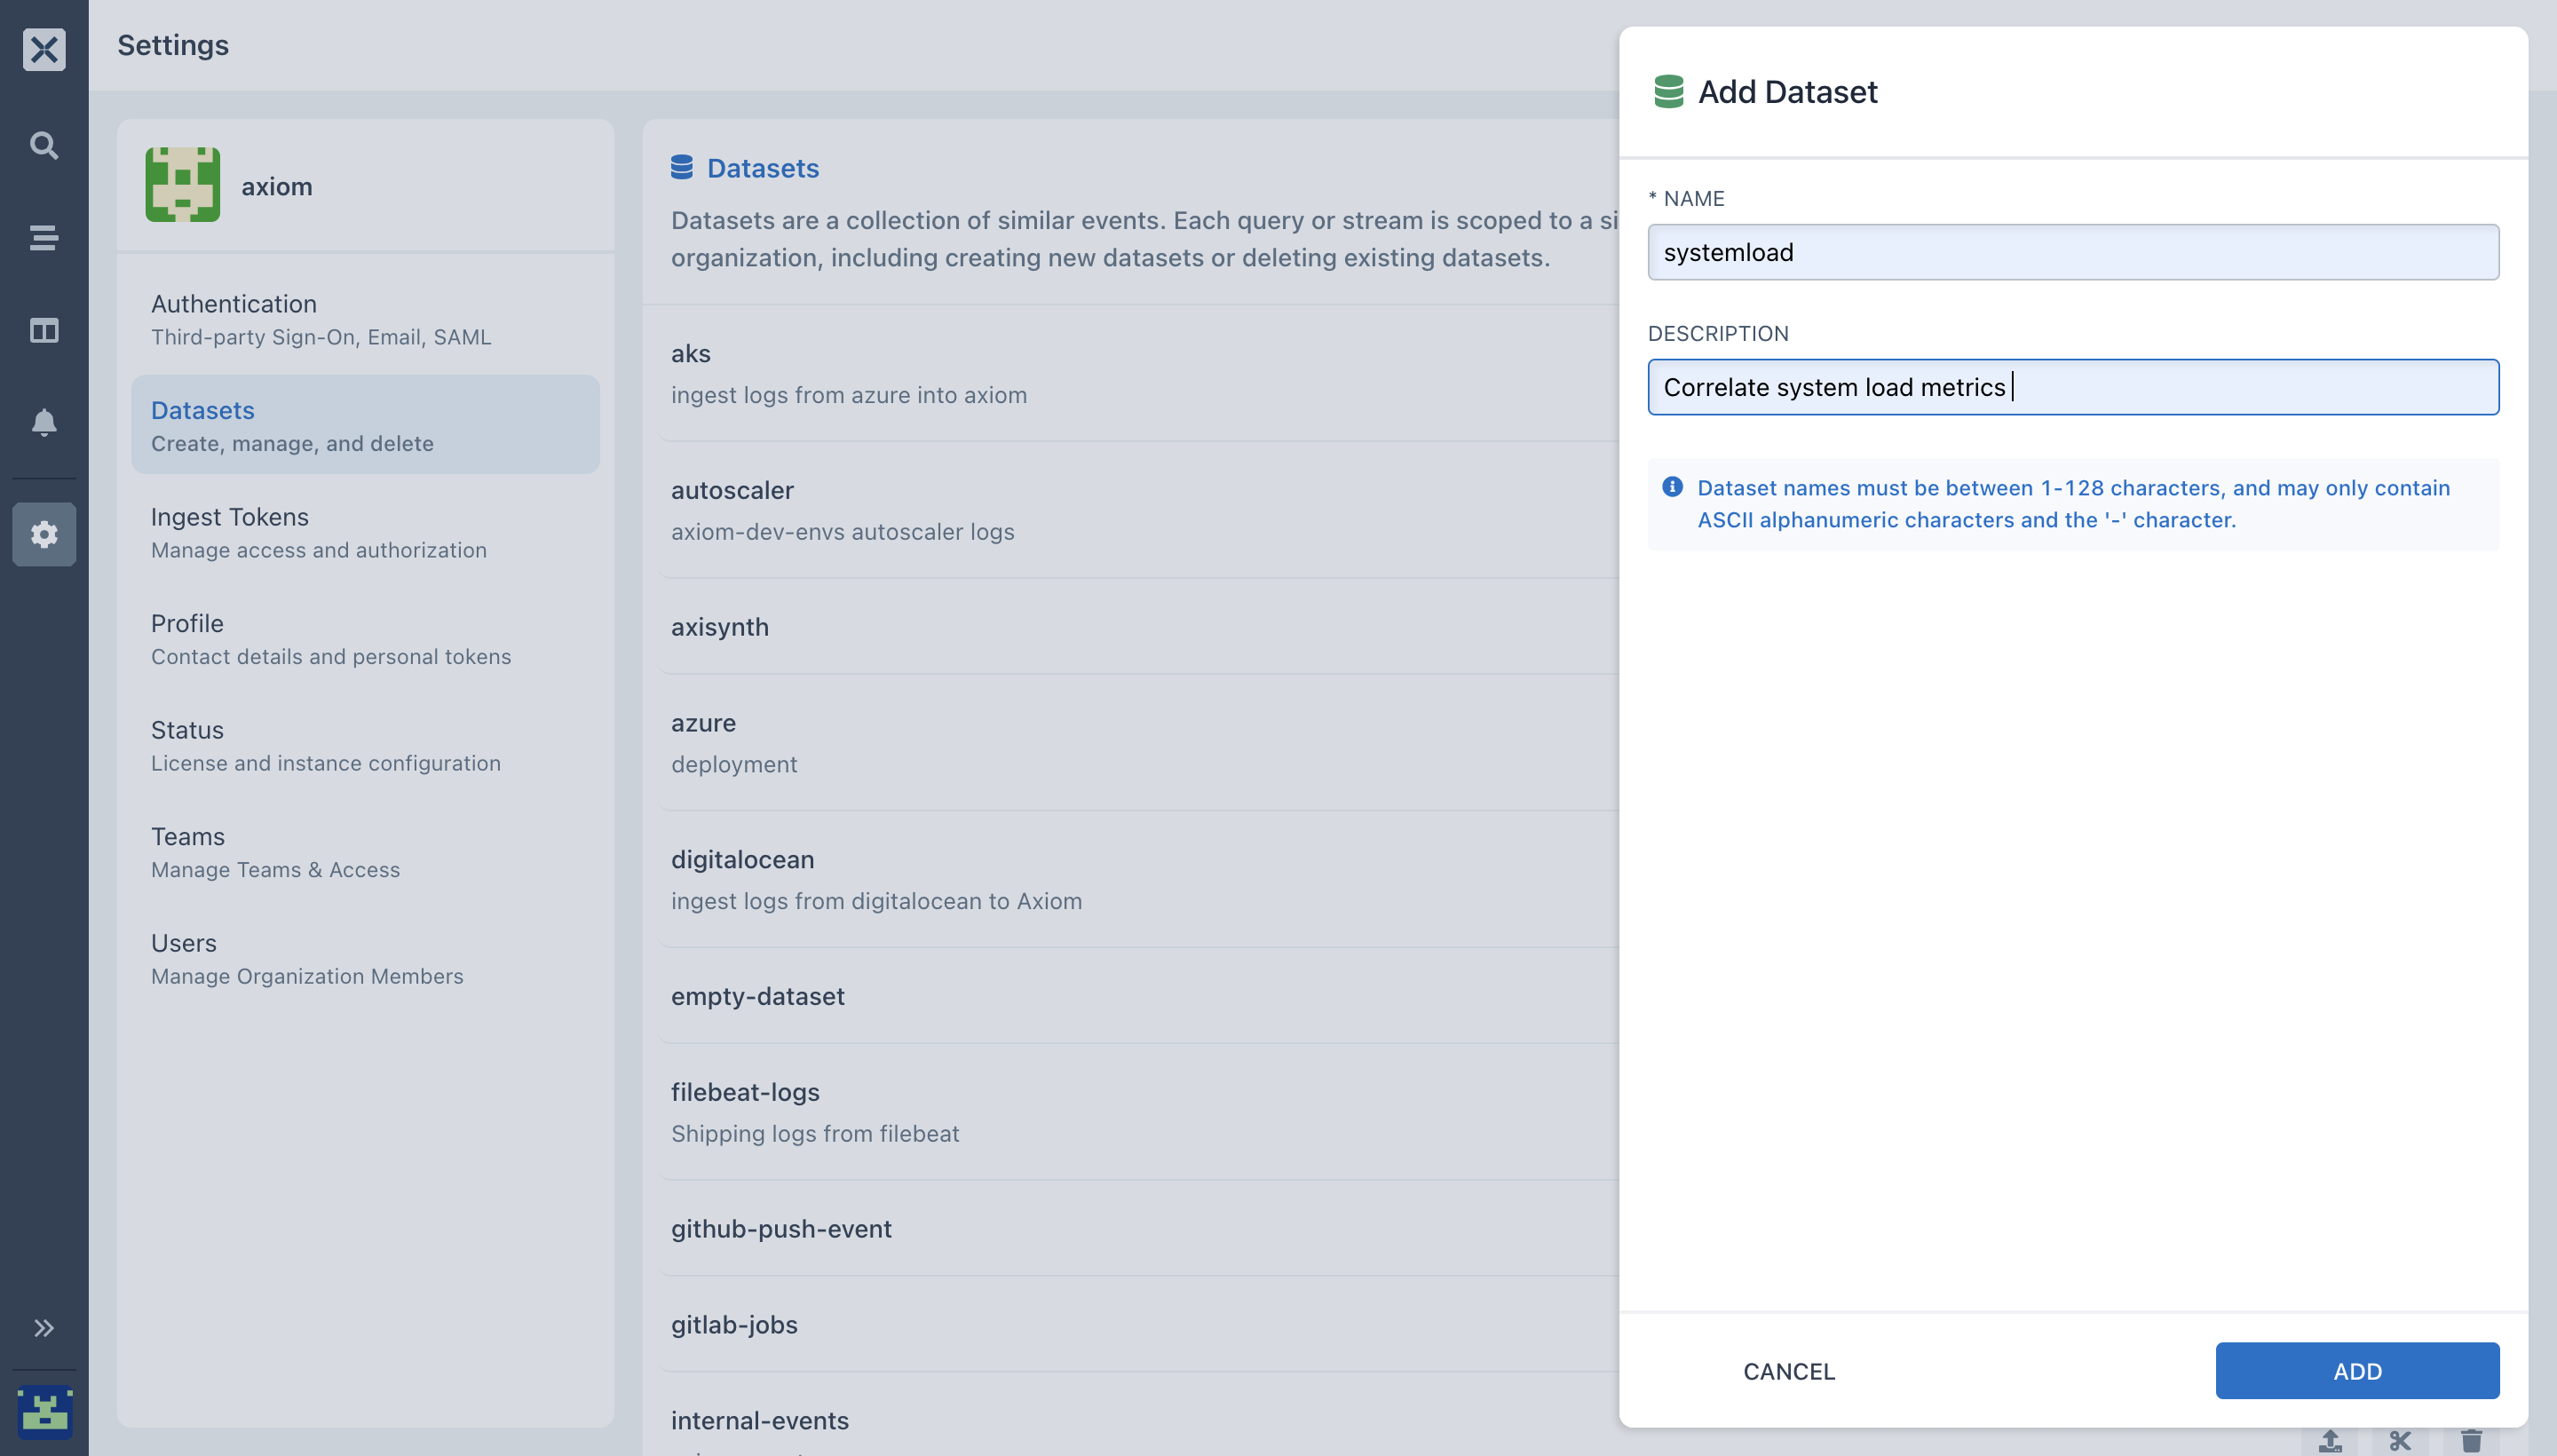
- To ship Metricbeat metrics to Axiom, you need a dataset, and an Ingest token. To create a new dataset, go to Settings → Datasets on the Axiom UI.
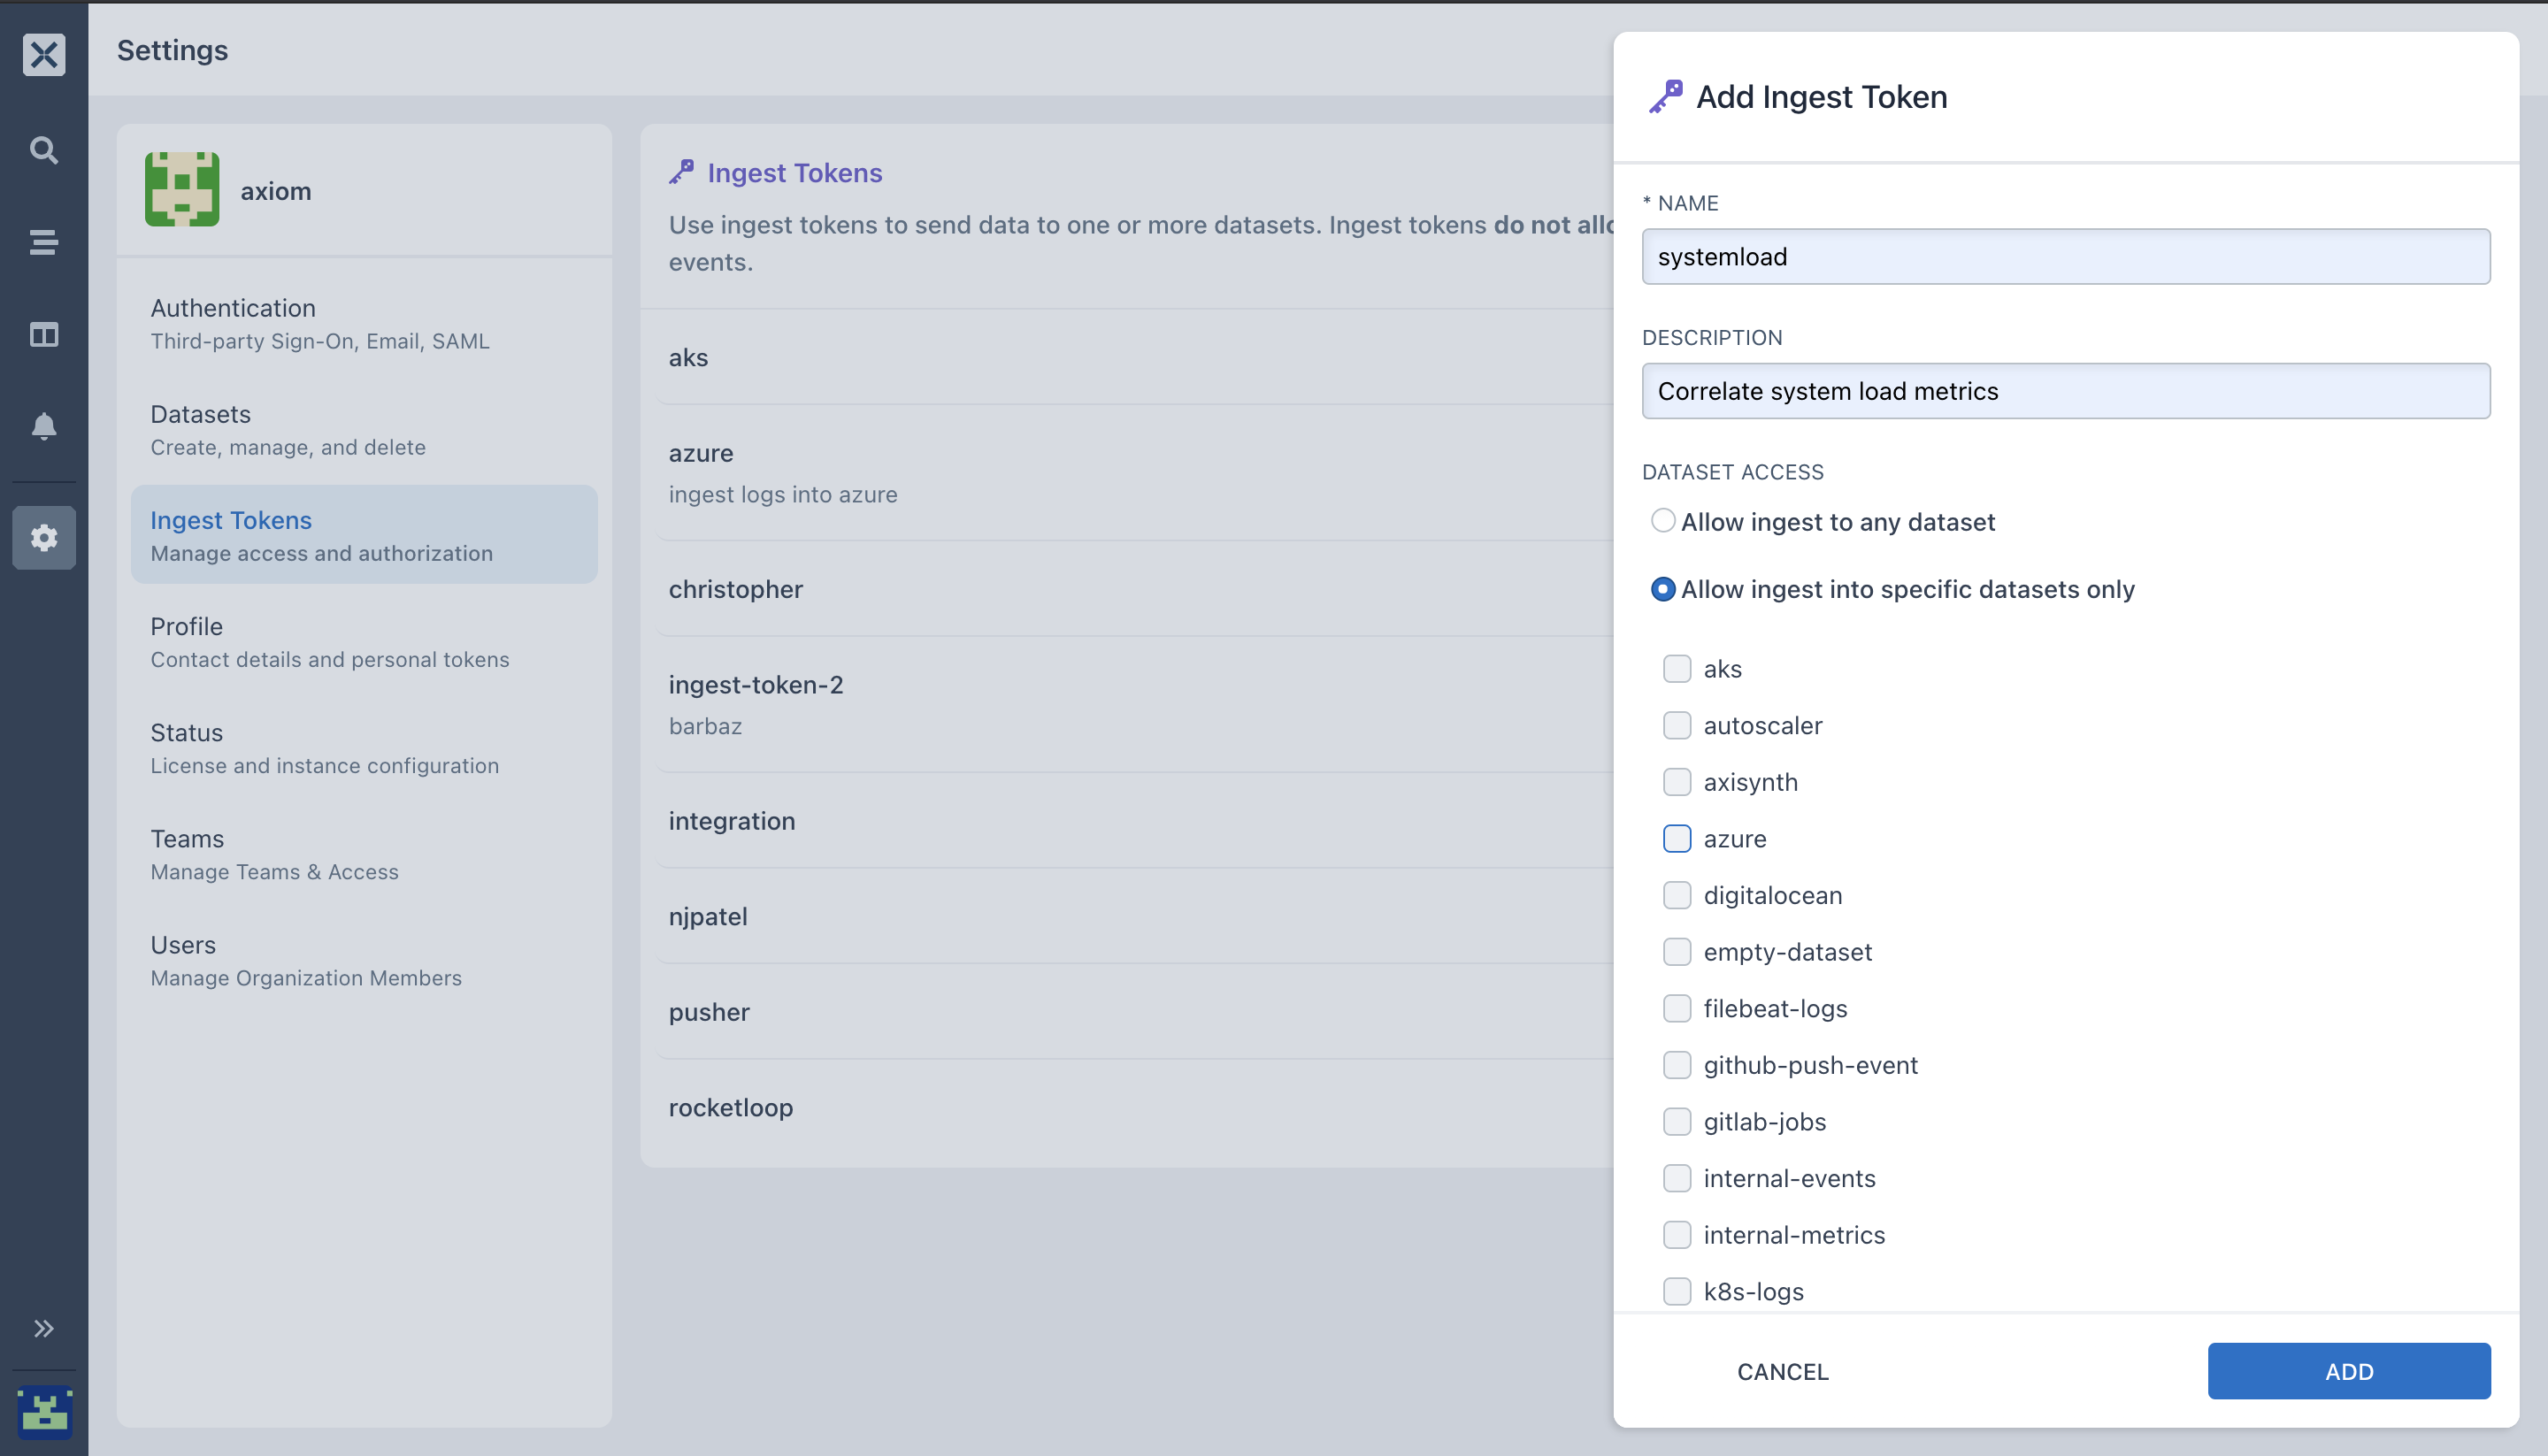
- Generate your ingest token,
- In the Axiom UI, click on settings, select ingest token.
- Select Add ingest token.
- Enter a name and description and select ADD.
- Copy the generated token to your clipboard. Once you navigate from the page, the token can be seen again by selecting Ingest Tokens.
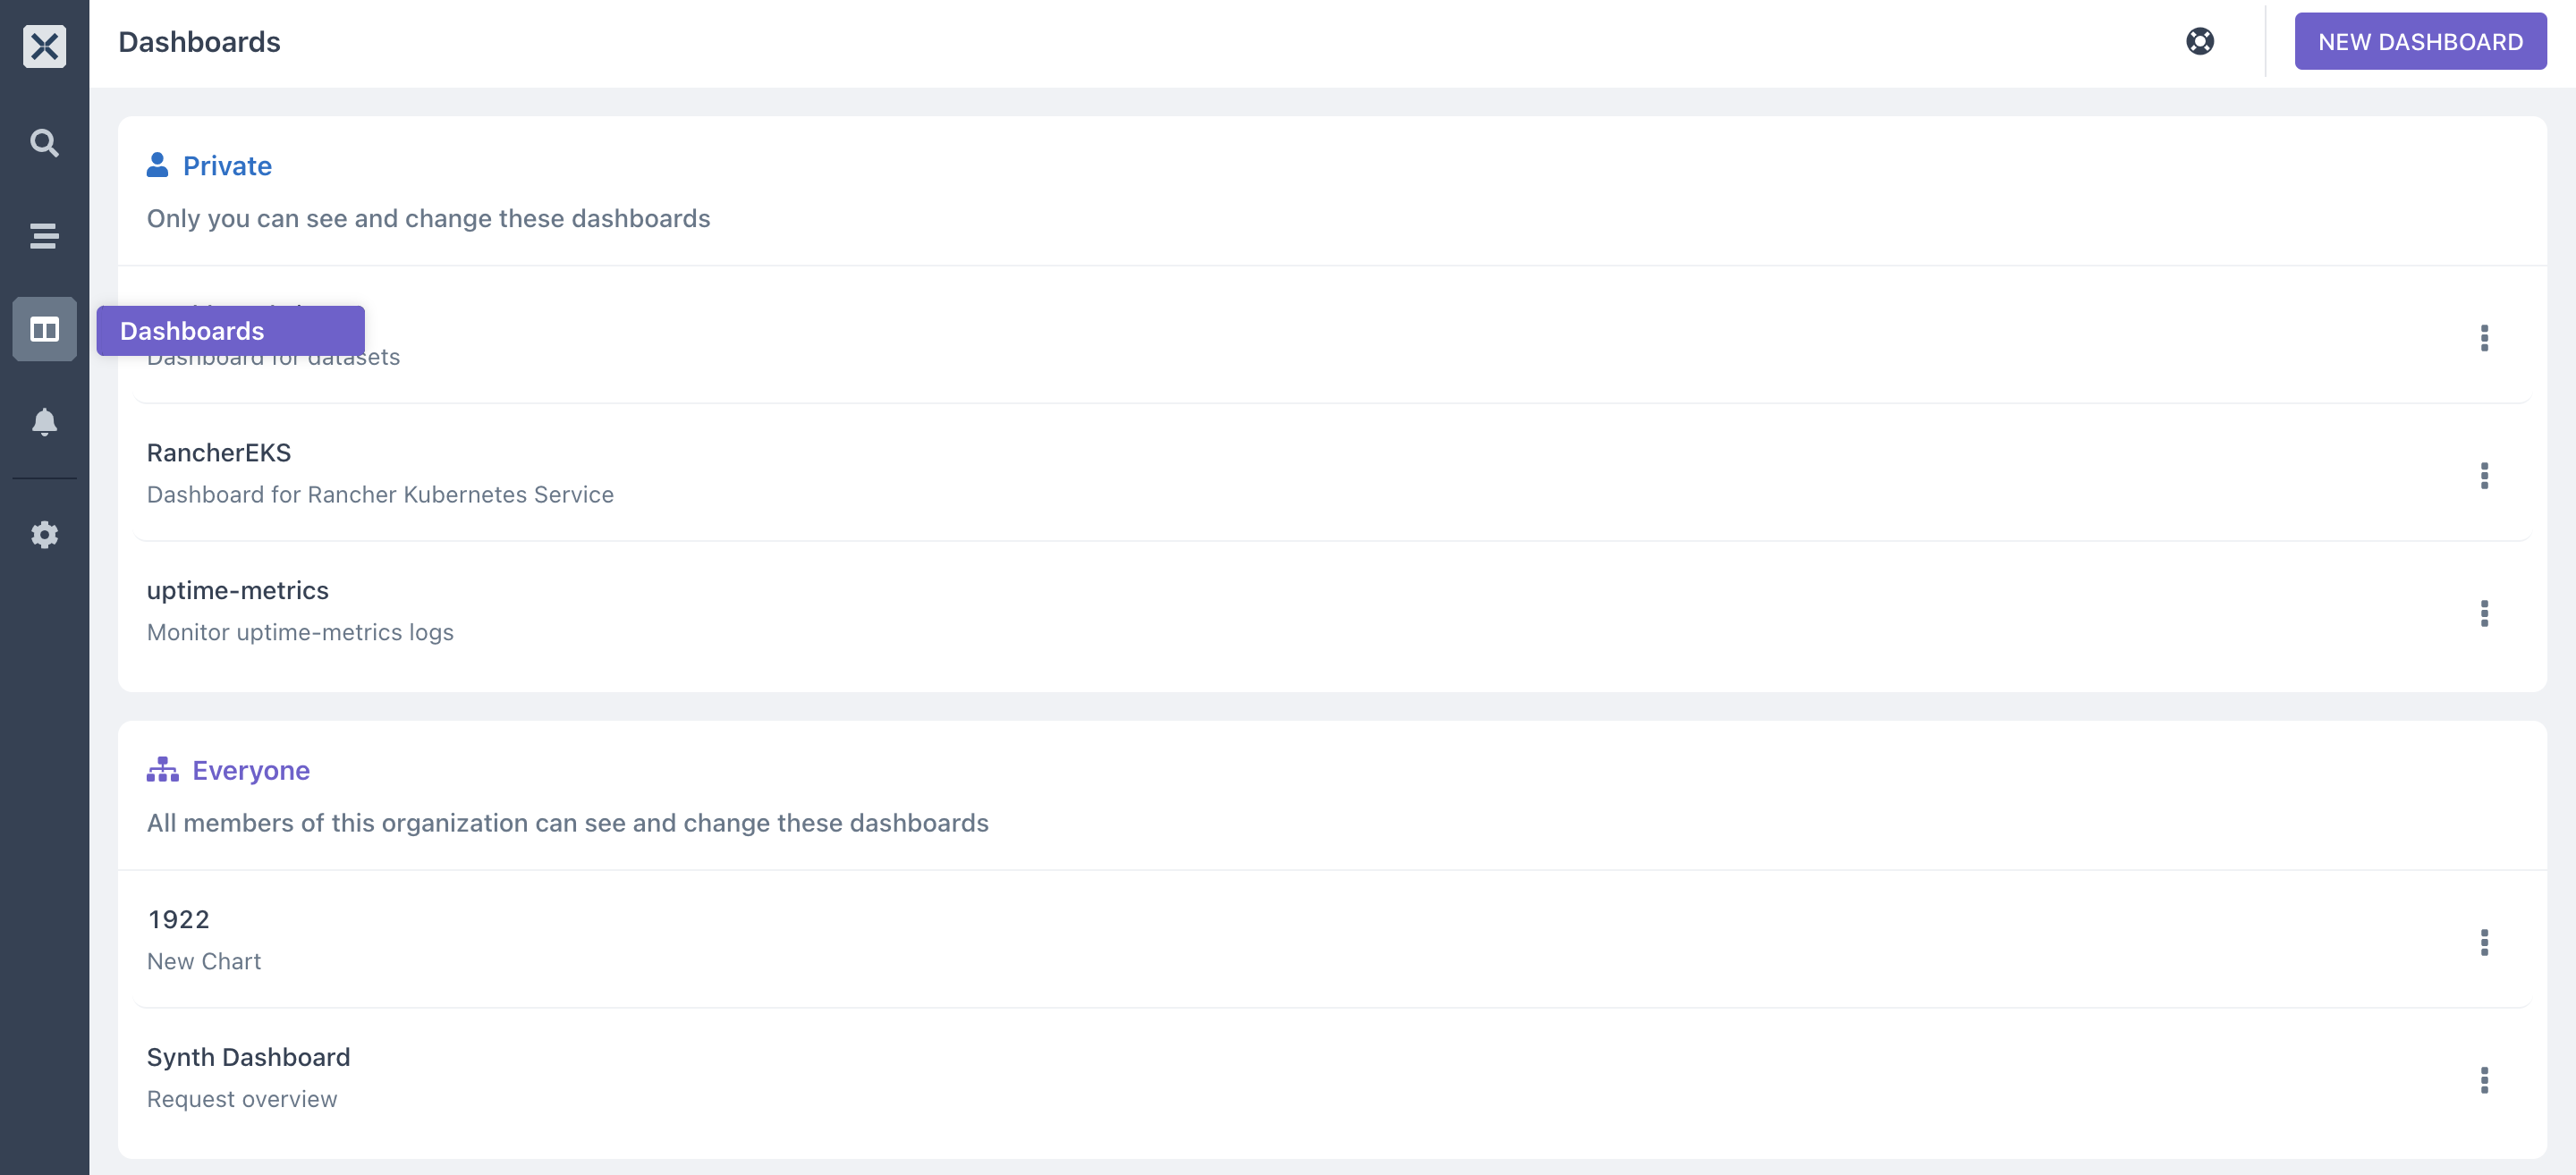
- Axiom kibana dashboards let you create control panels for your Metricbeat metrics, which makes it very easy to visualize your Metricbeat system load modules and share your Metricbeat data with your team members.
You can create and add dashboard from your system load dataset by:
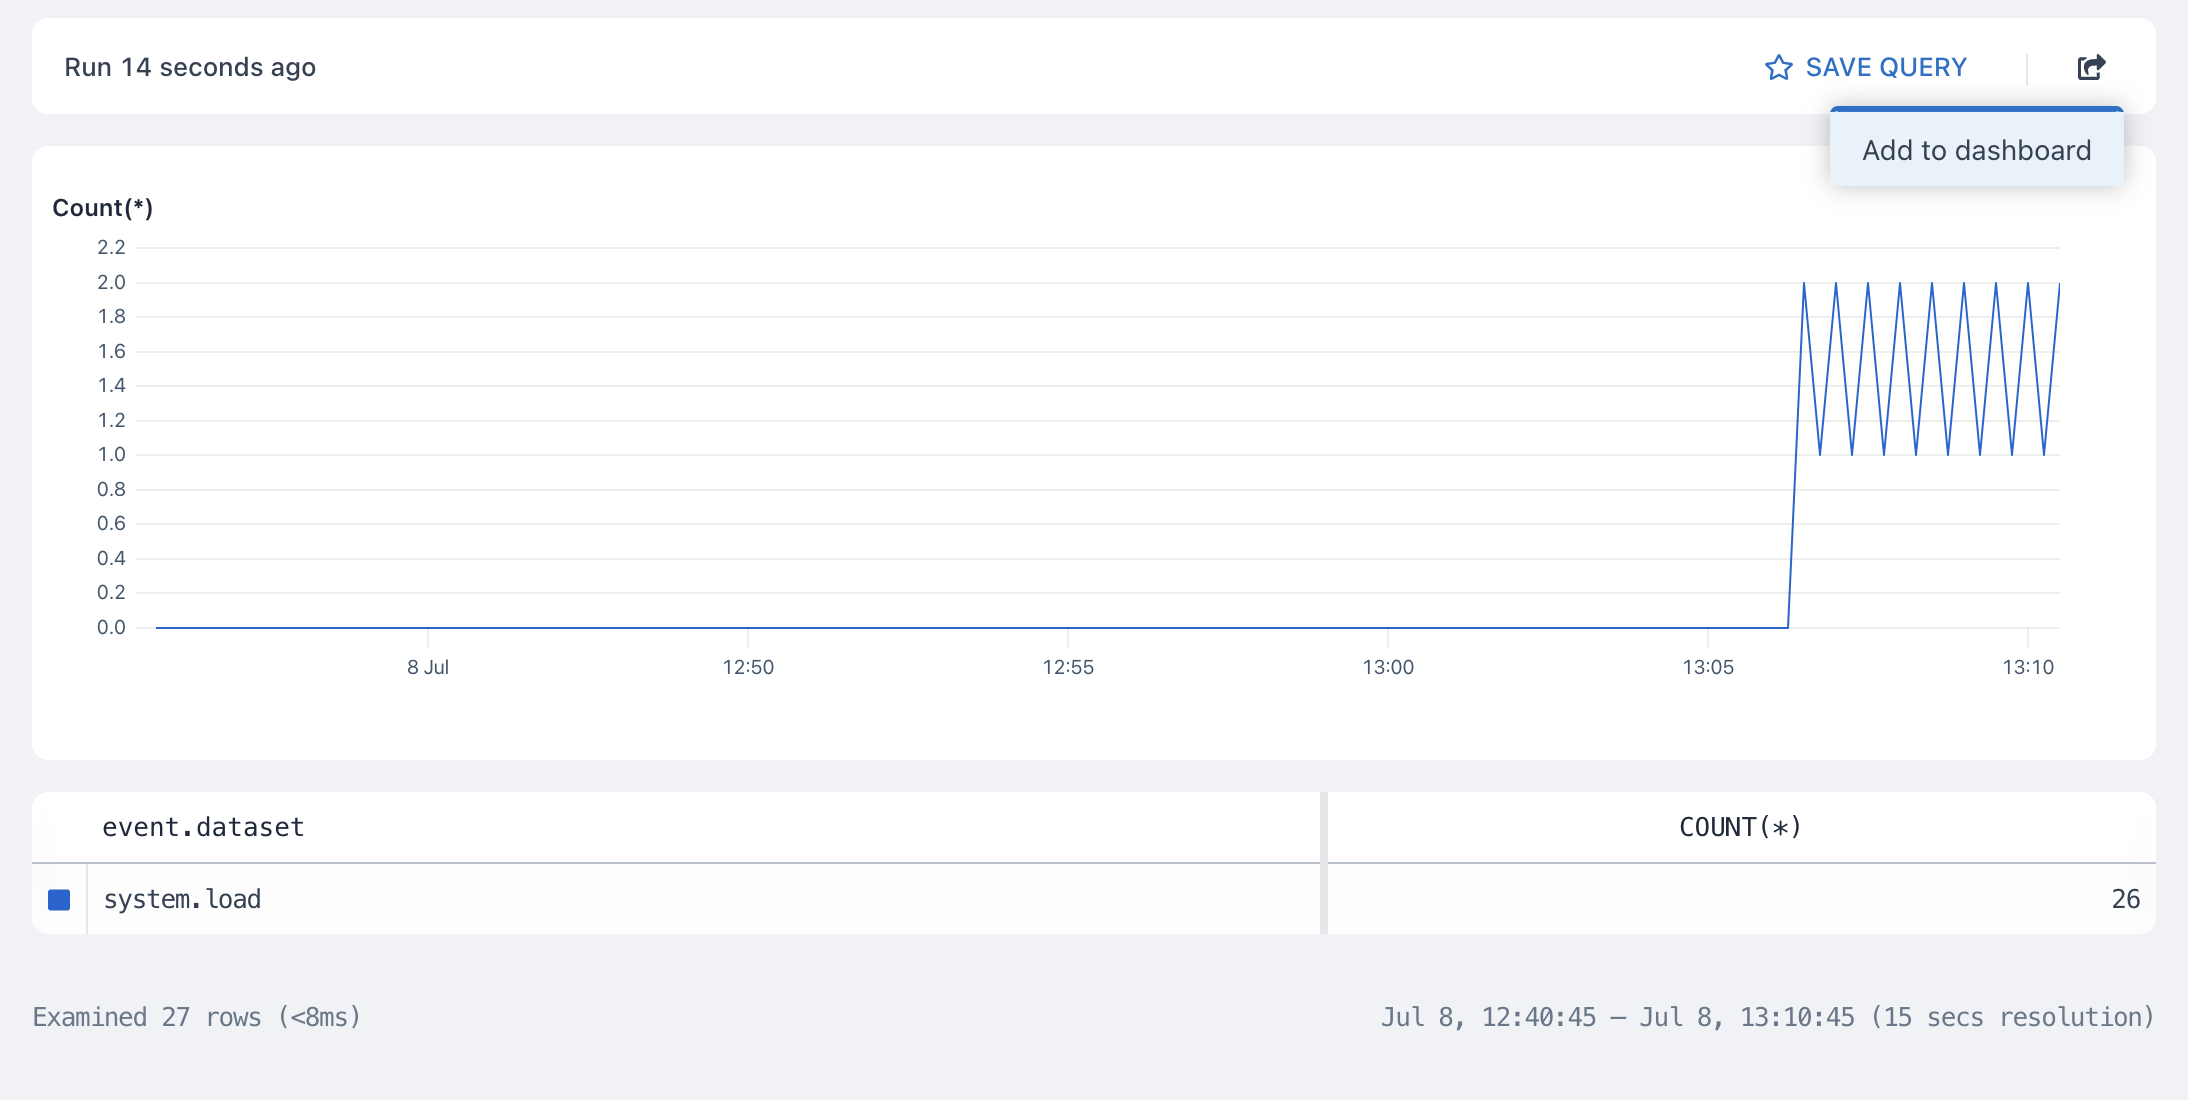
- Adding the visualization(s) from the Analytics tab by selecting the
Add to dashboardbutton. Adding your dashboard through this method lets you add a specific kind of Metricbeat and Elasticsearch virtualization from running the aggregation(s) you selected.
- Create a new Metricbeat dashboard by selecting the Dashboards feature:
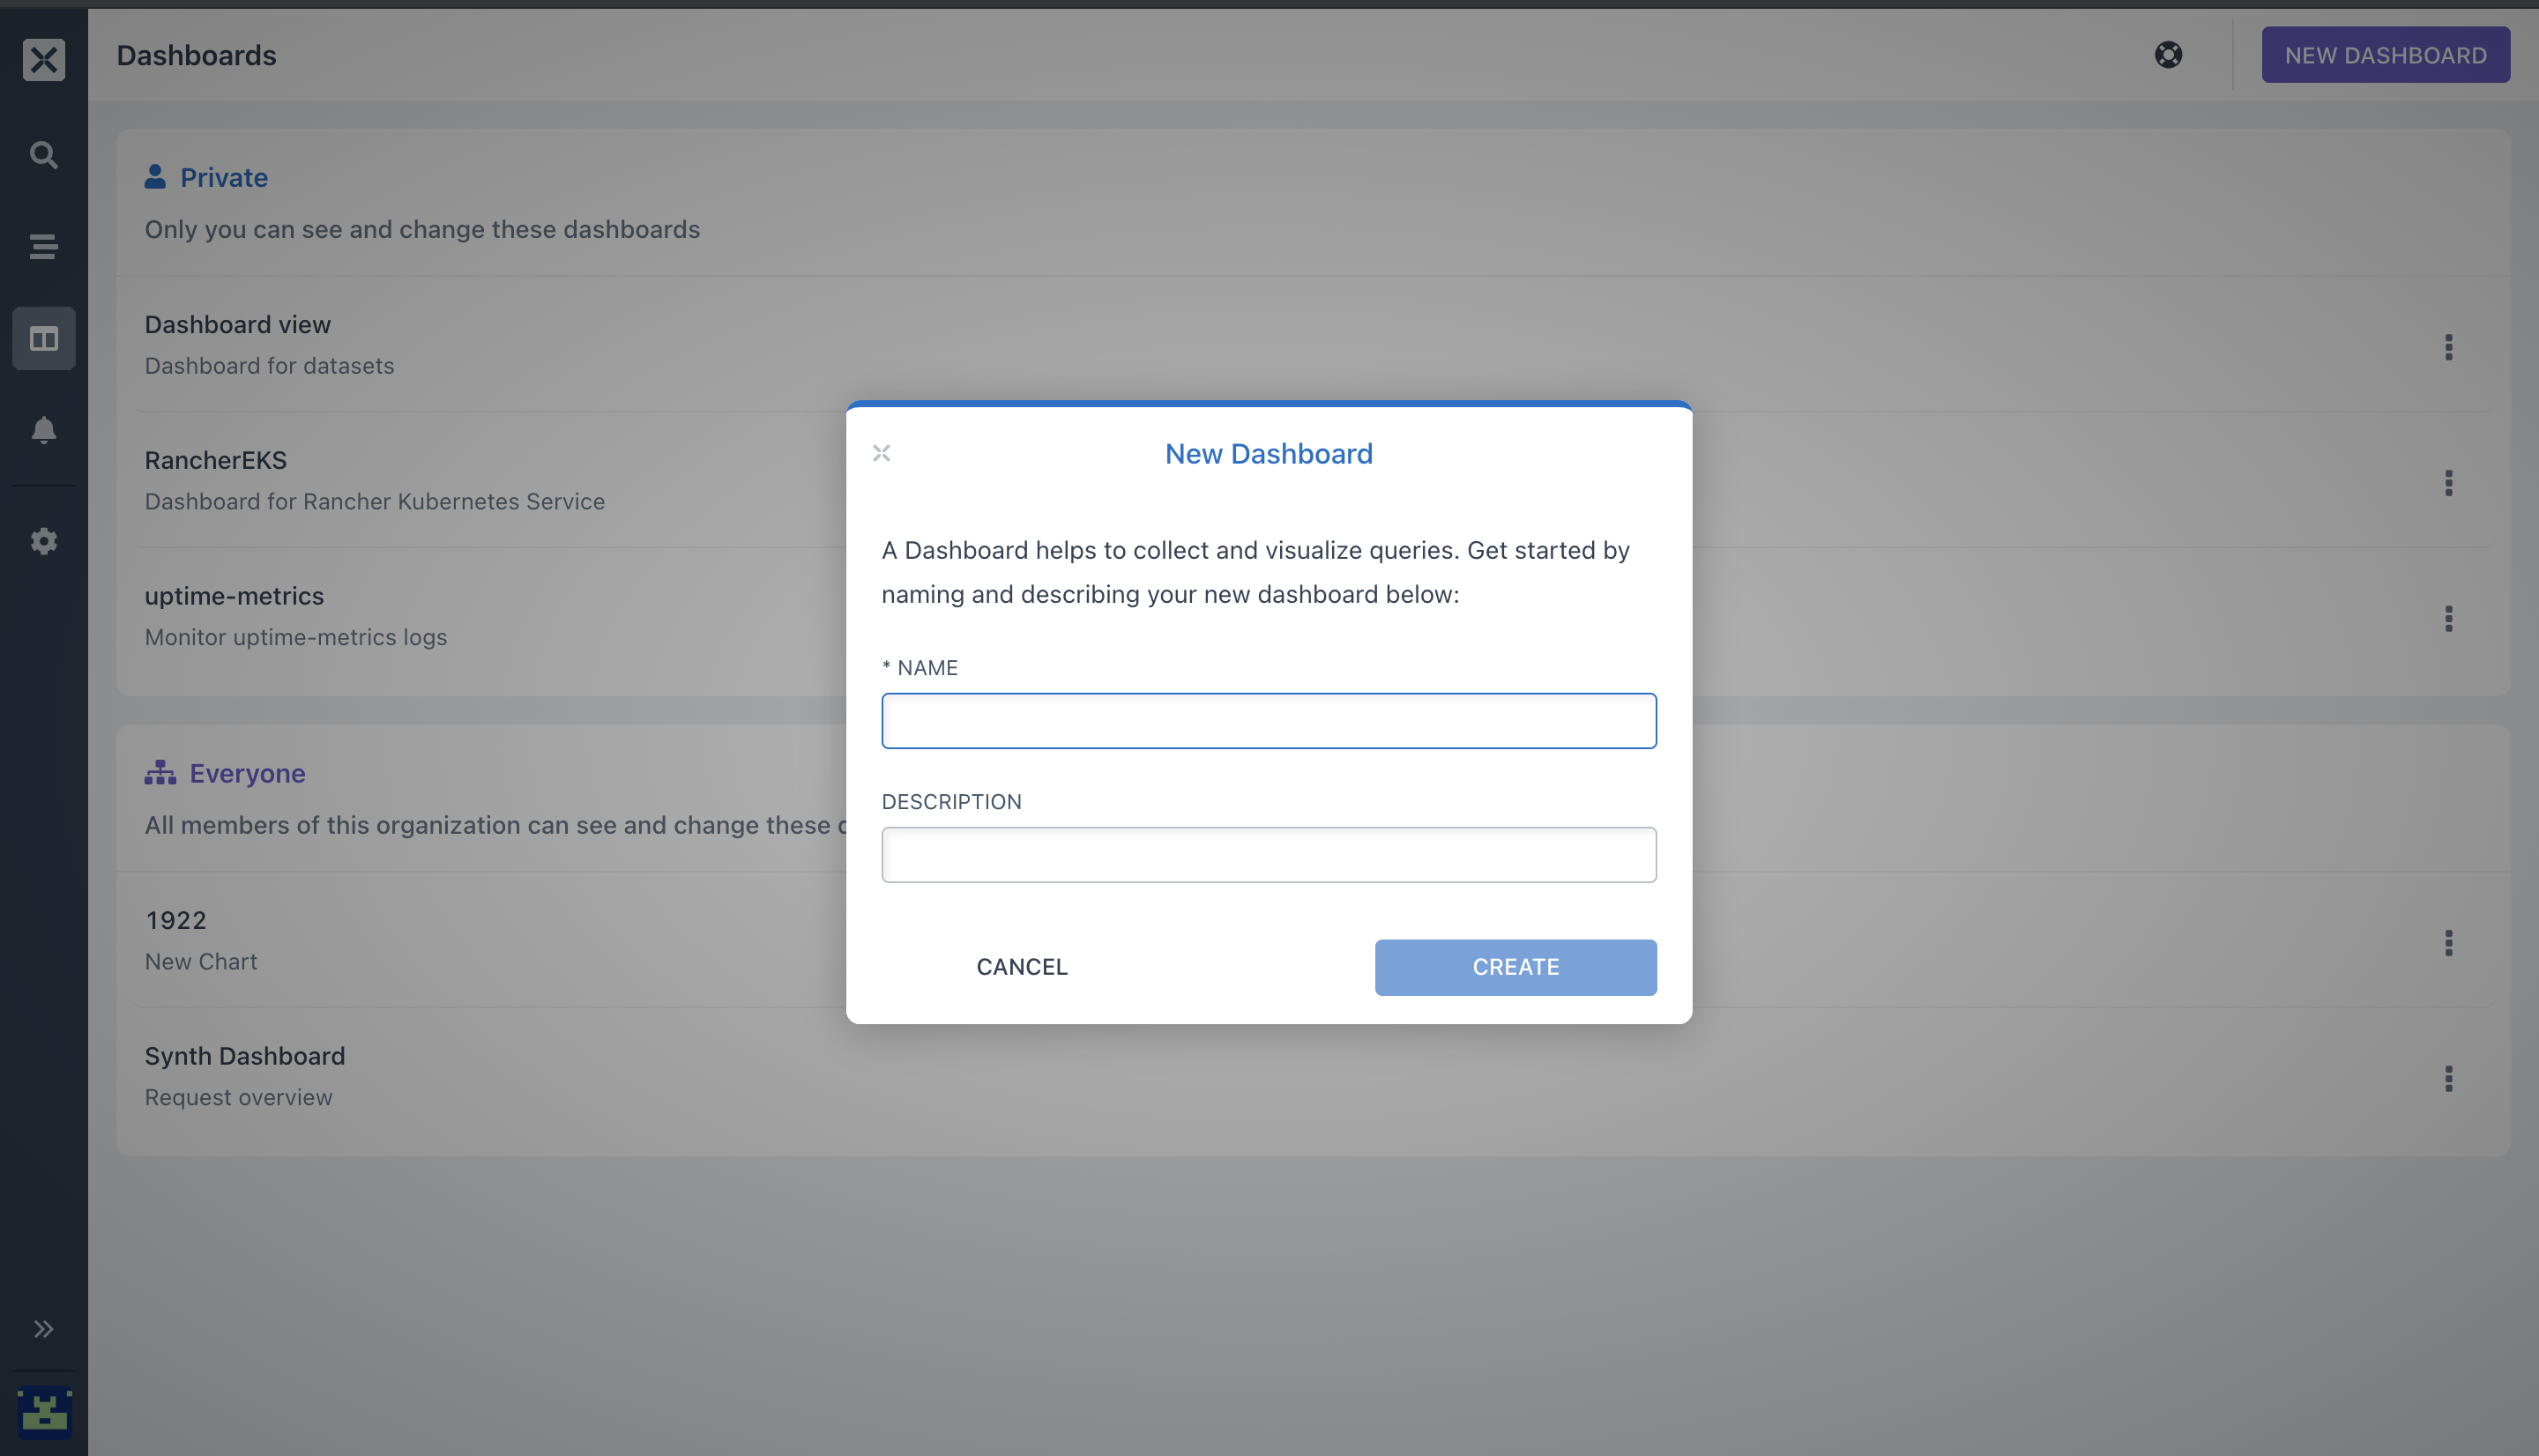
- You'll see a dialog that asks you for the
Nameand aDESCRIPTIONof your new dashboard:
- After creating the Dashboard, you will see the (+) button this will enable you to add your first charts to your dashboard. Click on it to build your first query. Your charts can be
Statistic ChartorTimeseries Chart.
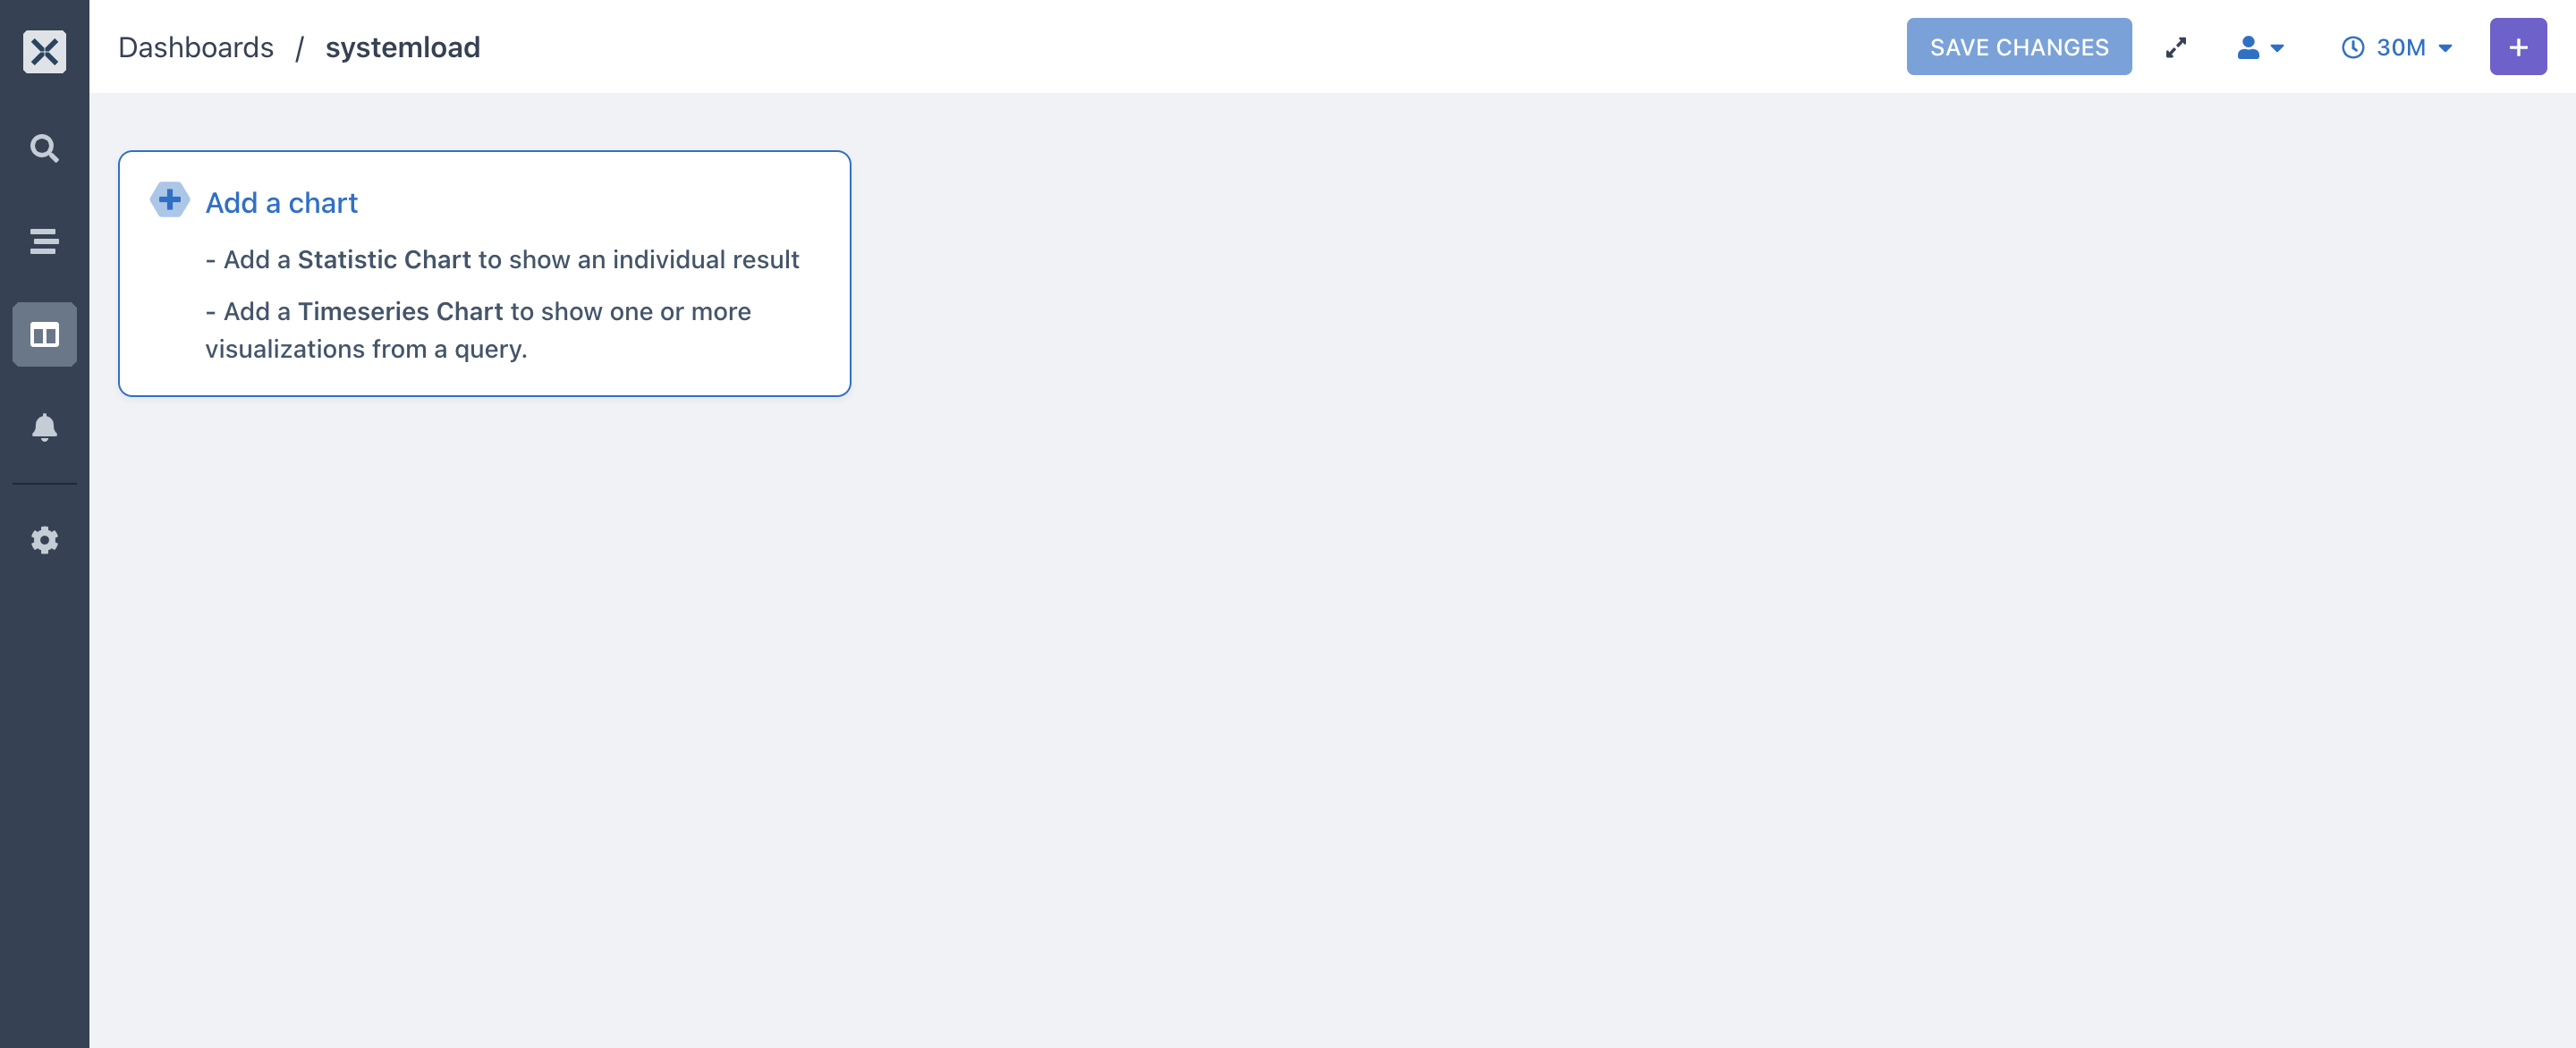
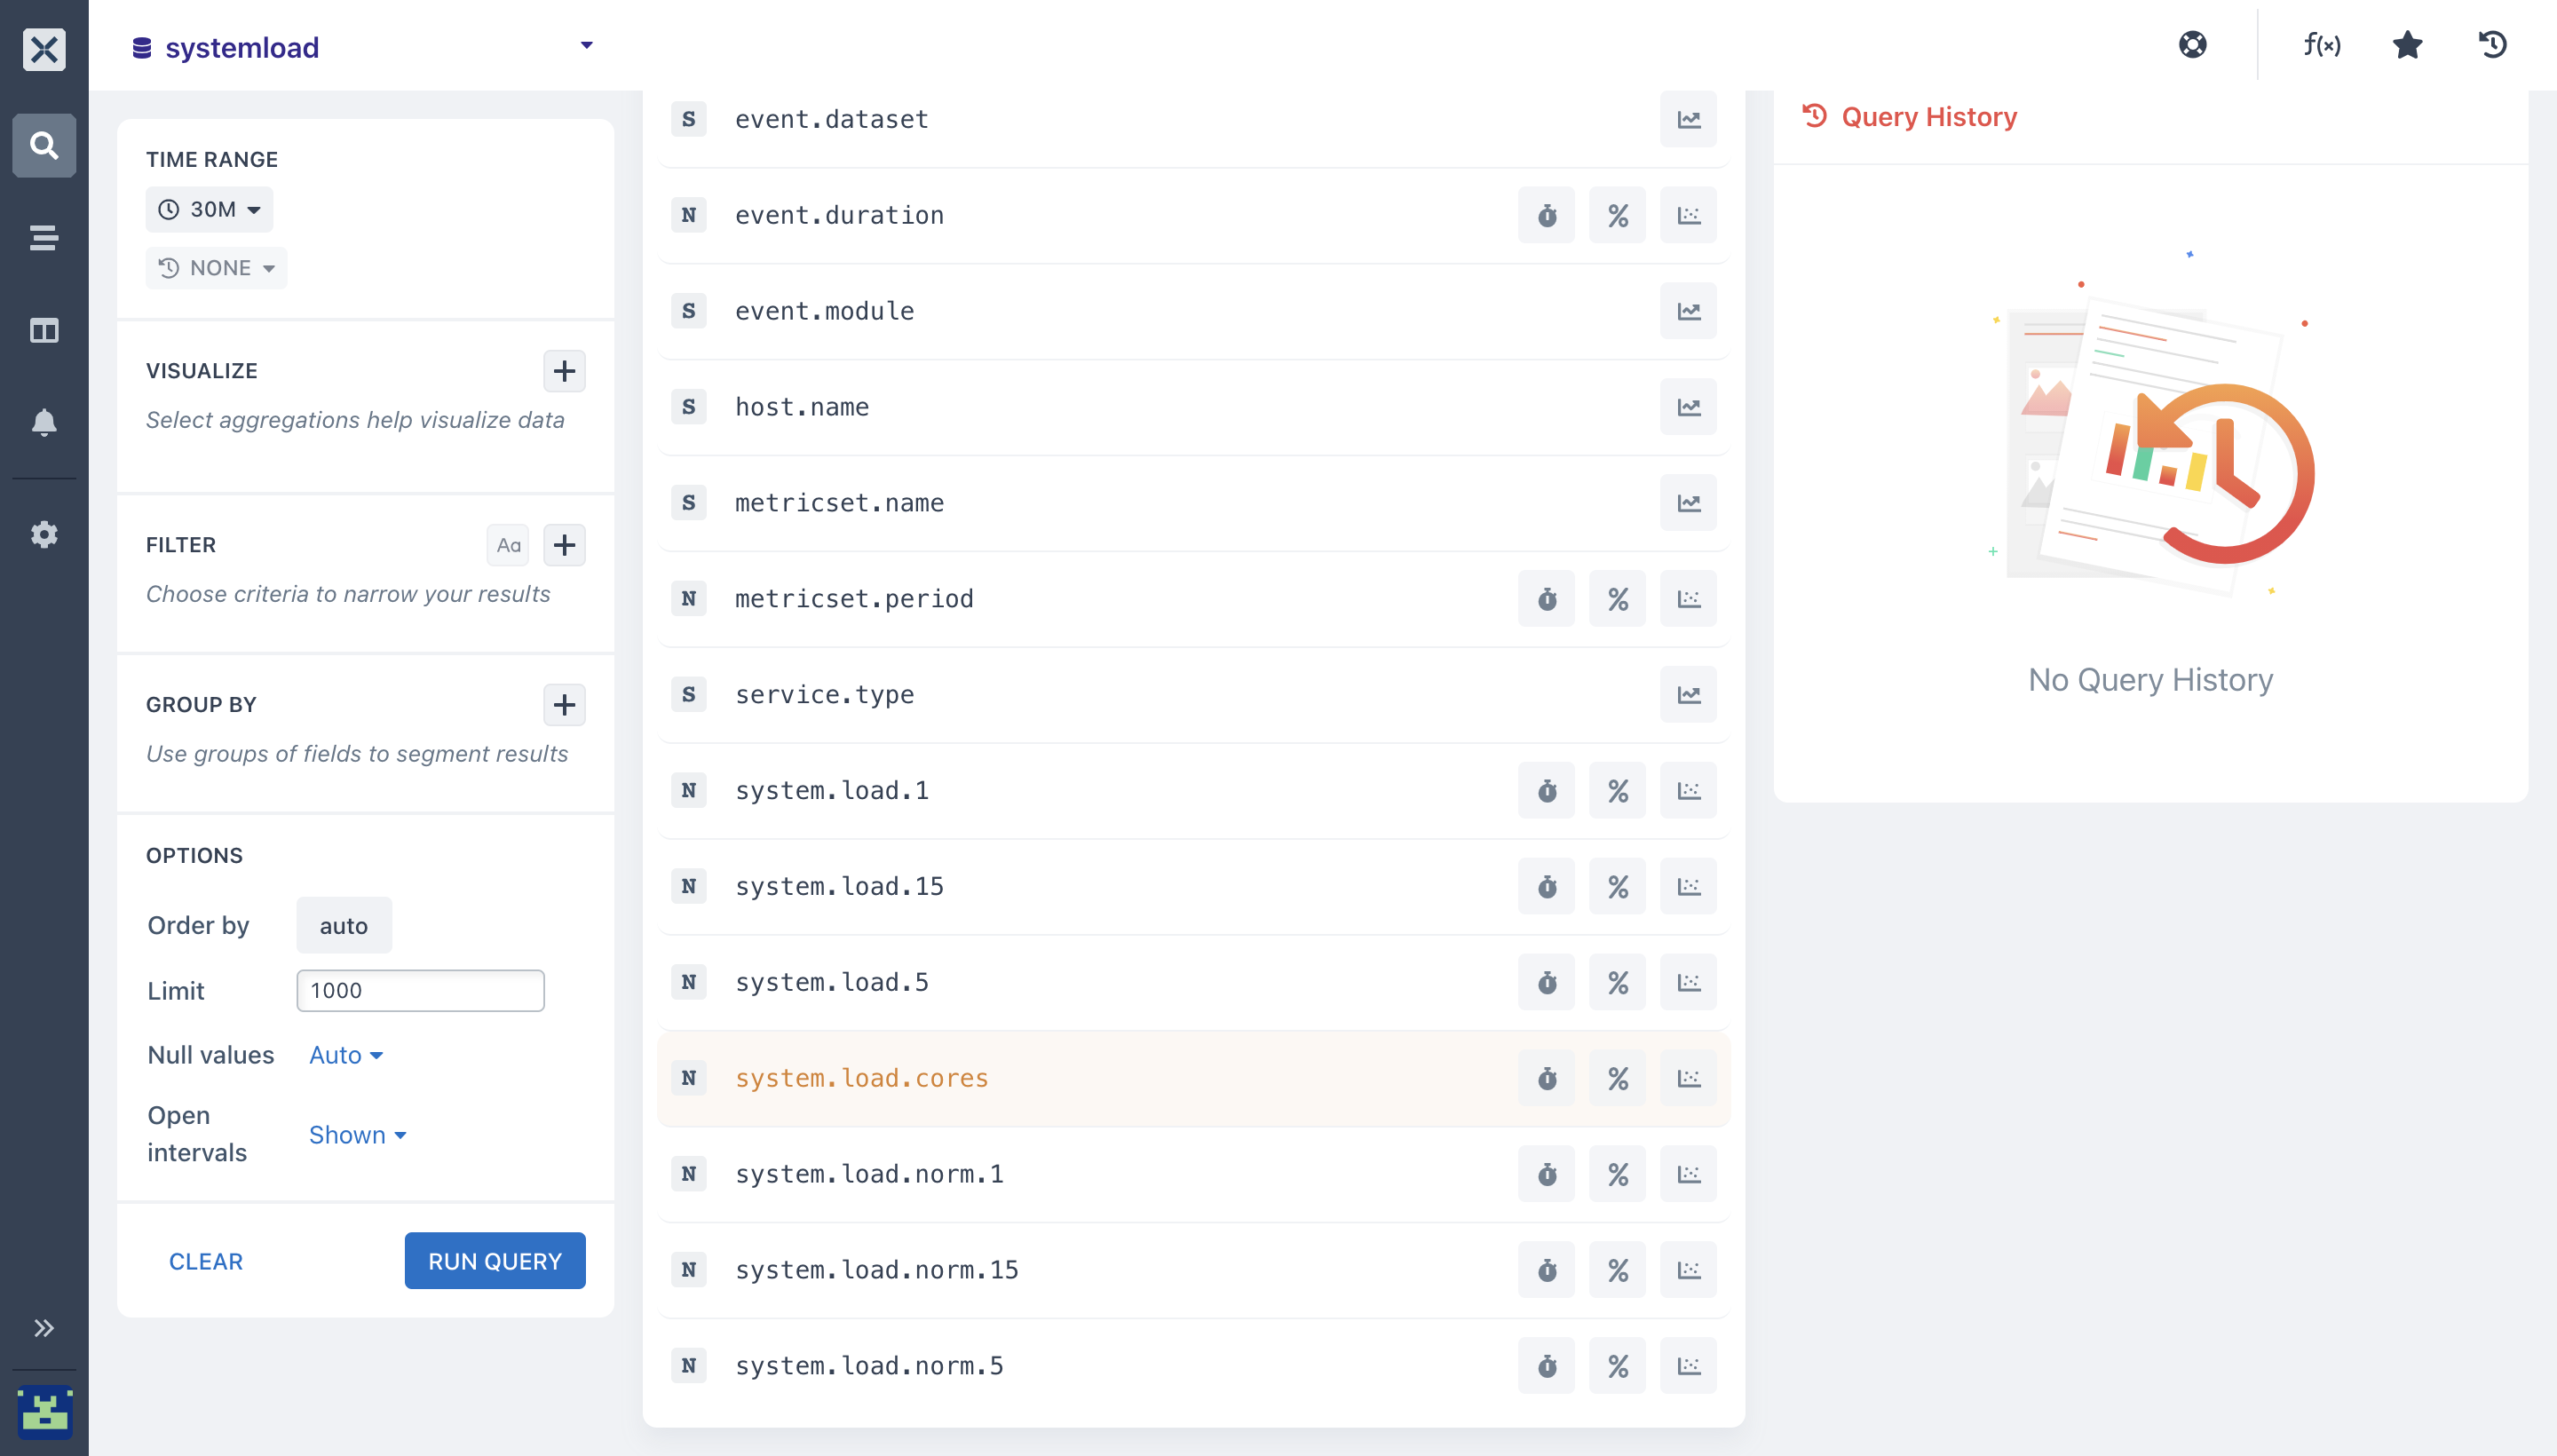
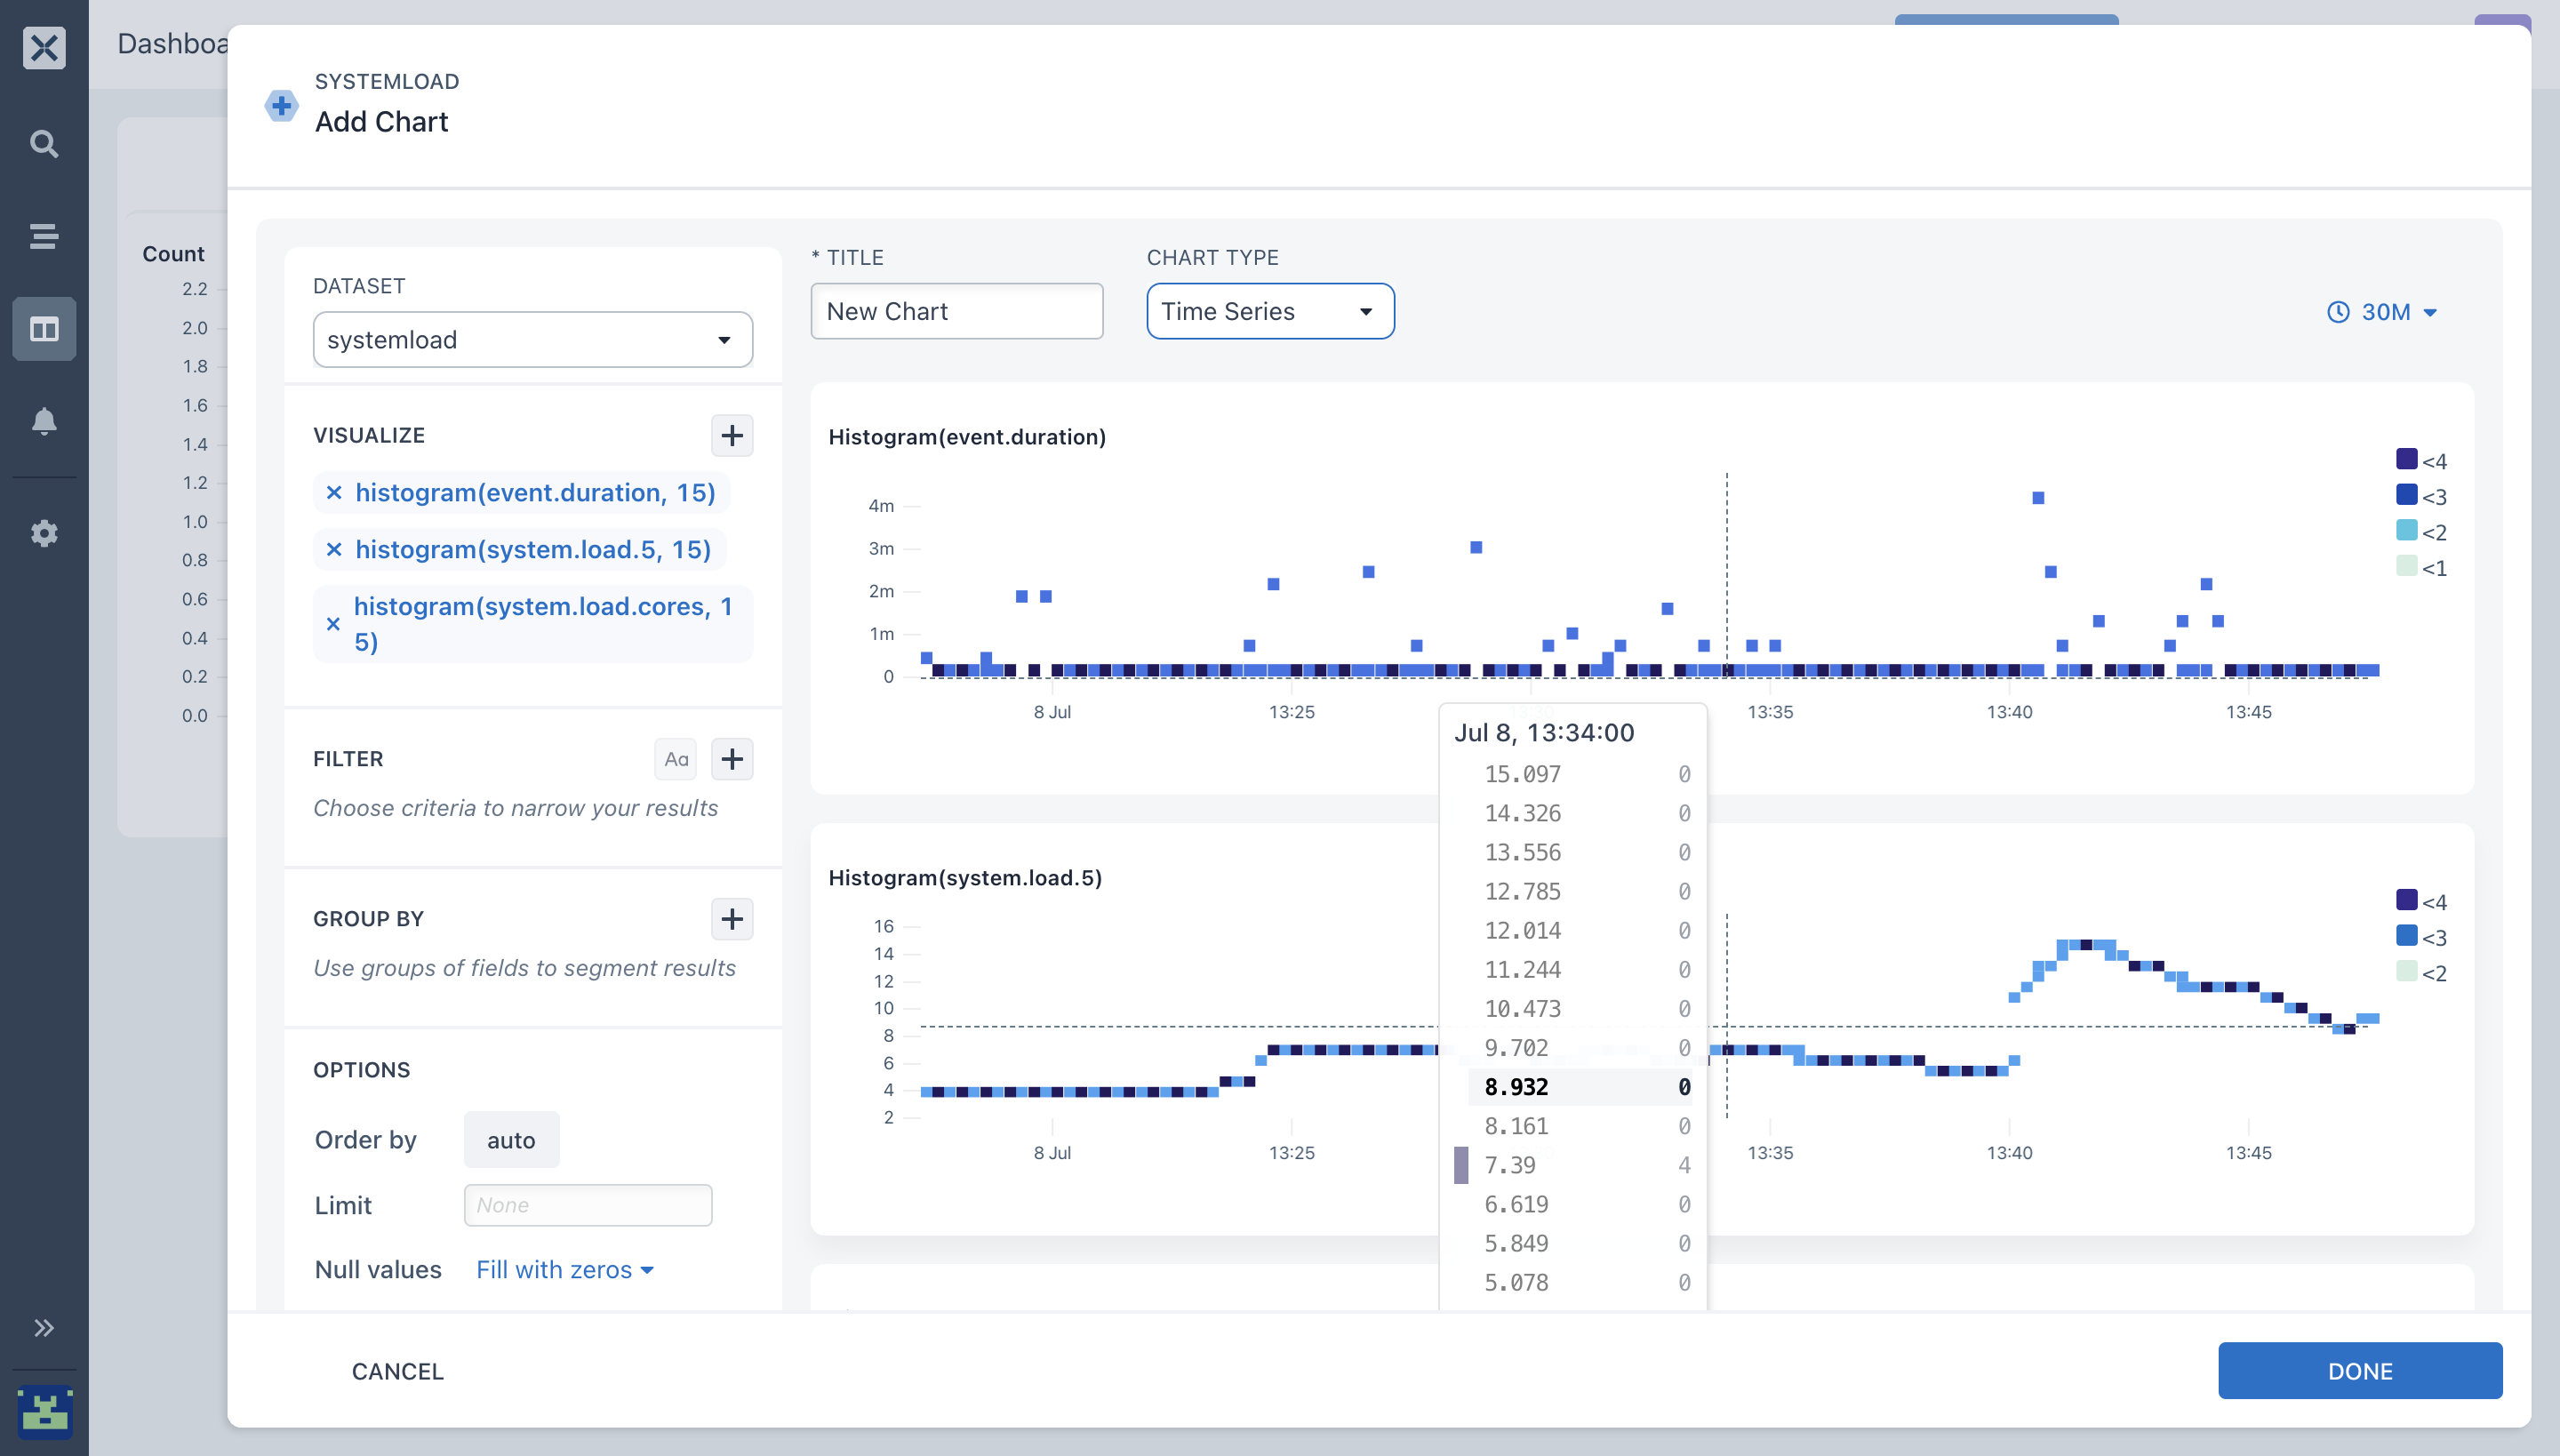
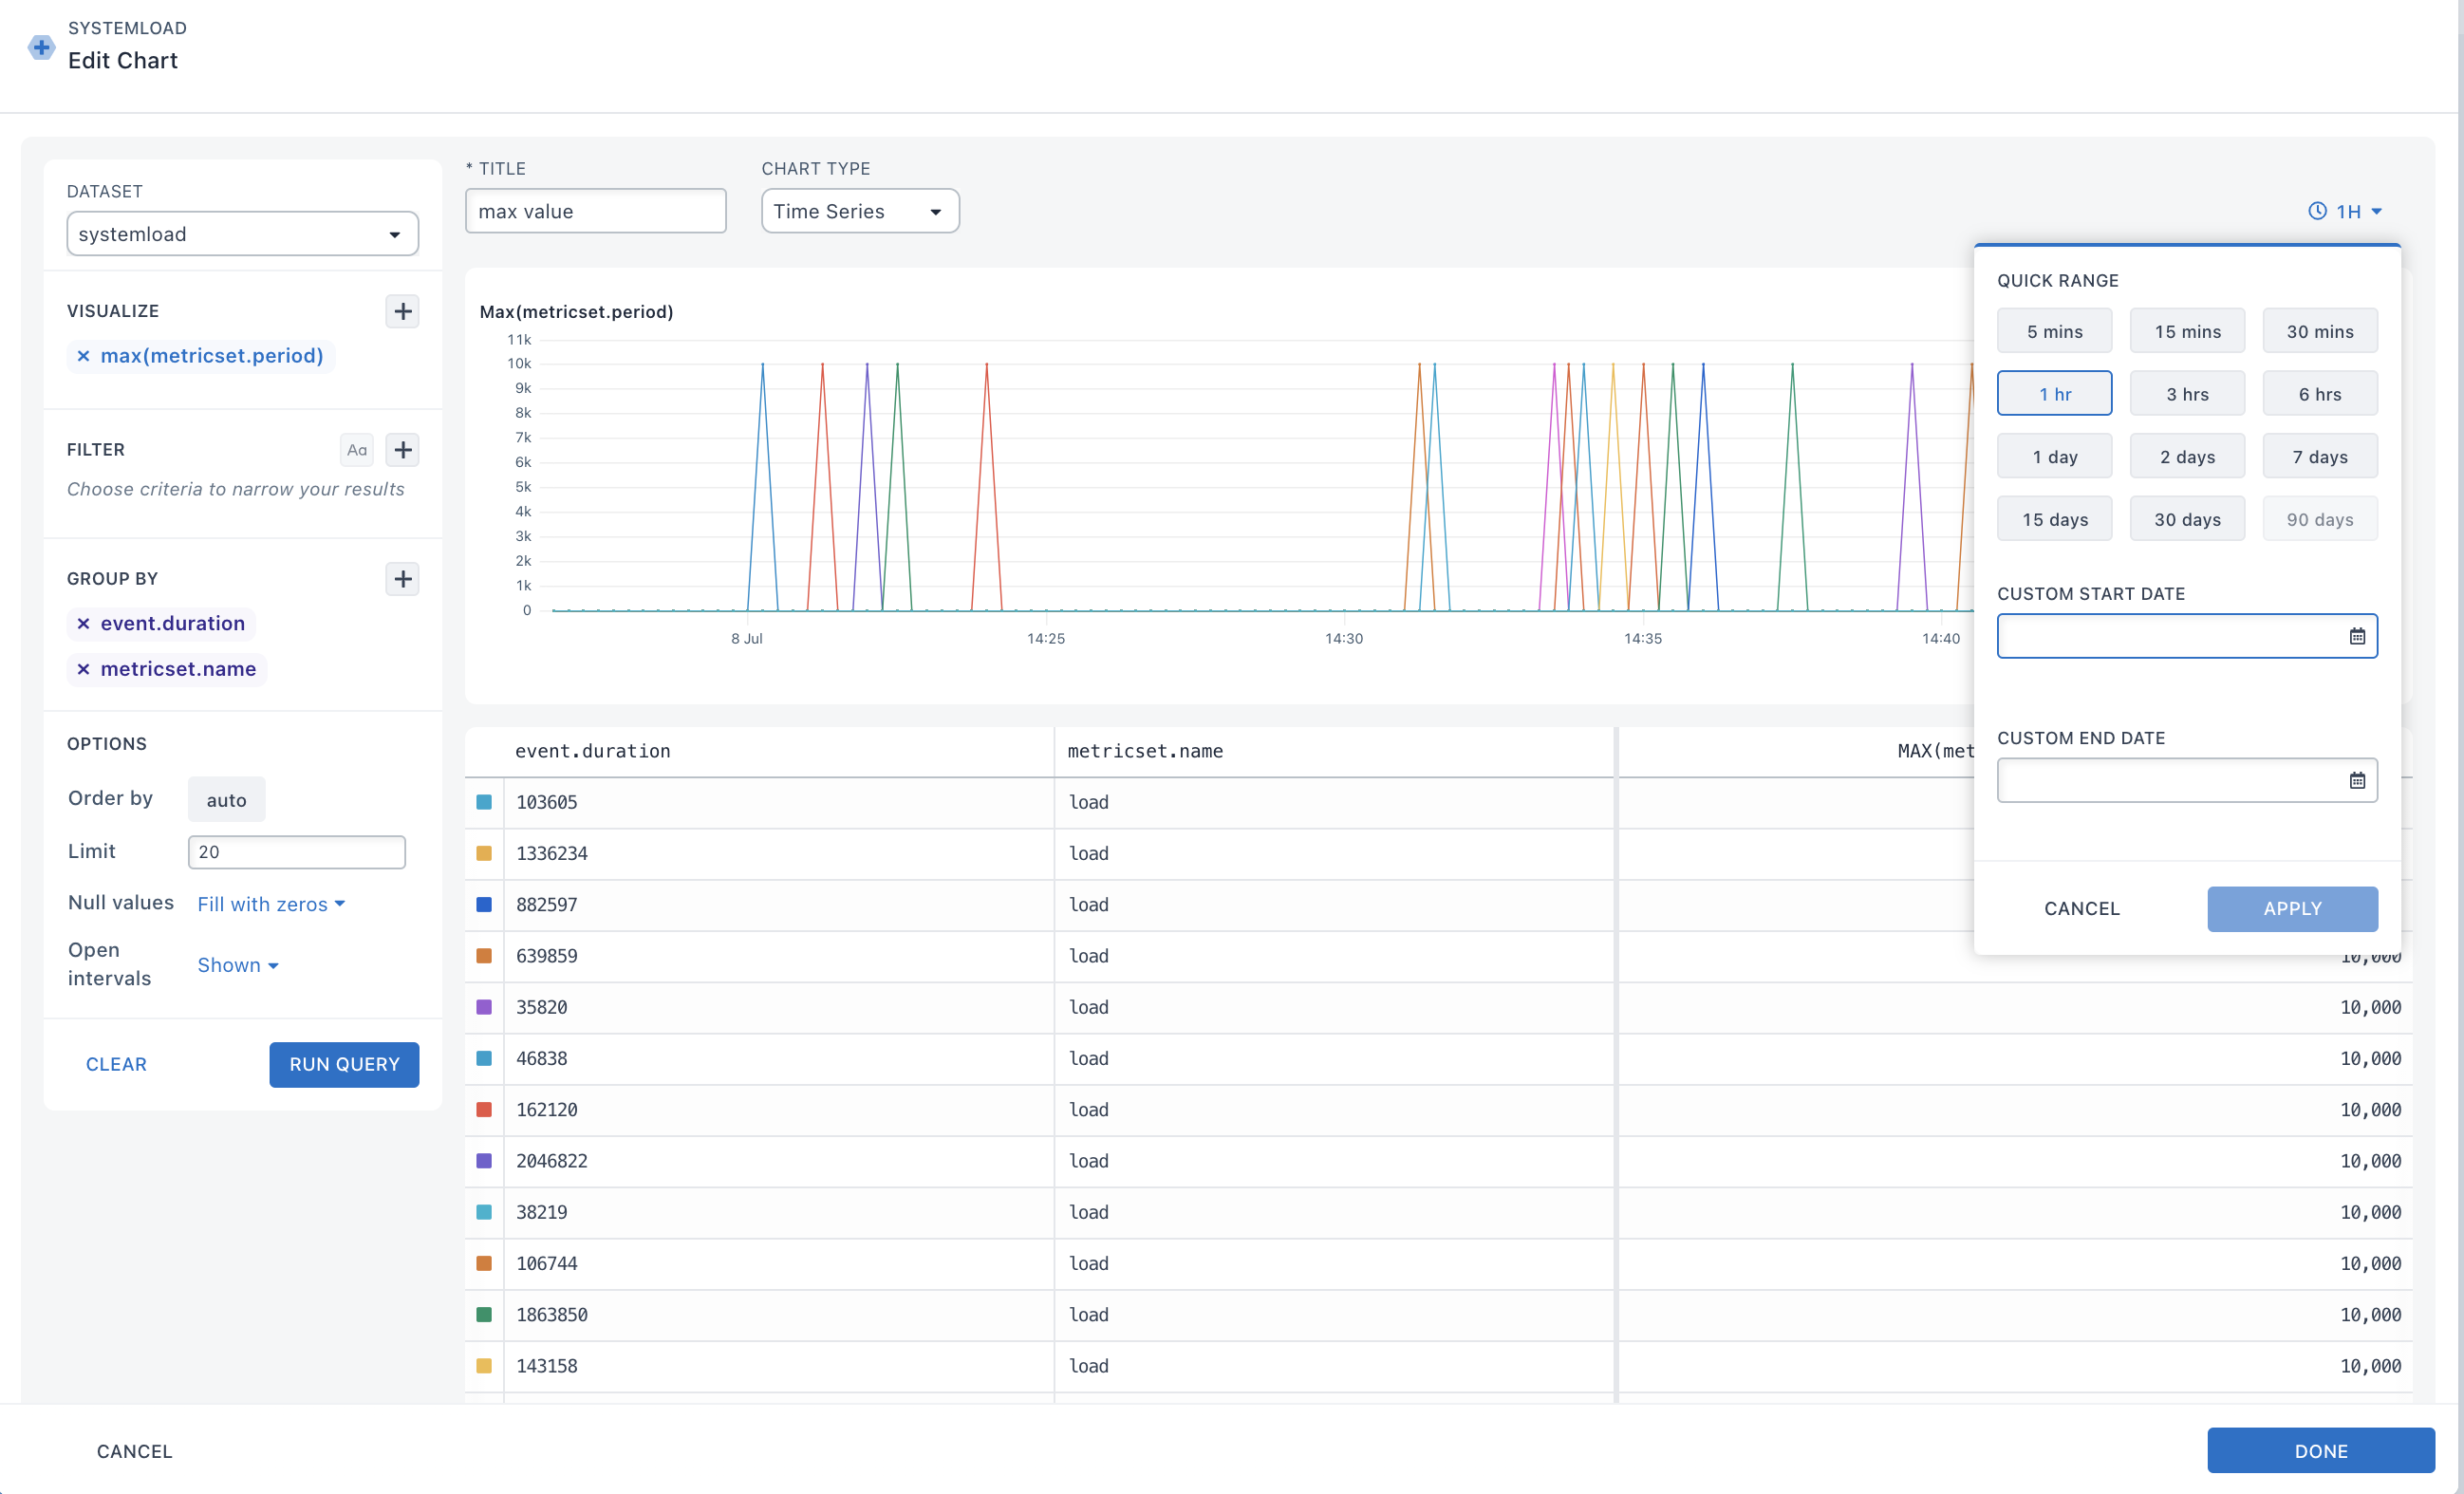
- To create a new chart for your Metricbeat dashboard, click on the (+) sign when you do so, the edit query slide-out dialog box will appear to begin the steps of creating charts, queries, and graphs for your System load metrics.
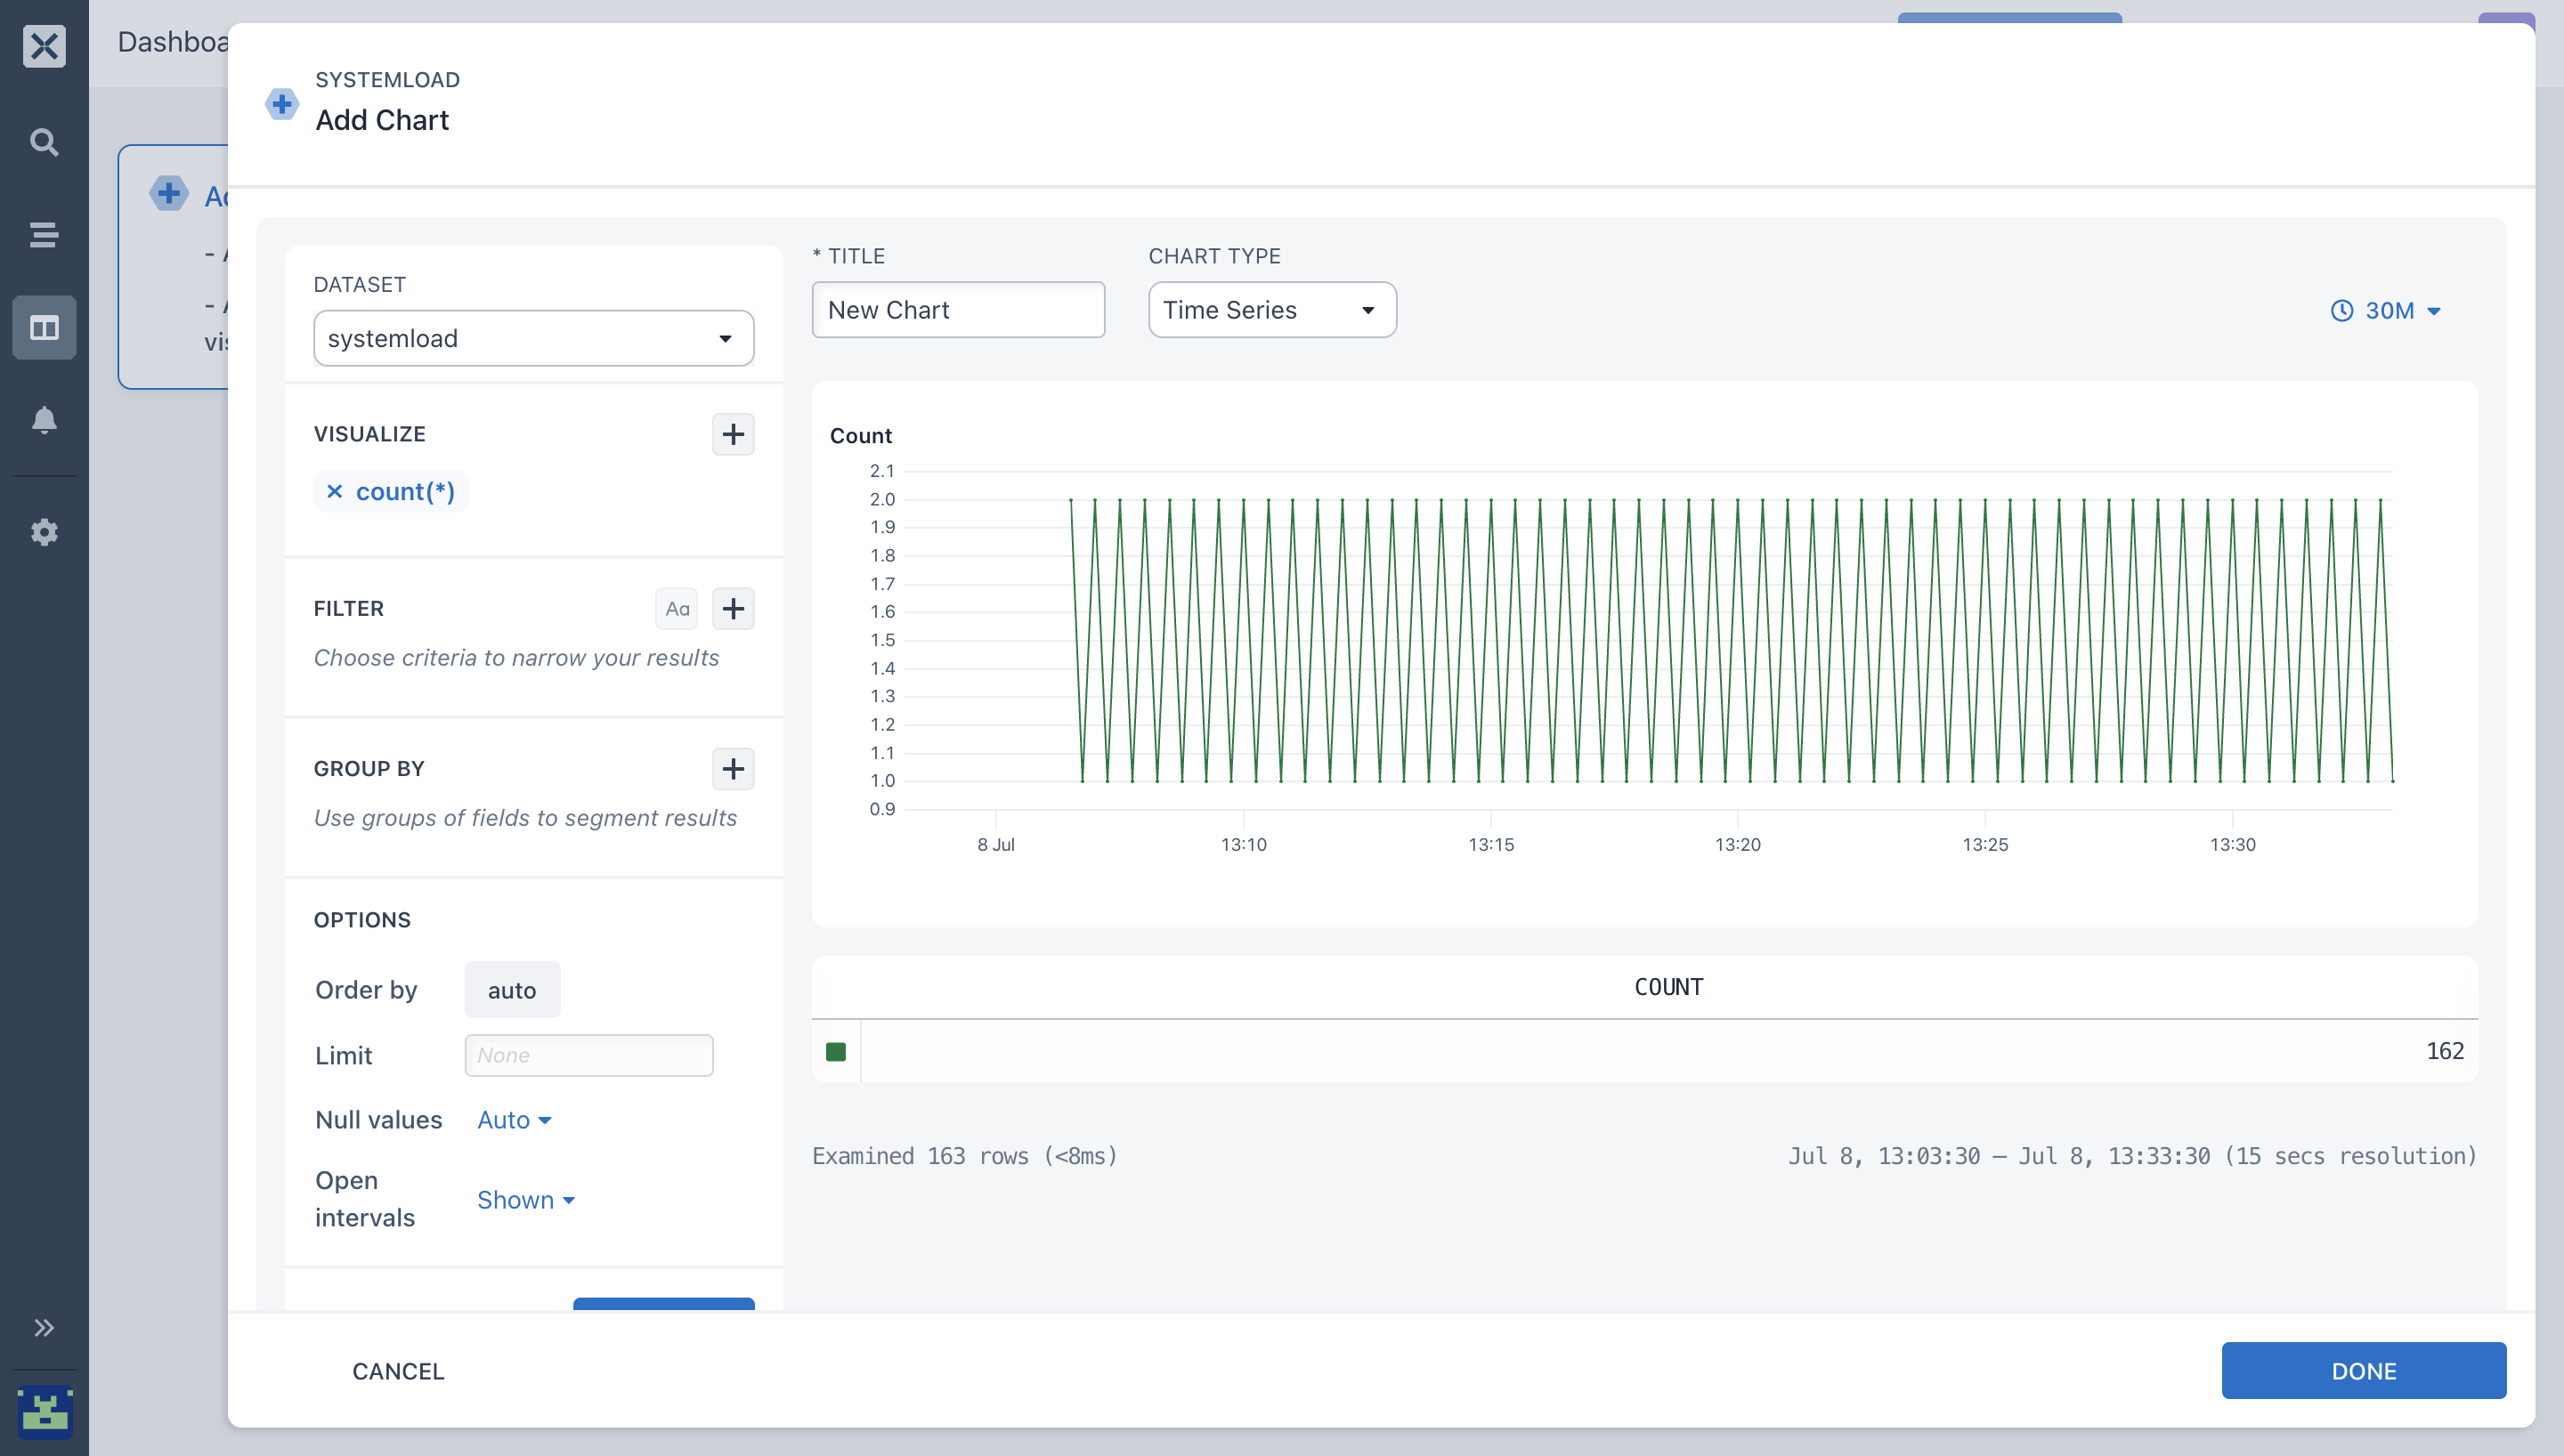
- Select your system Metricbeat elastic stack dataset you created in step 2.
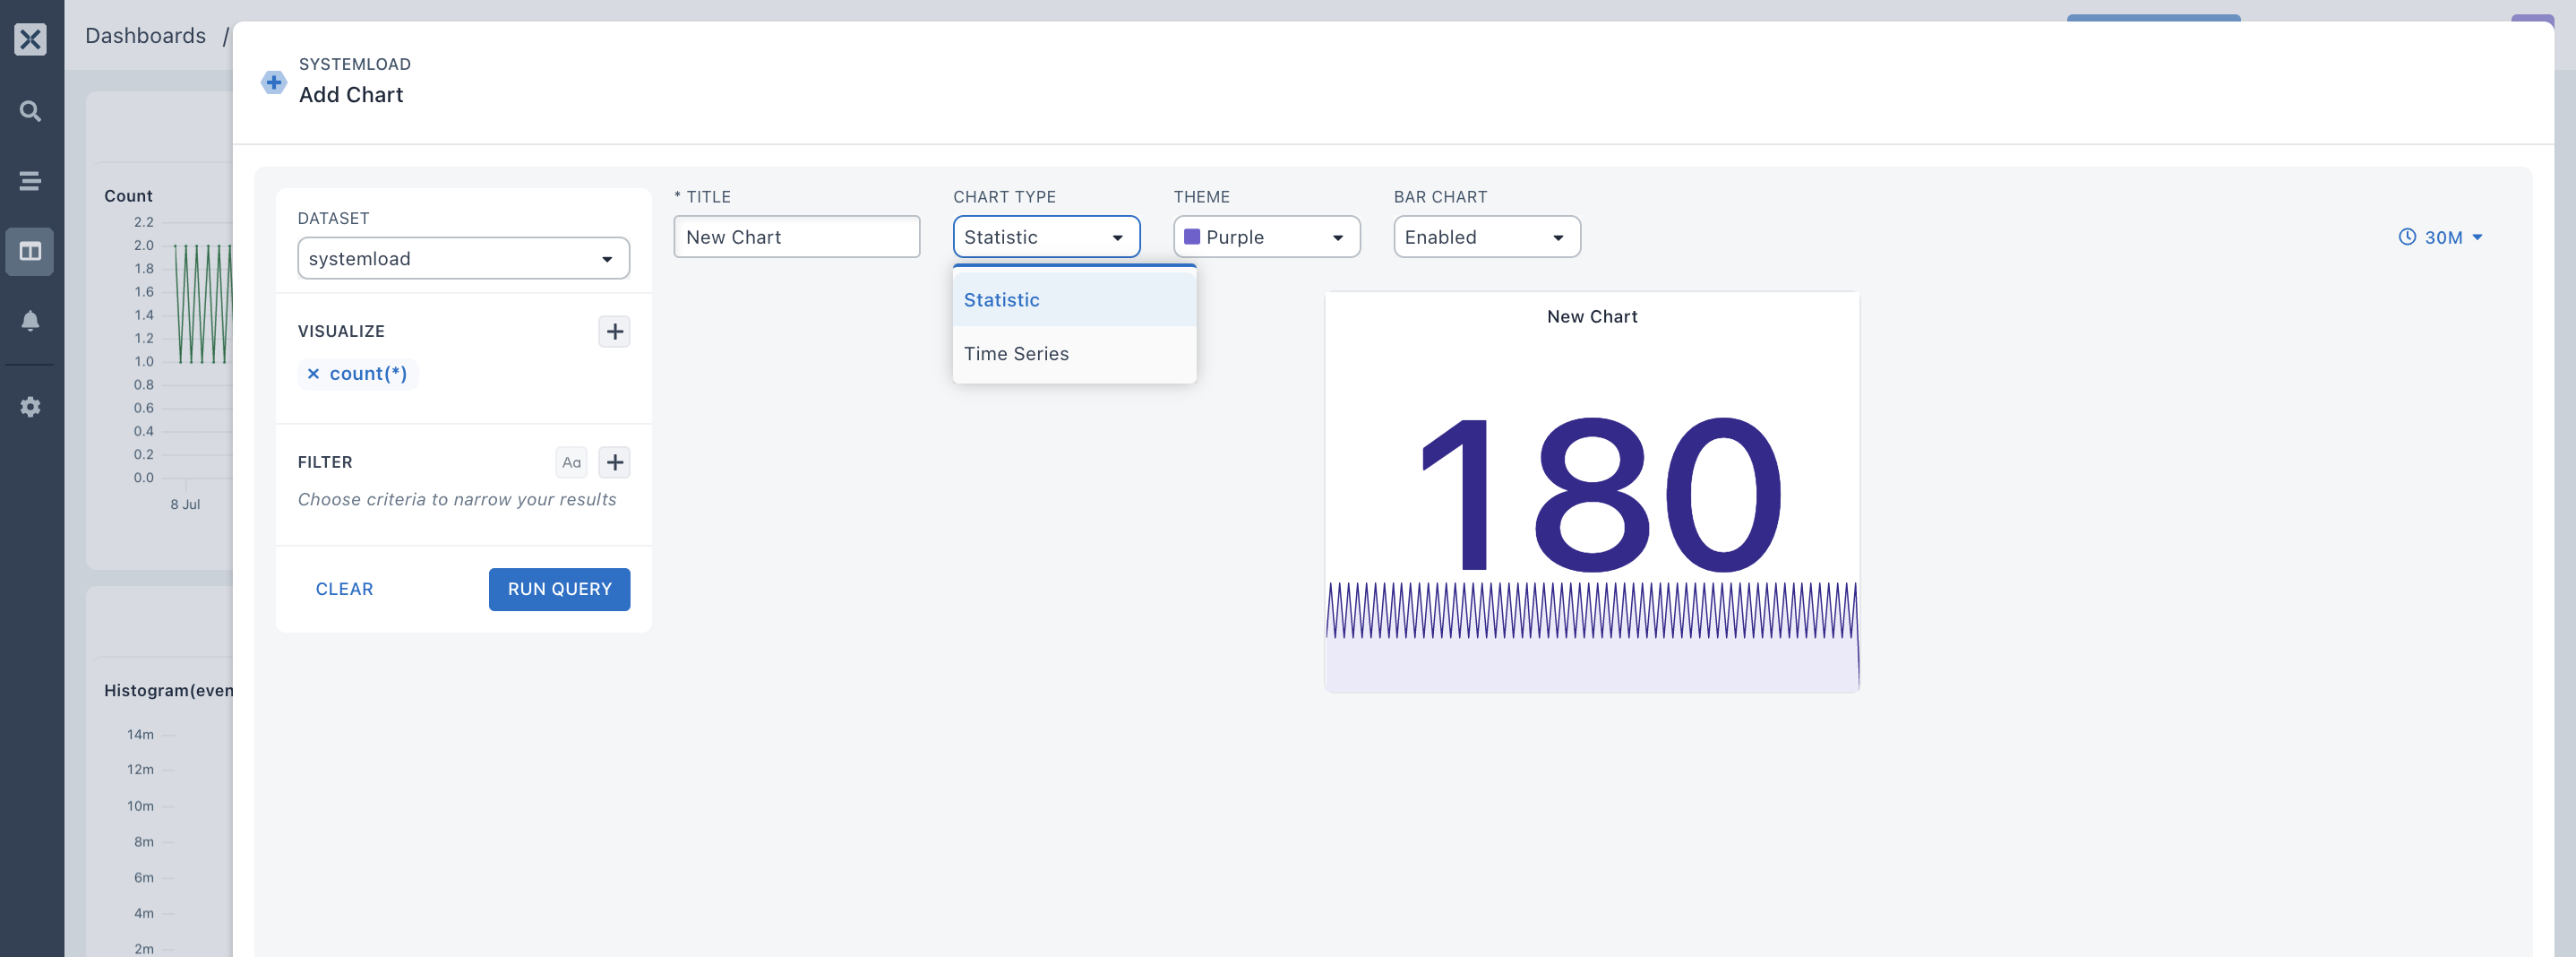
- Choose the specific visualization (avg, sum, count, etc.) you want to see charts:
- Here, I selected the
count()aggregation to count all matching events in the Metricbeat systemload dataset. - After selecting your aggregation, click on DONE.
- Add more charts to your Metricbeat dashboard. Computing more charts from your
system load datasetlets you understand how your system performs in a single pane of glass.
- With this, you can also figure out faults and get an overview of when your load Metricbeat metrics have gotten to the peak.

- You can resize and move your charts after adding them by hovering your cursor on the bottom edge of on your chart. This makes sharing easy and lets everyone in your team know when changes are made and diagnose day-to-day complications quickly when they occur.
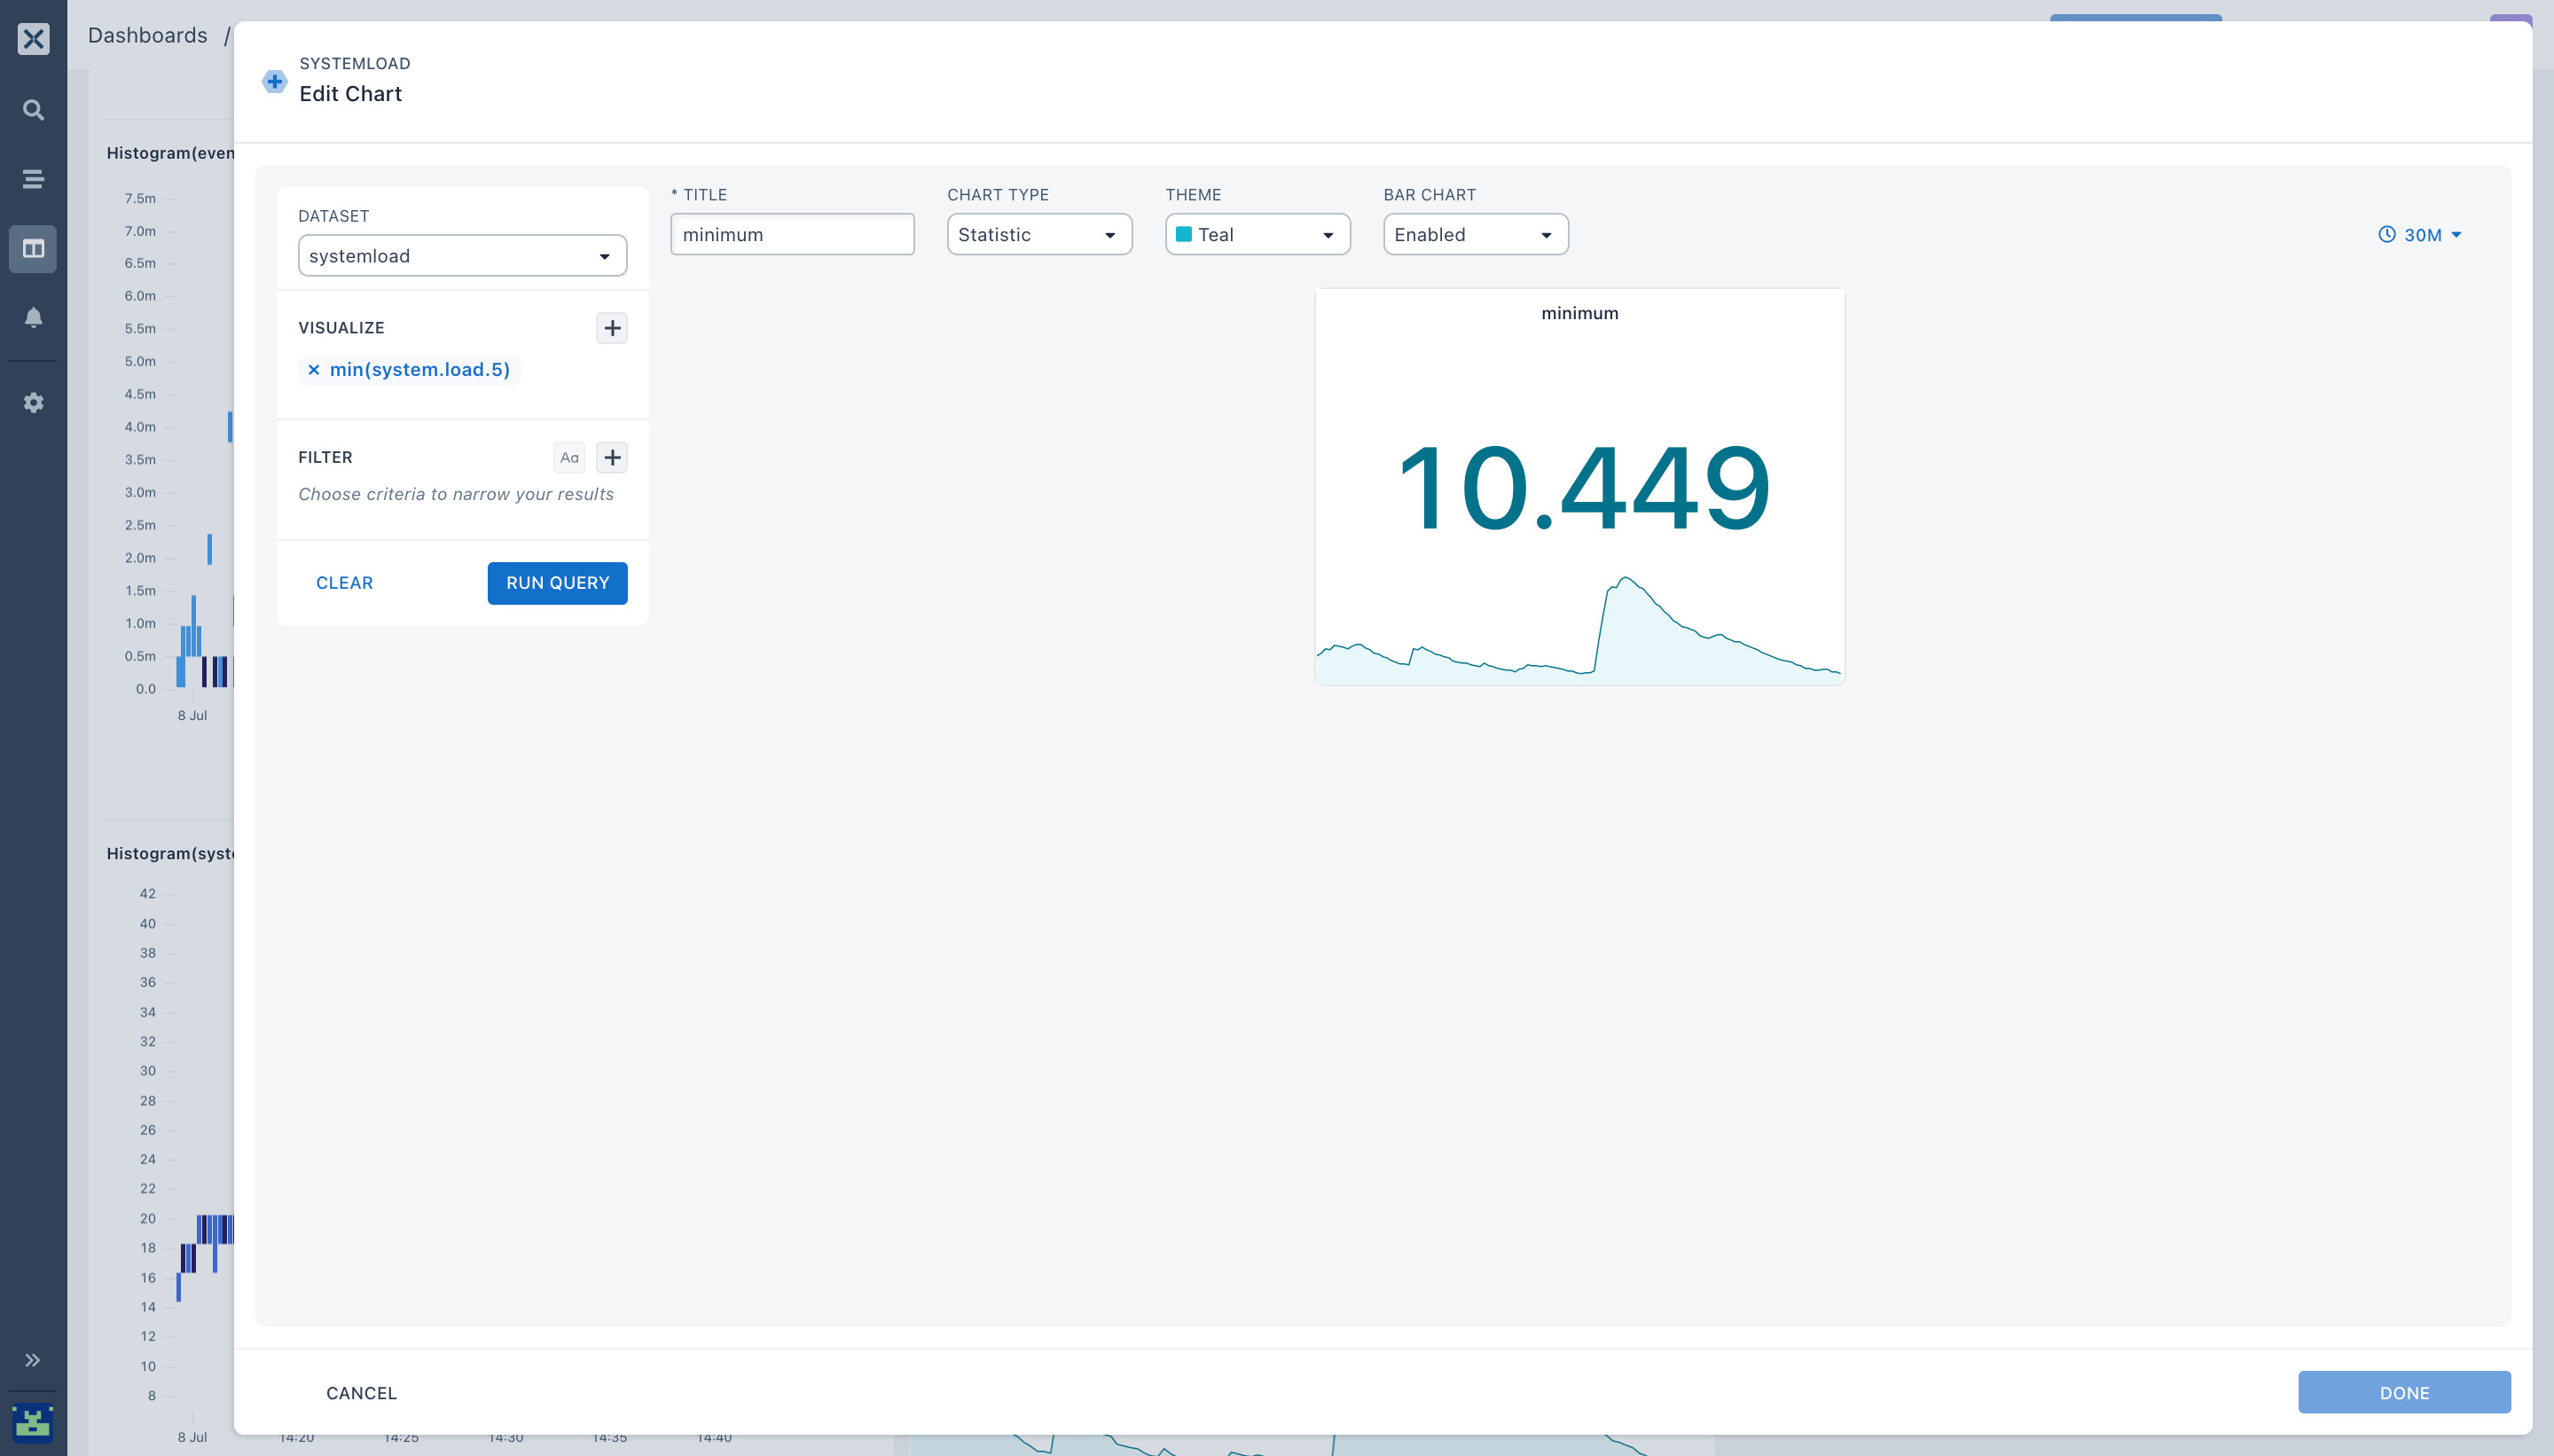
- You can change your CHART TYPE to
Statistic. The Statistic chart lets you represent your charts and box plots in a number format.
With the Statistic chart, you can:
- Get the specific Metricbeat value for your average system load from your
numeric field.
- Get the minimum Metricbeat value when an uptime or downtime occurs.
- You can adjust the Metricbeat
time intervalto precisely visualize what happened on your system load metrics ( an hour, three hours before, 7 days ago, or 30 days ago.)
After adding all your charts and statistics you can see all your visualizations in a single pane glass view
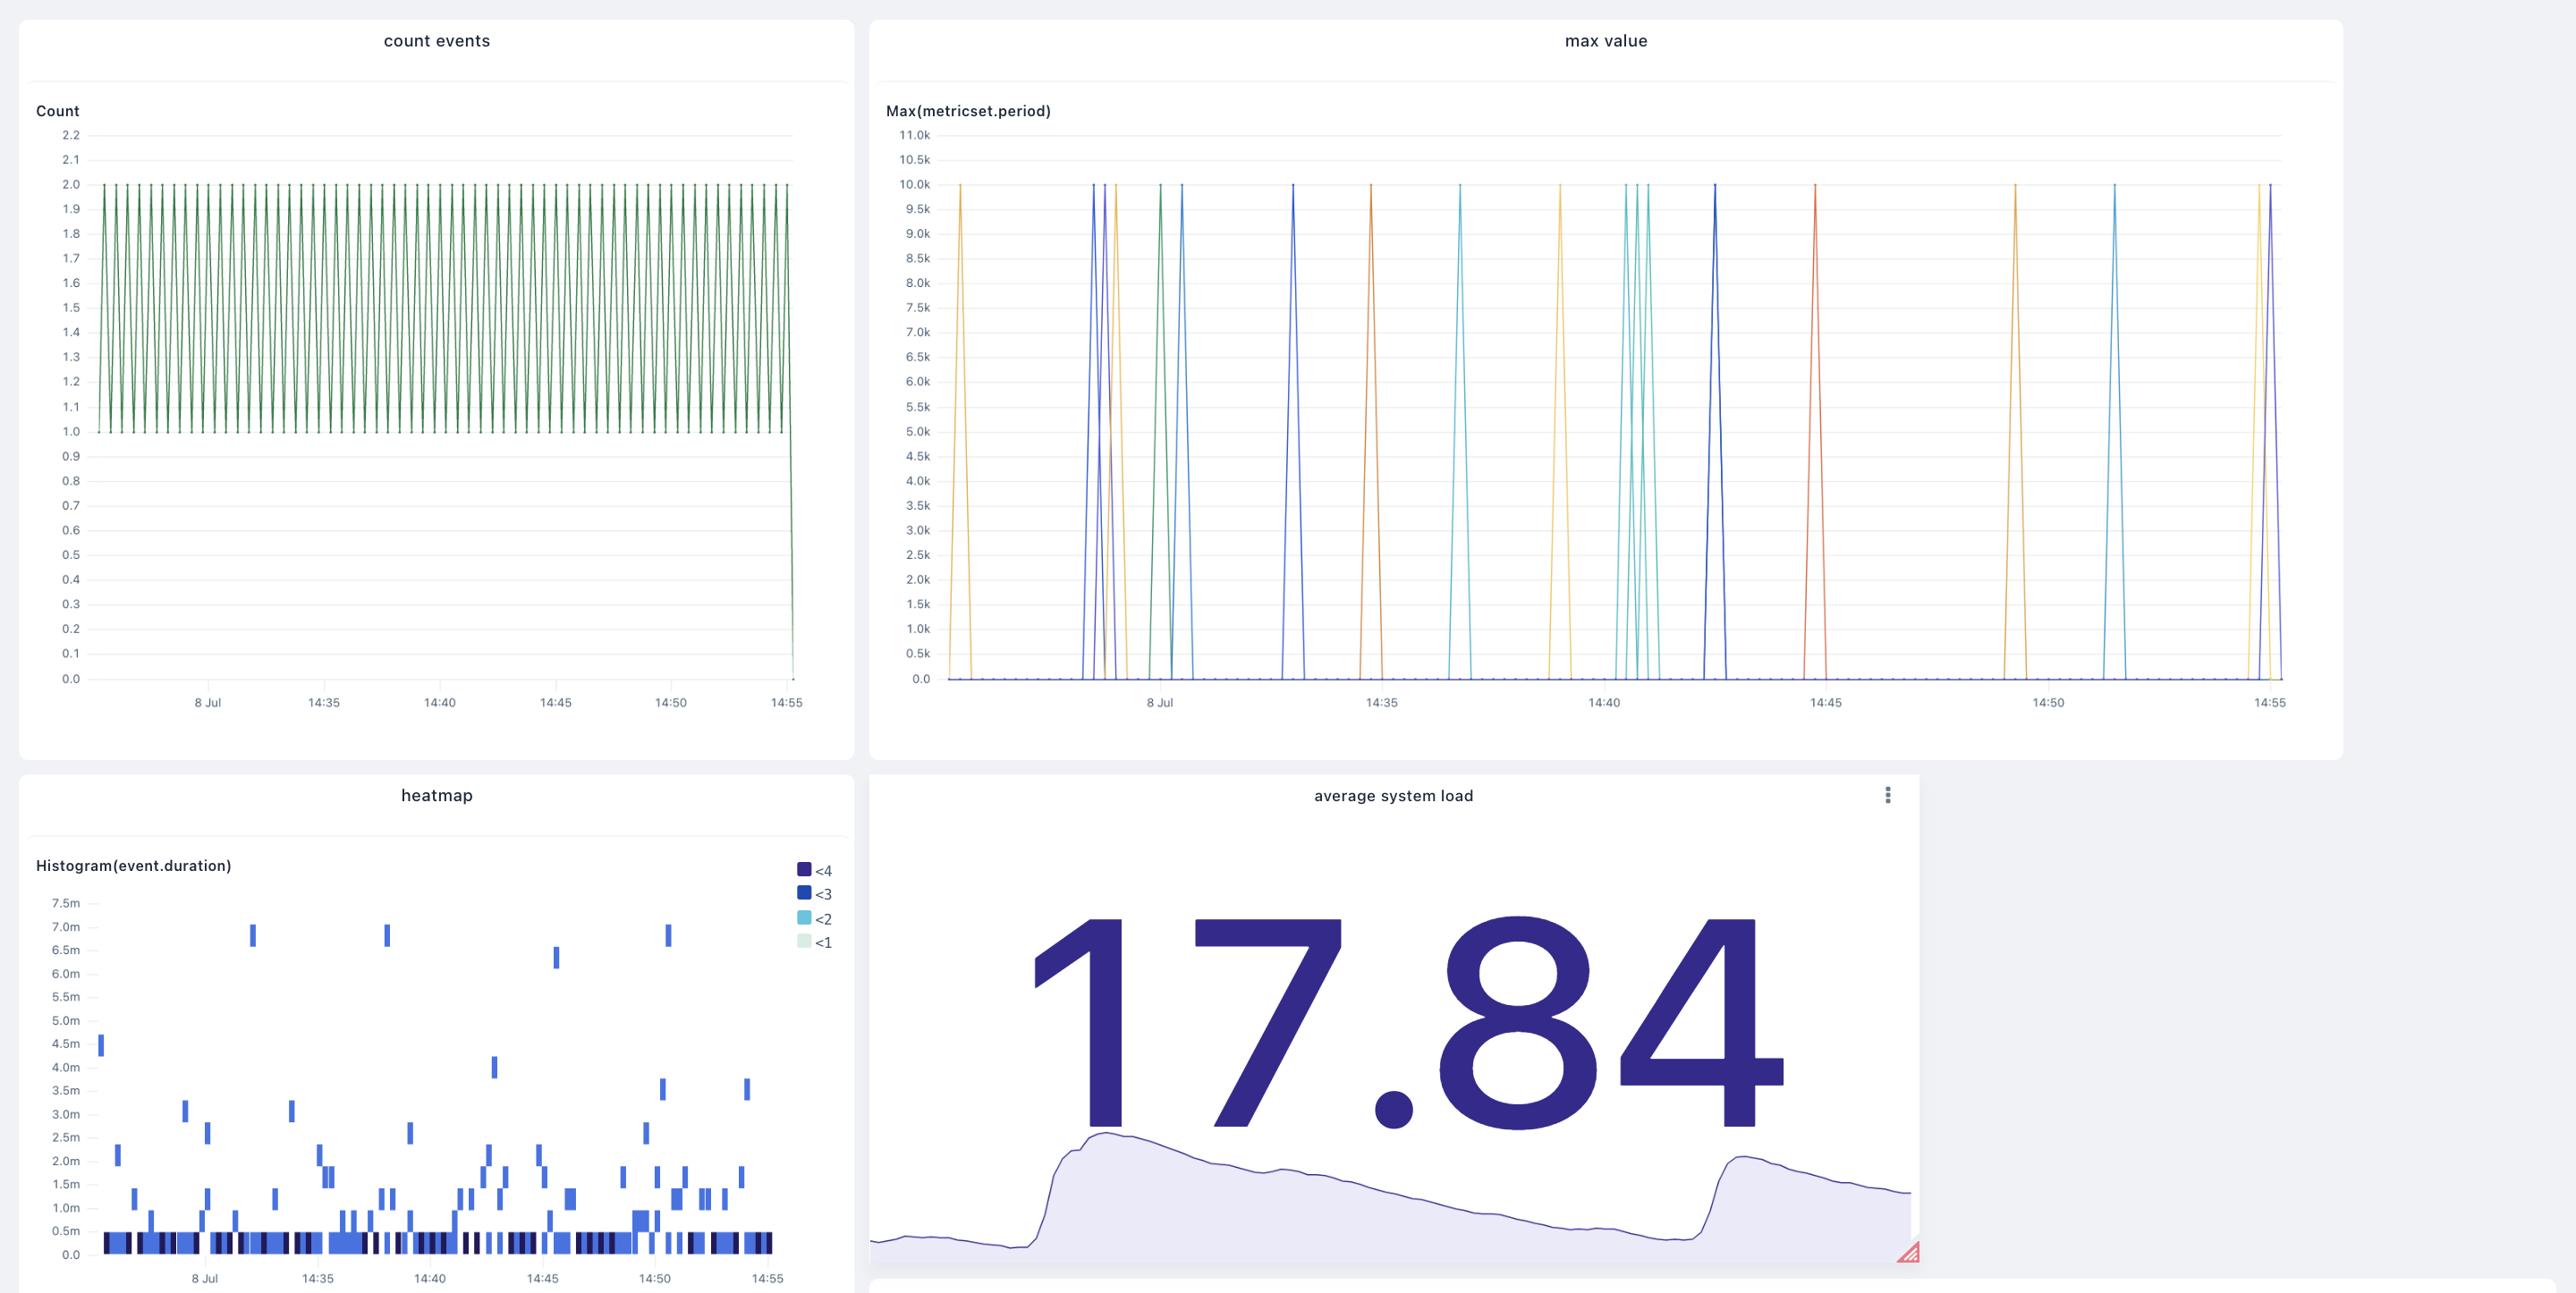
You can see how straightforward it is to group visualizations from your system load modules and metrics using Axiom Dashboard.
Get started with Axiom today
You can read more about Axiom → Metricbeat functionality and use cases on our docs
If you have specific questions or issues configuring the file, I'd love to hear about them. Contact us here or ask a question in the Axiom Community!
We do love discussing dashboards, Metricbeat modules, observability, and Redis libbeat, so feel free to hit the comments if you have any thoughts, questions, or suggestions. You can also follow us on Twitter and on our blog. And if you’ve enjoyed this post, please, take a second to share it on Twitter.
References for the road
- Working with Virtualization.
- Working with Aggregations.
- Read more about other data shippers we support on our official docs.
- Visualizing log events with Axiom
- Configuring Metricbeat modules
Stay tuned for our next blog post


