Configuring alerts on your Elastic search Filebeat events is essential because it’s how you catch issues with your Logstash and Kibana systems immediately. Your organization will know when critical Filebeat functionality changes from elastic stack are occurring, and with this information, you can then check and audit Elasticsearch output from your Filebeat Elasticsearch events. With FIlebeat and Axiom, you can simplify your log events usage, build dashboards on parsing Filebeat inputs, and track SSL traffic from your Filebeat debug visualization.
In this tutorial, I will show you how to set up and get triggers and alerts from your Elasticsearch Filebeat events on Axiom.
Prerequisites
Filebeat 7.15 or lower installed on your config machine.
Elasticsearch Filebeat agent configured.
Sudo Filebeat Permissions
Axiom Dataset & an Ingest Token.
Getting Sophisticated Alerts From Filebeat on Axiom
Visit our docs to copy, edit and configure the Filebeat.yml file to ingest Filebeat log data and Filebeat template events to Axiom.
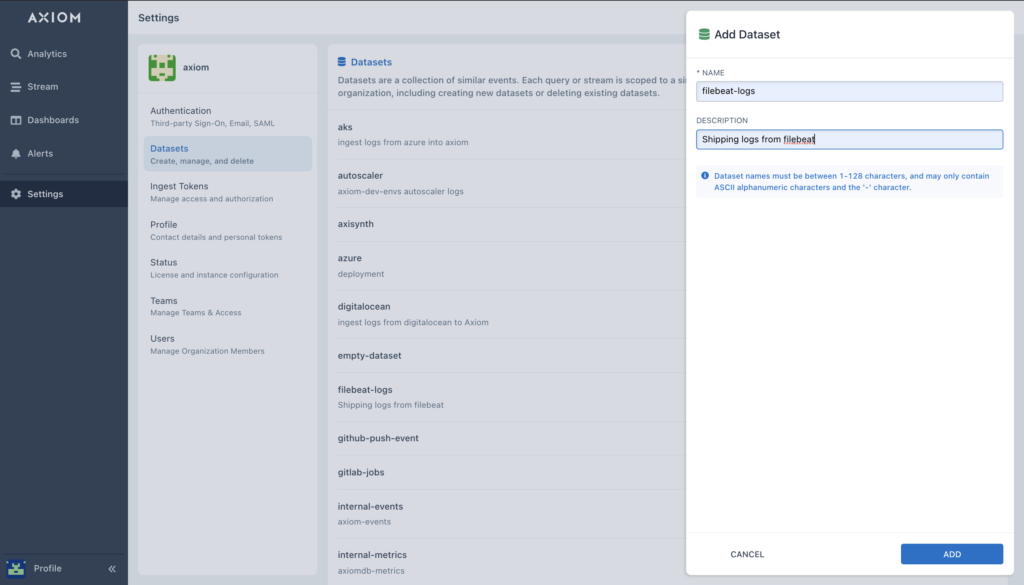
Create your dataset for your Filebeat events by selecting Settings → Datasets.
Generate your ingest token,
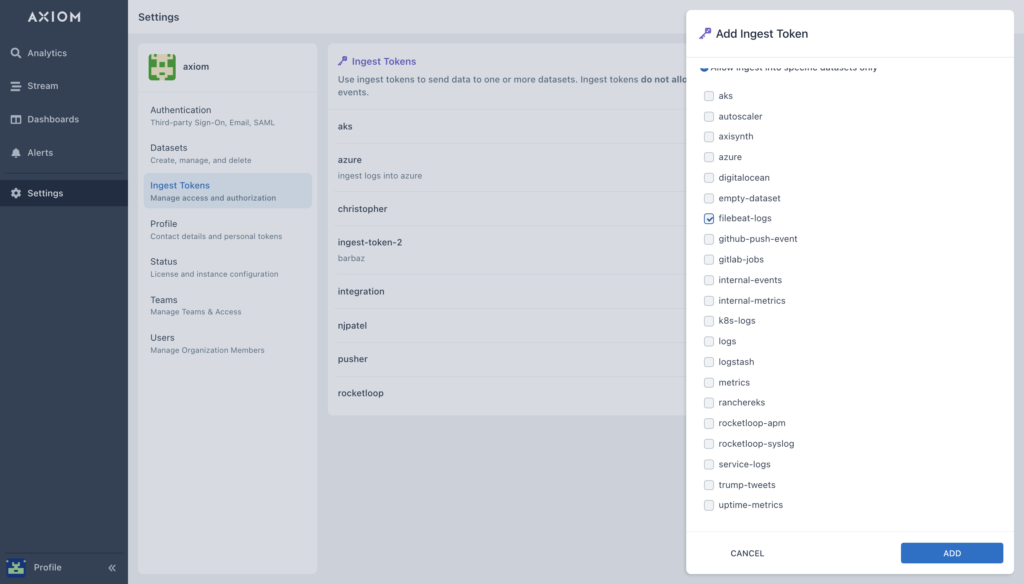
On the Axiom UI, click on settings, and select ingest token.
Select Add ingest token.
Enter a name and description and select ADD.
Copy the generated token to your clipboard. Once you navigate from the page, the token can be seen again by selecting Ingest Tokens.
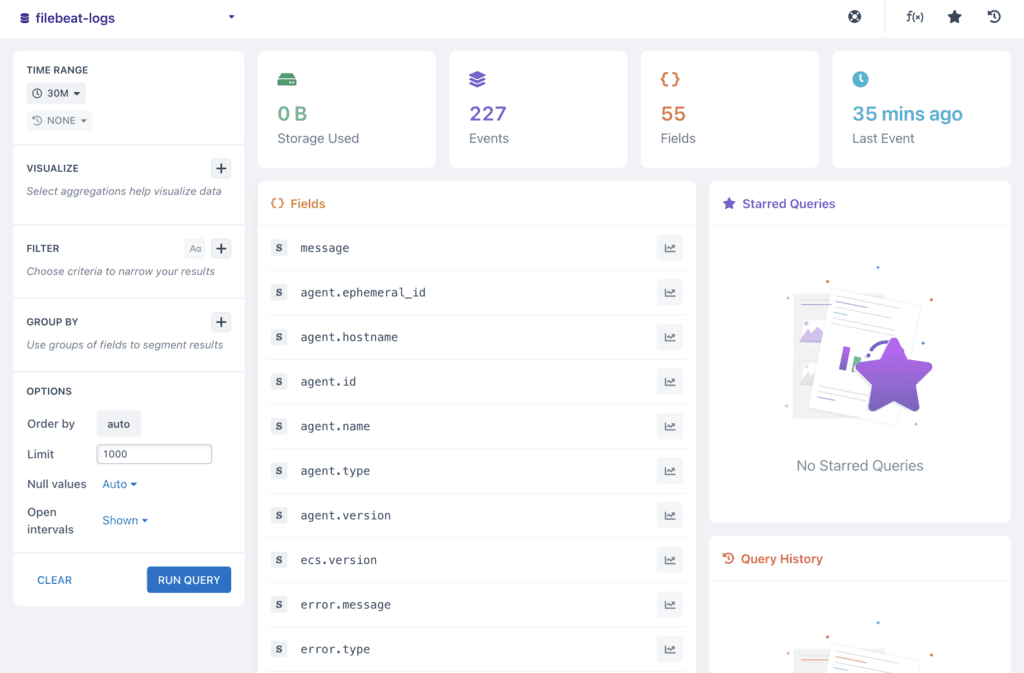
Update the changes with the new Host URL and Dataset name on your Filebeat metadata configuration file. You can now ingest Filebeat log data, Filebeat modules, index pattern API, configure Filebeat and Apache Filebeat events into Axiom.
Before configuring your alerts, you need to configure your monitors and notifiers.
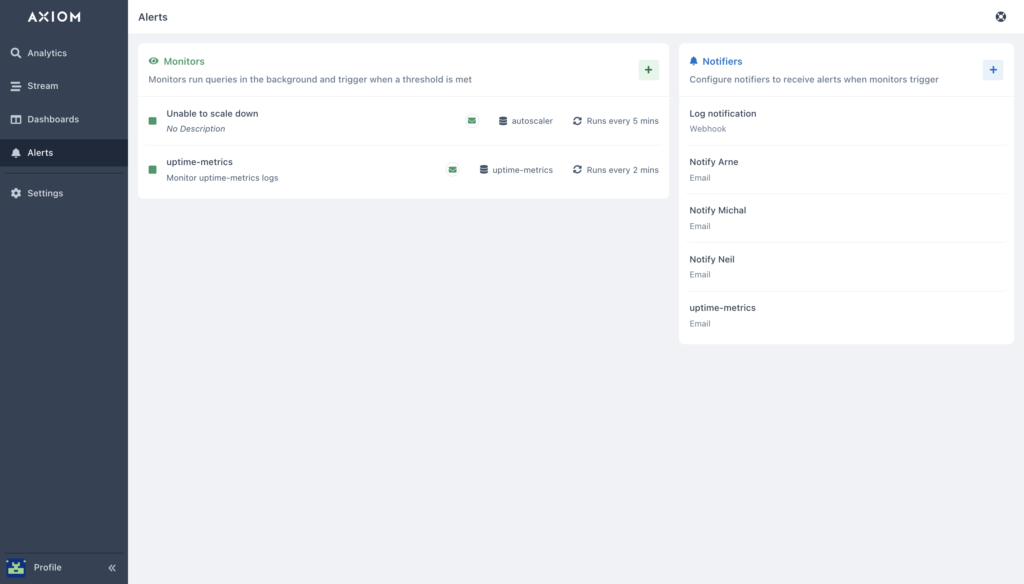
Axiom Monitors let you set up and run continuous Filebeat queries and Elasticsearch logs over your data. After configuring and setting up Filebeat queries, you can confirm if the values created from the results exceed the Docker threshold settings. If a Filebeat threshold is met, then an alert is triggered to notify you via any configured Notifiers.
Notifiers are important components of monitors that keep your team informed of Filebeat issues, Linux errors, API log data errors and let you know if any complications arise.
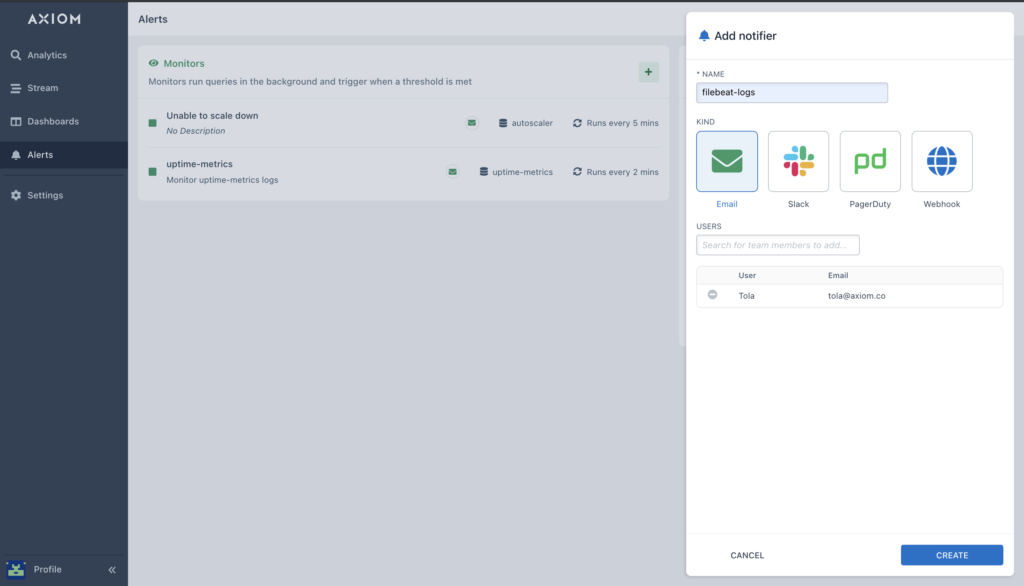
Notifications can be sent through four different Notifiers:
Email
Slack
PagerDuty
Webhook
Select the specific notifier you would like to use for your Monitor.
After you have selected your Notifier, configure your Monitor:
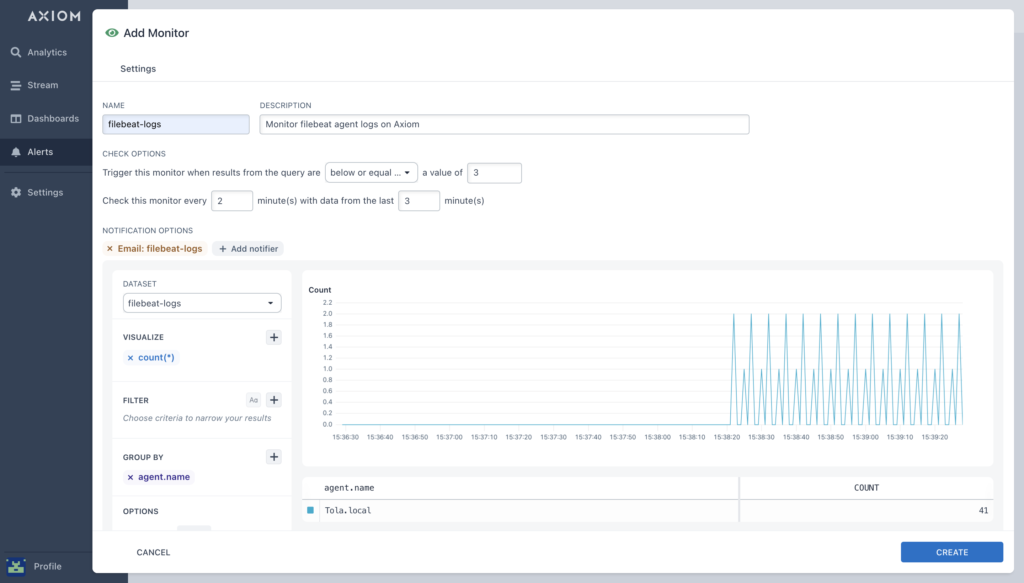
Name of my monitor is: Filebeat-events
Description – Monitor Filebeat agent events on Axiom. Inserting a description is helpful to your team members so that they can know why the monitor was created.
For Trigger options, I set the comparison type to below or equal to the value of 3. 3 is the value to compare the results of the query to.
Specify the frequency and time range for your monitor. Here I configured mine to check this monitor for every 2 minutes with data from the last 3 minutes.
Select your notification option. Here I’m selecting the notification via Email which I configured in the previous step
Select the dataset in which you ingested logs from Filebeat harvester earlier.
Choose the Aggregation type you want to run your Query on. Here, I configured my Filebeat config file query using the
countaggregation. It will trigger the Logstash Filebeat monitor and send an alert to my email when the value of 3 is or equal to the threshold value of 3You can snooze your monitor by clicking the ‘alarm clock’ icon in the slide-out toolbar. By snoozing your Elastic search Filebeat monitor, no checks will be carried out by the monitor until the snooze time is elapsed.
You can use GROUP BY to get more specific alerts where necessary; this will trigger your monitor once for every Kibana and Filebeat Windows group produced by a query.
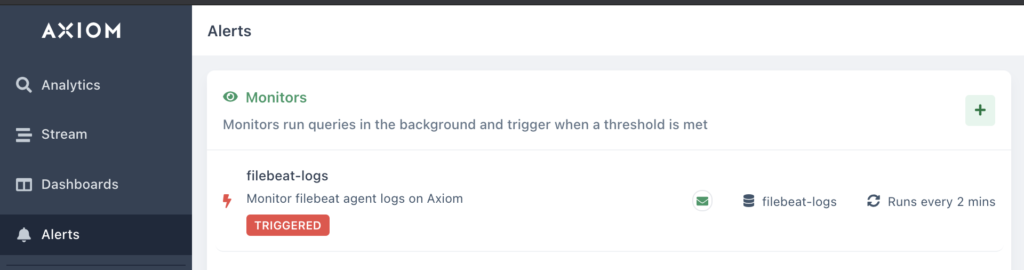
Back to your Monitor’s page, wait for 2 minutes. You will see that the alert has been triggered.
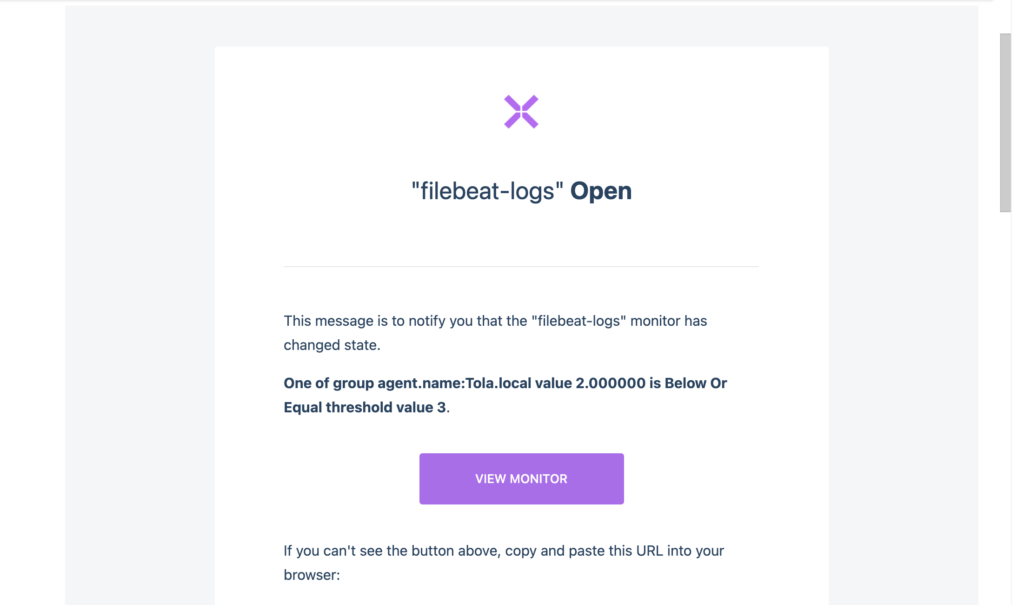
Go to your email or whichever Notifier you configured earlier to see the Notification. I received an email alert that my Filebeat JSON API, Filebeat modules, template errors, and Apache index pattern have changed state. You can configure your Filebeat monitors to get triggered at any
value,frequencyandtime range.
Try it today 😇
Filebeat lets you get logs from files and collect Apache logs so you can parse and visualize your logs using Filebeat elastic stack and Filebeat modules. Filebeat modules make it easy to get started with sending modules.d template files and auth configuration options into your Axiom dataset. Automatically, Filebeat configures Elasticsearch and localhost for you to have the right Nginx processors, permission rules, and shipper endpoint for your Elasticsearch workloads.
Read more about Filebeat → Axiom Configuration on our docs.
Setting up Monitors and Notifiers.
Working with Aggregations.
Setting up Filebeat fields
If you have specific questions or issues configuring the file, I’d love to hear about them. Contact us here or ask a question in our Discord community!
You can also follow us on Twitter and on our blog. And if you’ve enjoyed this post, please, take a second to share it on Twitter.