
Monitoring your apps and services is key for detecting problems before they widely impact your users. Axiom’s Monitors and Notifiers work hand-in-hand to ensure Axiom is always working in the background to make sure you’re made aware if any faults are detected.
In this guide, I will show you how to create alerts on Axiom to detect unusual behavior from Memcached.
Prerequisites
- Packetbeat installed
- Memcache protocol configured
- Axiom Dataset & Ingest Token
Let’s get to it 🎗
- Visit our docs to copy, edit and configure your Packetbeat modules to ship Memcache metrics to Axiom.
The $YOUR_AXIOM_URL is the URL of your Axiom deployment. The user:token is the ingest token for your deployment (always in a string format such as xapt-xxxxxxxx-xxxx-xxxx-xxxx-xxxxxxxxxxxx.)
- Run your command after entering your
api_keyandAXIOM_URL
setup.ilm.enabled: false

# network device to capture traffic from
packetbeat.interfaces.device: en0

# Configure the maximum size of the packets to capture
packetbeat.interfaces.snaplen: 44937833987

# Configure Sniffing & traffic capturing options
packetbeat.interfaces.type: pcap

# Configure the maximum size of the shared memory buffer to use
packetbeat.interfaces.buffer_size_mb: 400
packetbeat.interfaces.auto_promisc_mode: true

packetbeat.flows:
  timeout: 30s
  period: 10s
protocols:
- type: memcache
  ports: [11211]
  parseunknown: false
  maxvalues: 0
  maxbytespervalue: 100
  transaction_timeout: 200
  udptransactiontimeout: 200

output.elasticsearch:
  hosts: [""$YOUR_AXIOM_URL:443/api/v1/datasets/<dataset>/elastic"]
  # api_key can be your ingest or personal token
  api_key: "user:token"
Before you can ship events to Axiom, you need to create your dataset and Ingest token.
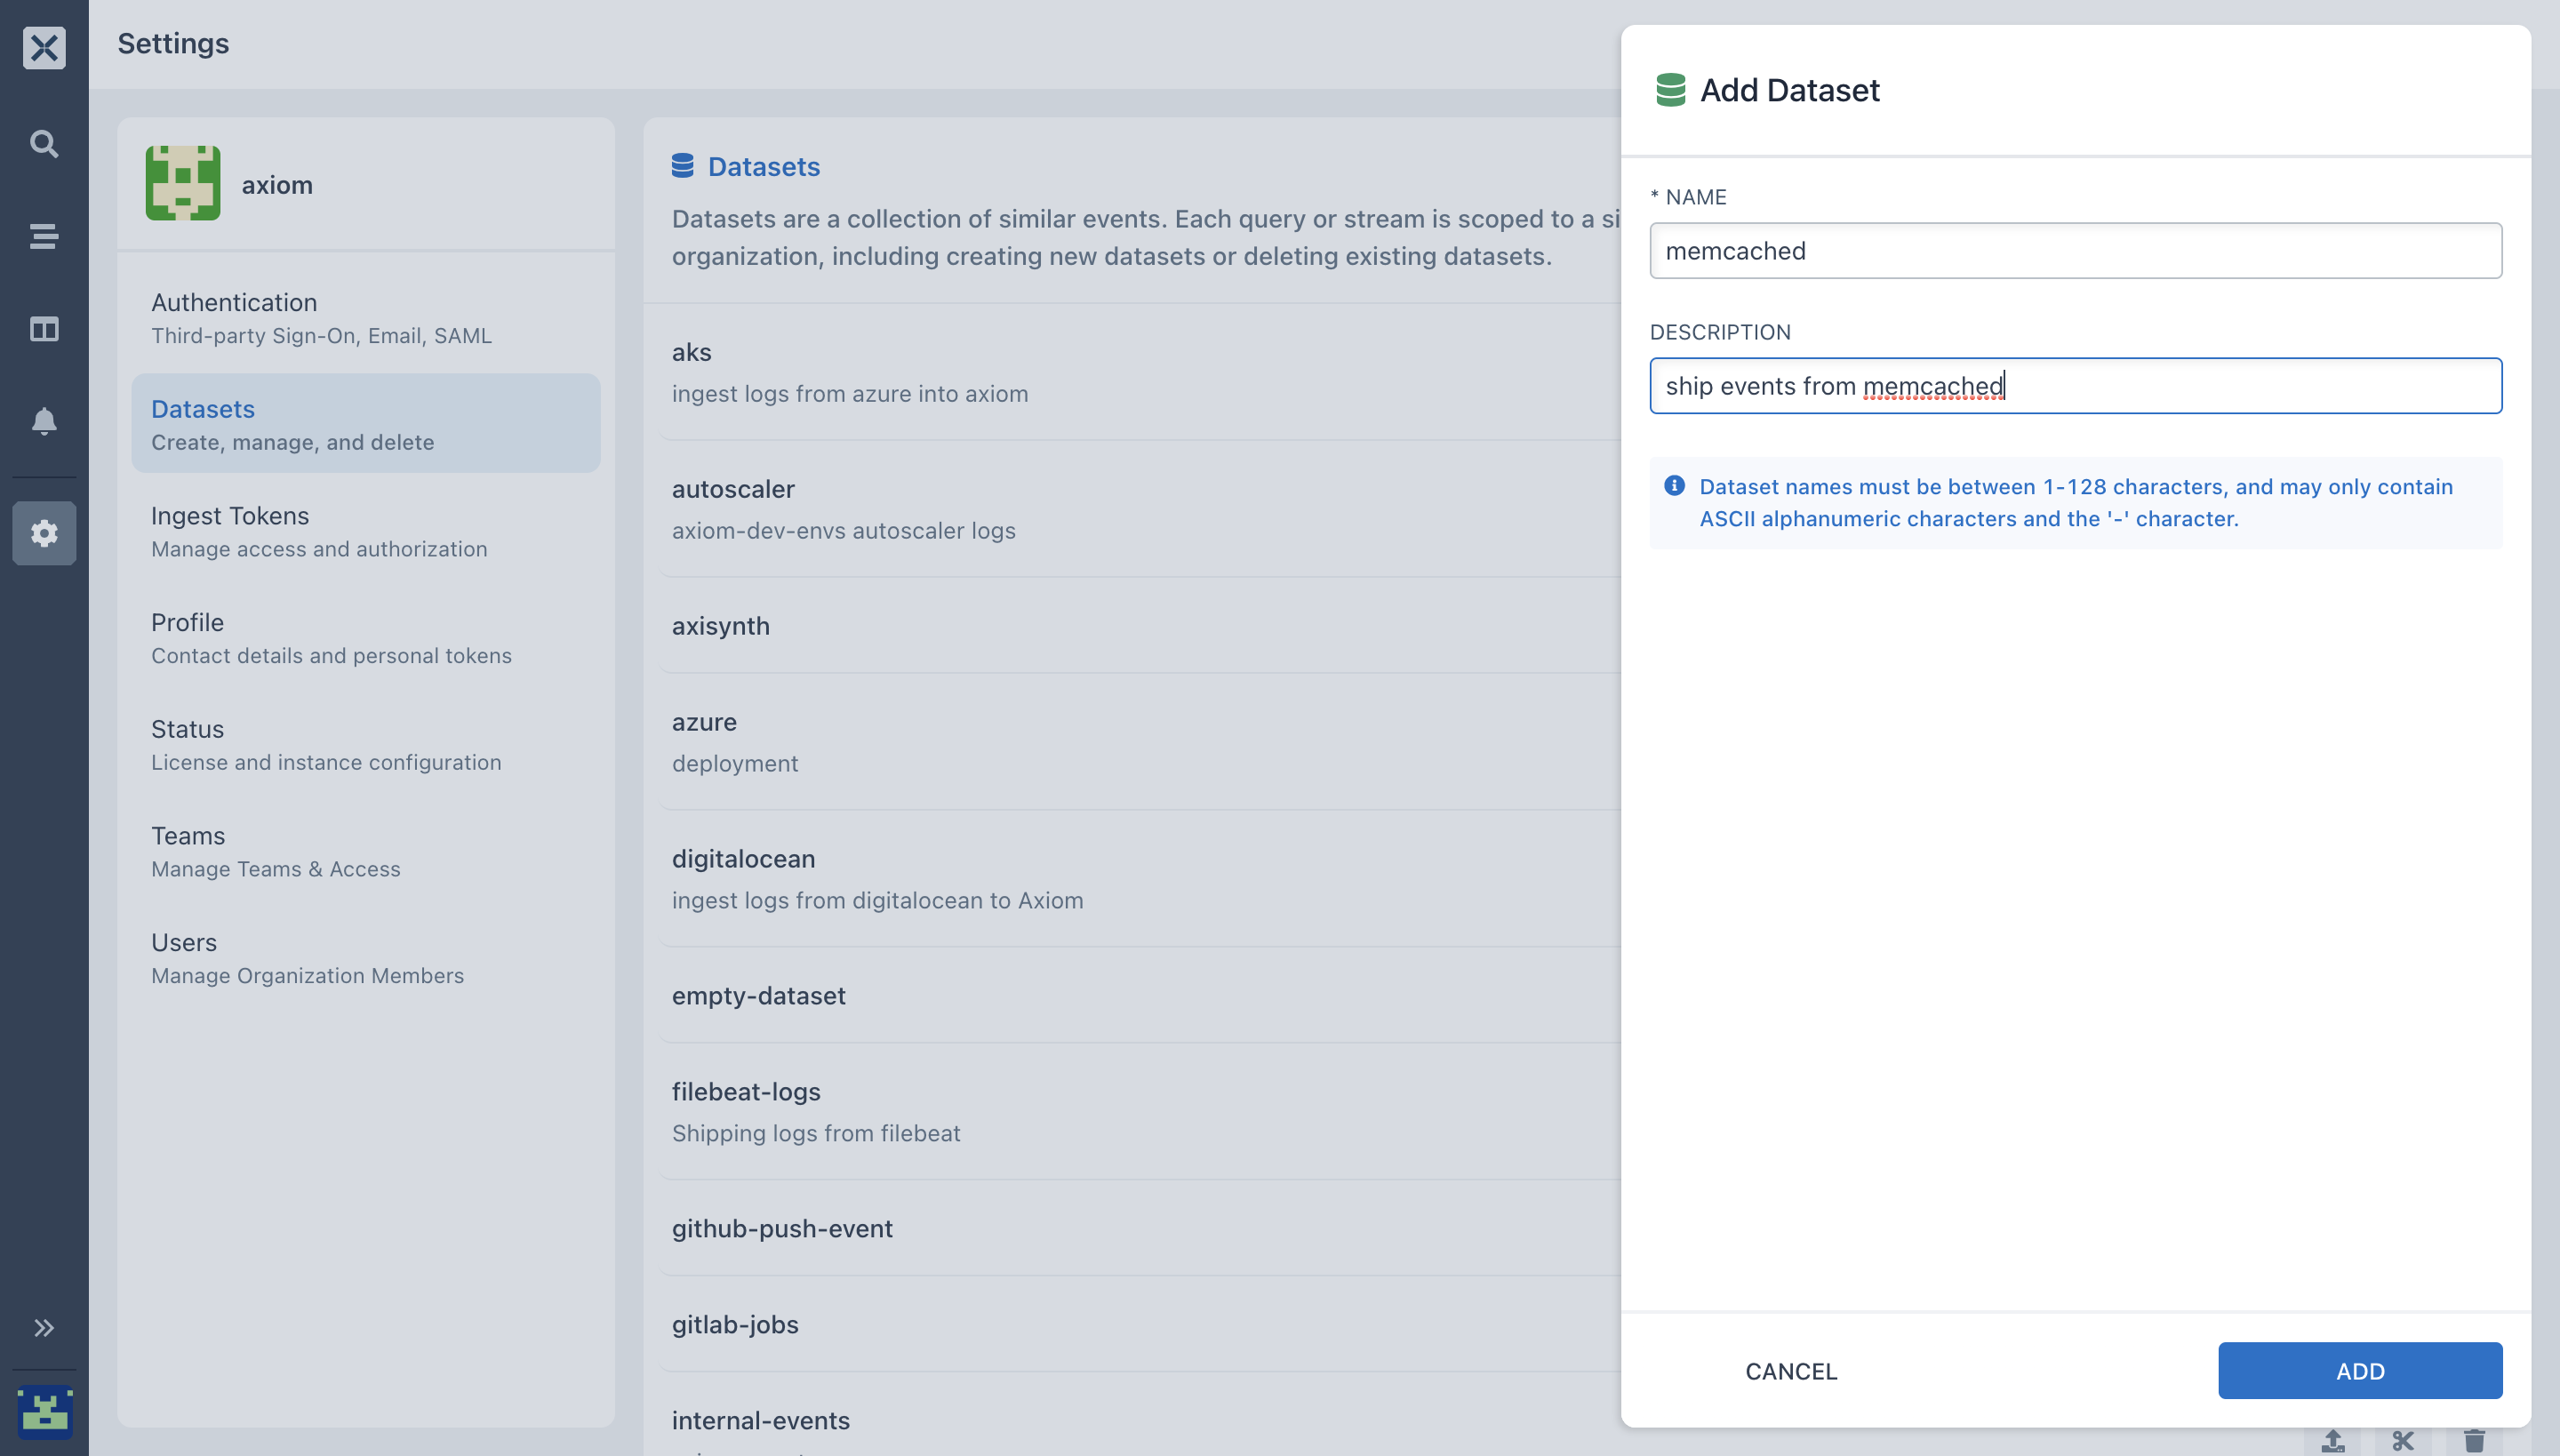
- Create your dataset for your Memcache events by selecting Settings → Datasets on the Axiom UI.
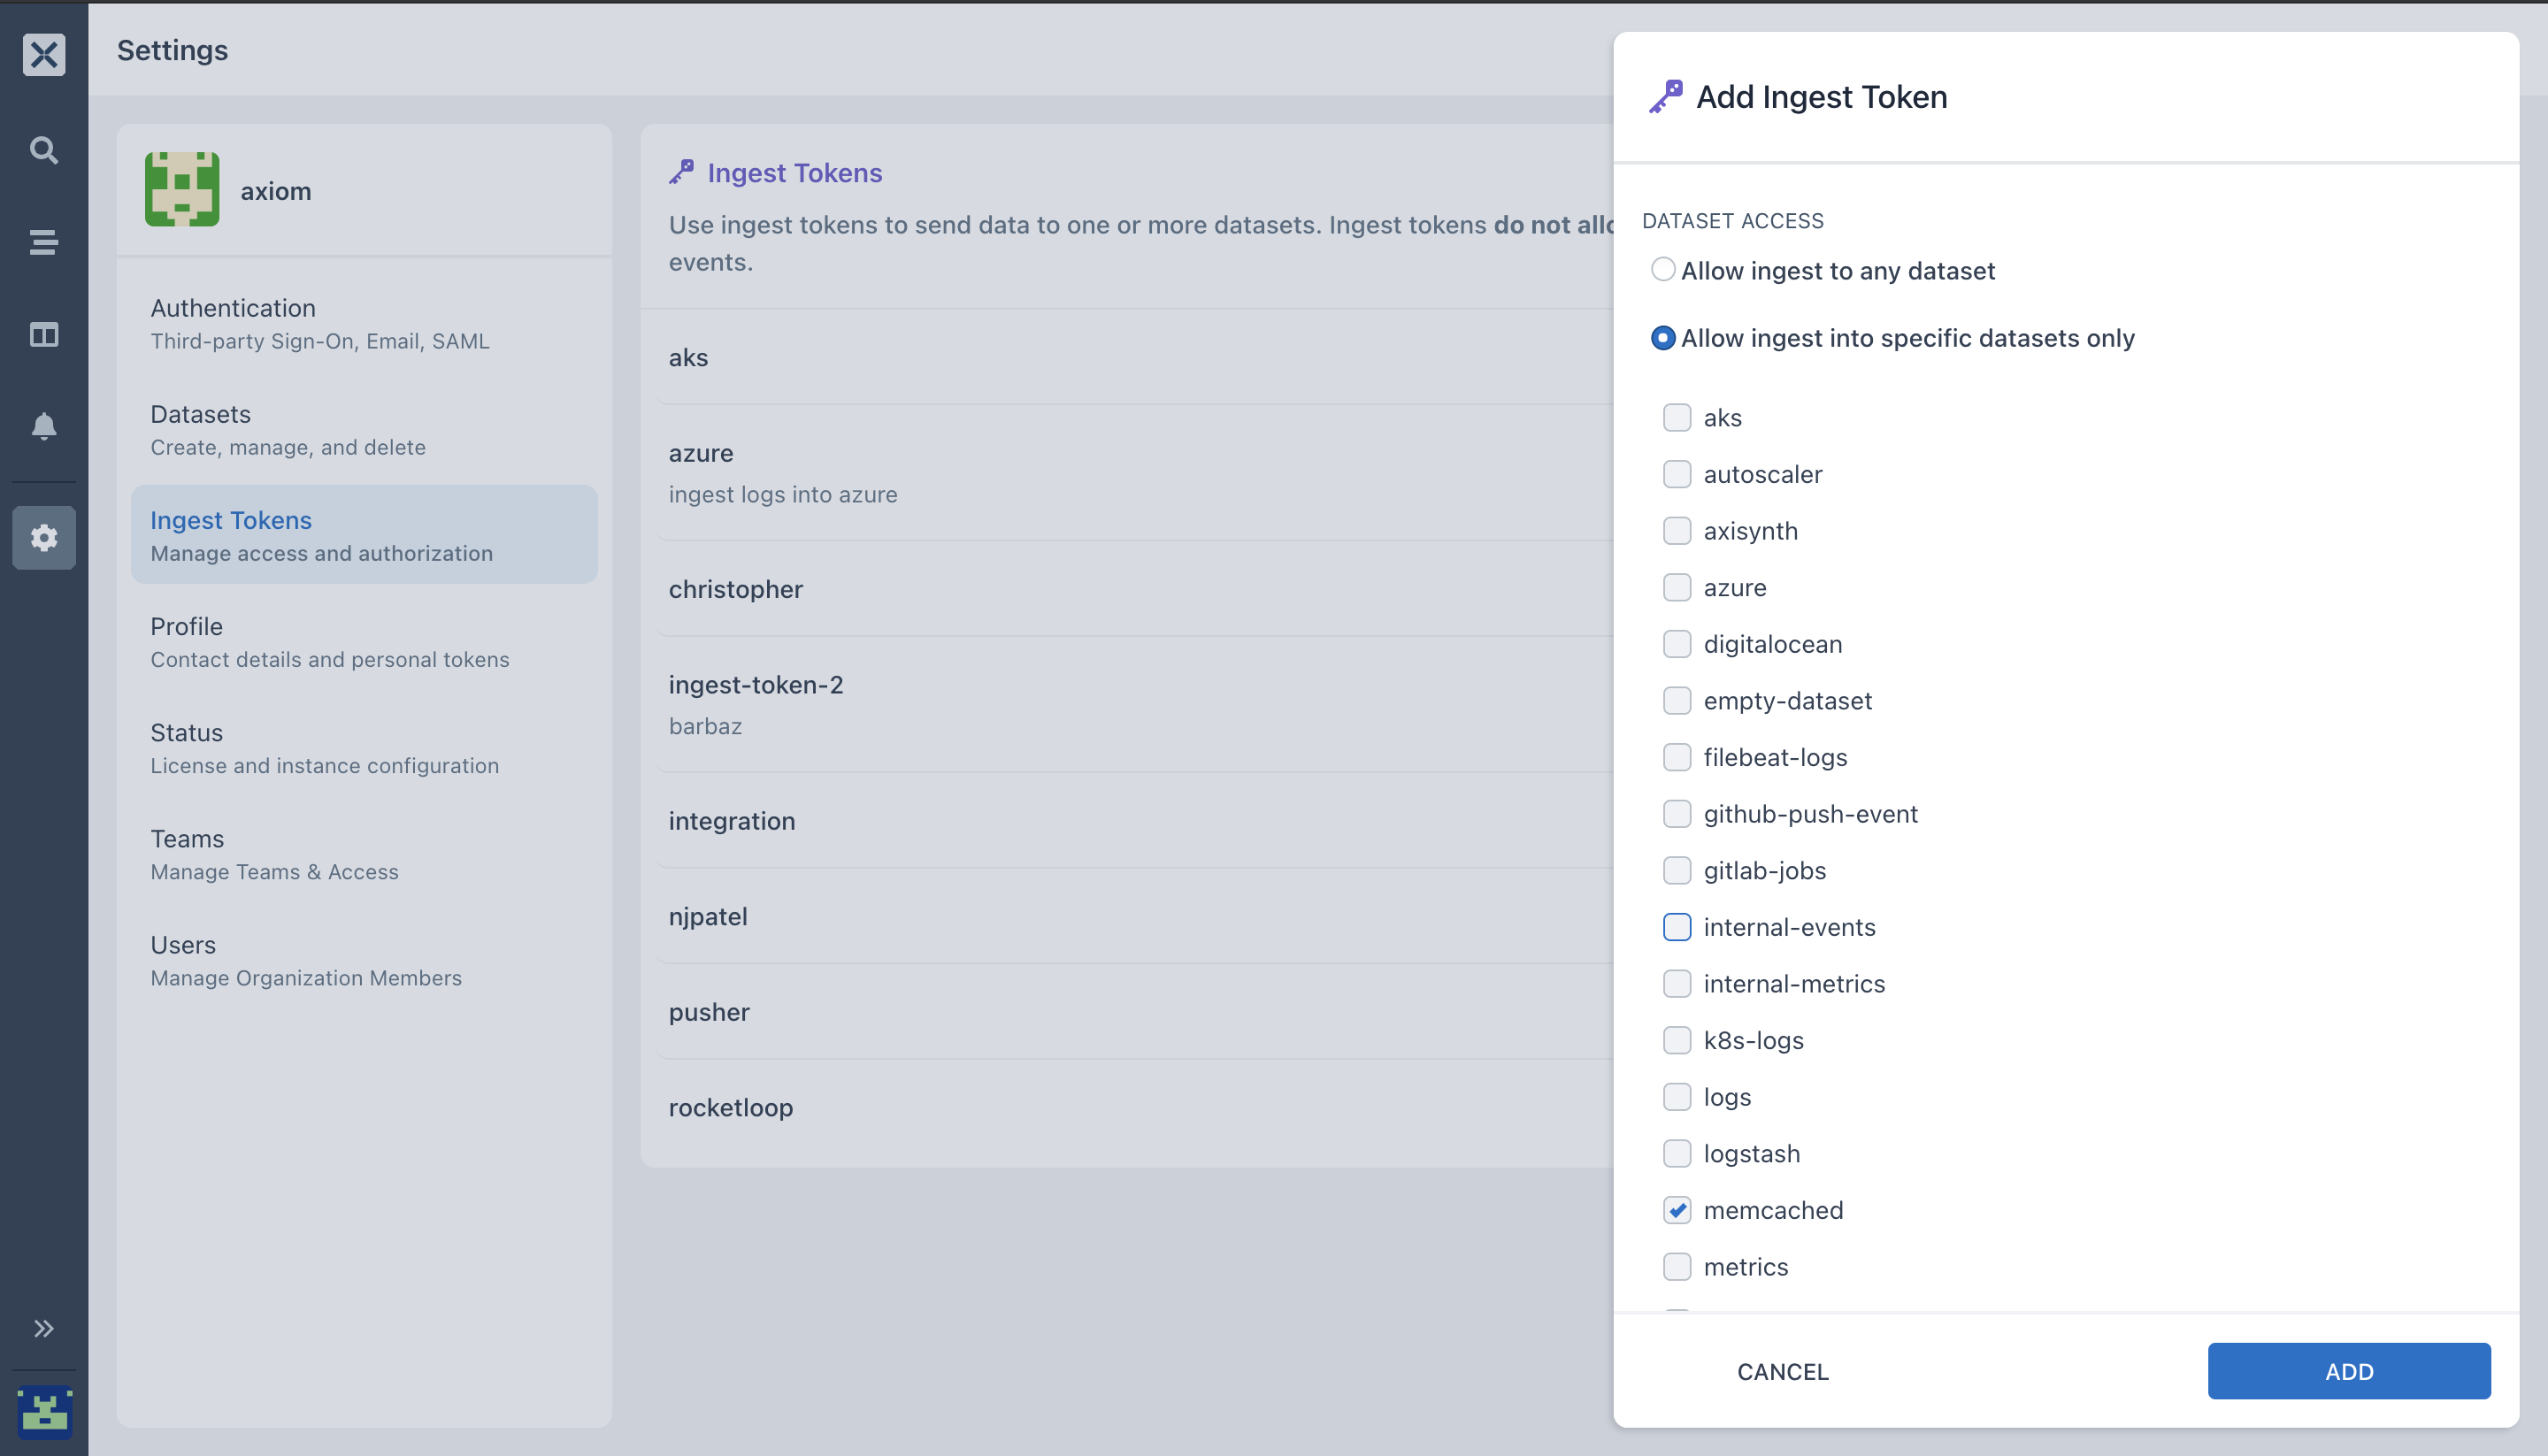
- Generate your ingest token,
- In the Axiom UI, click on settings, select ingest token.
- Select Add ingest token.
- Enter a name and description and select ADD.
- Copy the generated token to your clipboard. Once you navigate from the page, the token can be seen again by selecting Ingest Tokens.
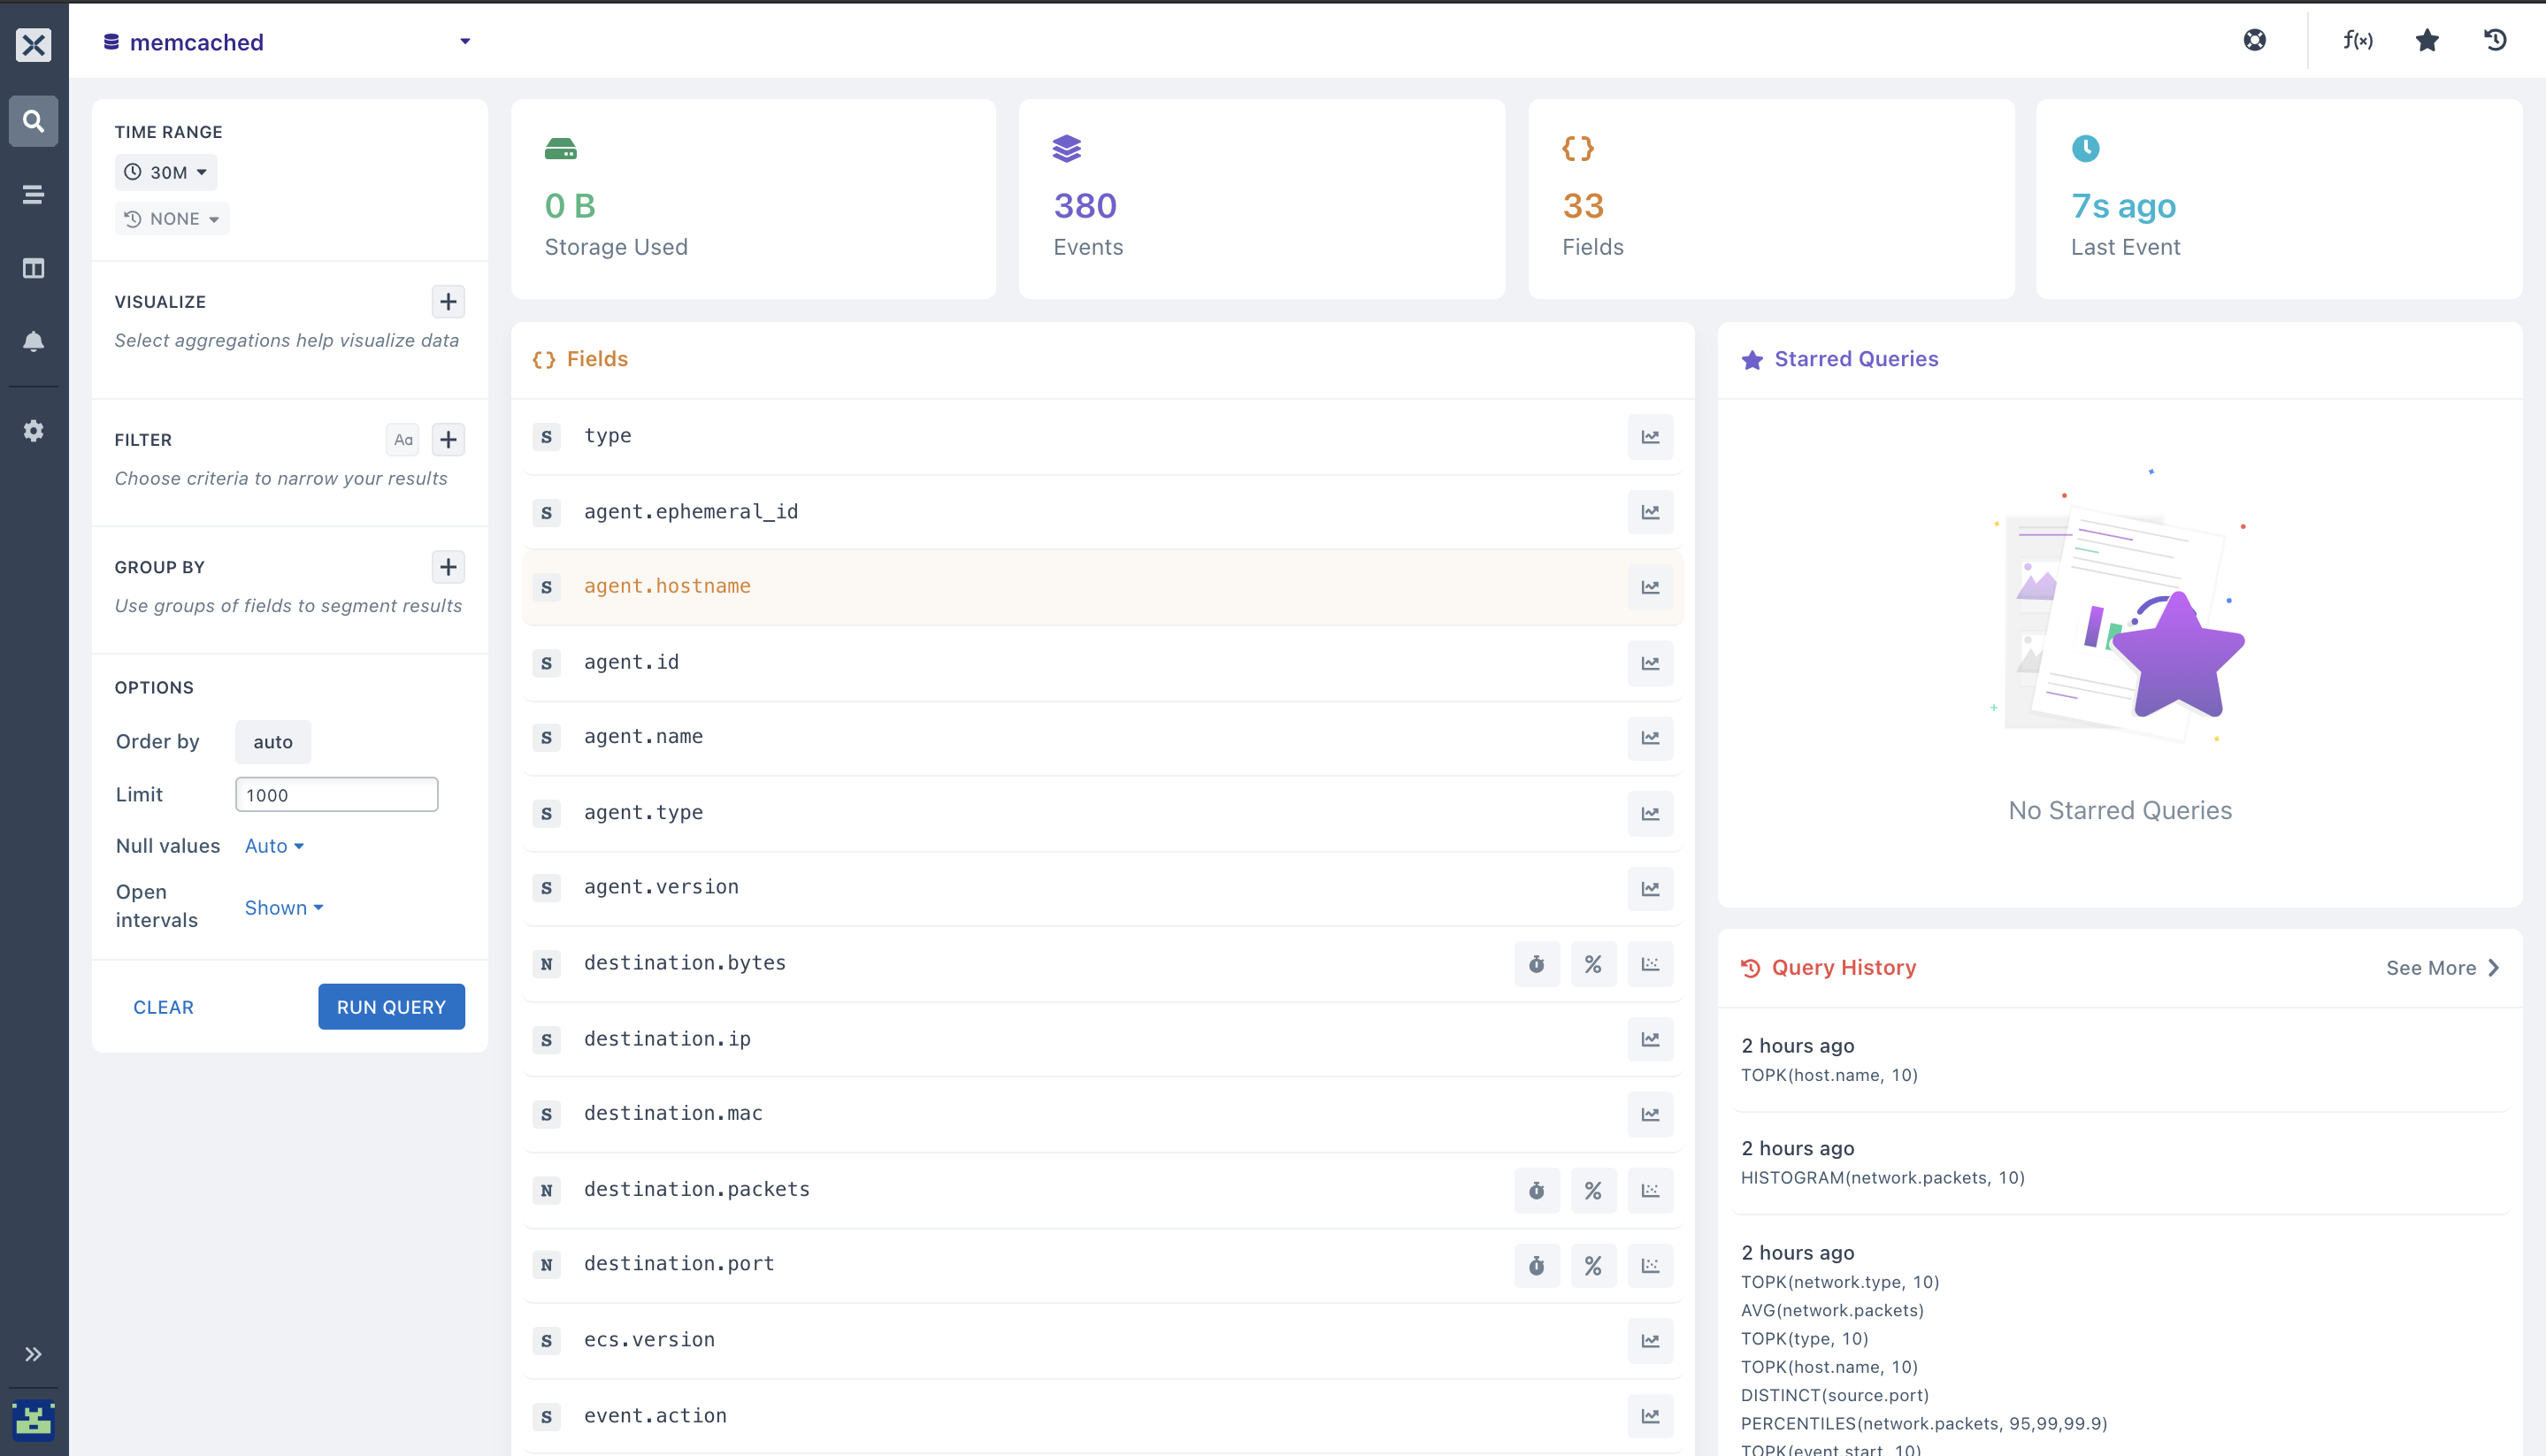
- Update the changes with the new Host URL and Dataset name on your configuration file and ingest your network traffic events into your dataset. Visit the analytics tab you will see your network logs ingested live into your dataset
- Before configuring your alerts, you need to set up monitors and notifiers.
- Axiom Monitors lets you set up and run queries over different periods. After configuring and setting up queries, you can confirm if the values created from the results exceed the threshold. If it exceeds the threshold value you configured, then the monitor would trigger and send an alert to the type of Notifier you added to the monitor.
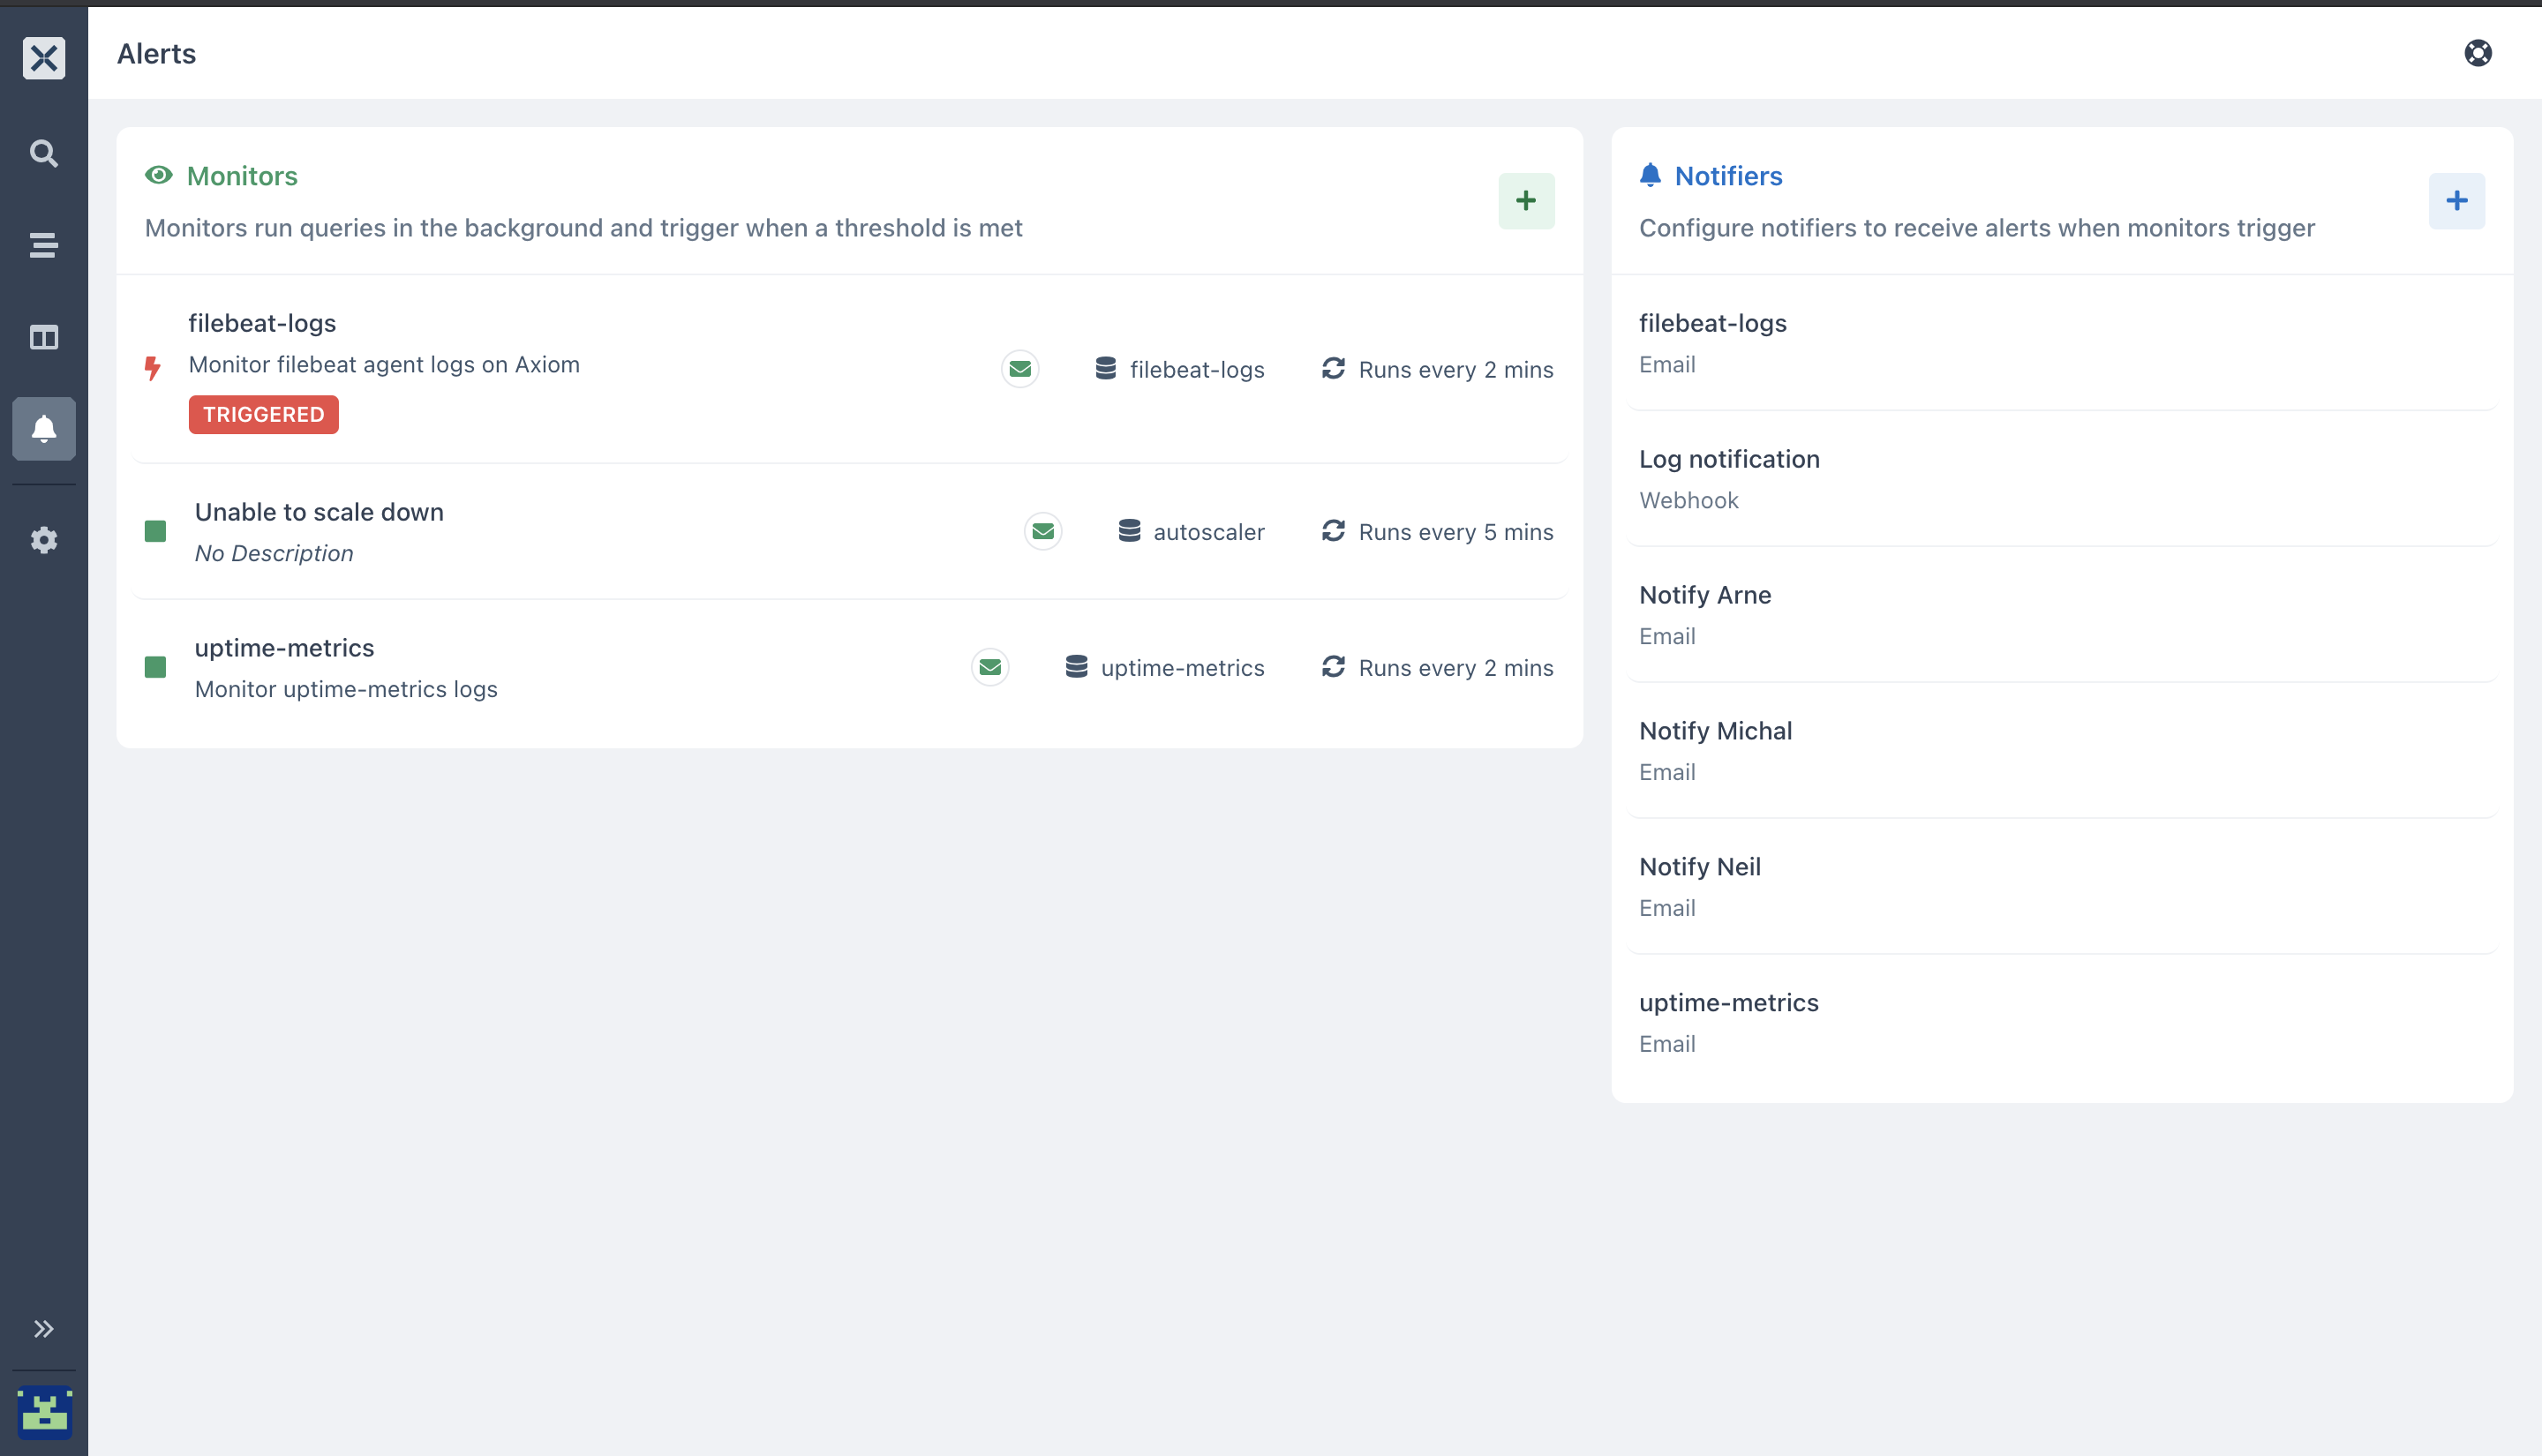
- With Notifiers, your team will be aware of spikes in network traffics, network timeouts, events downtime, port timeout, destination type, events interruption, and if any abnormalities arise.
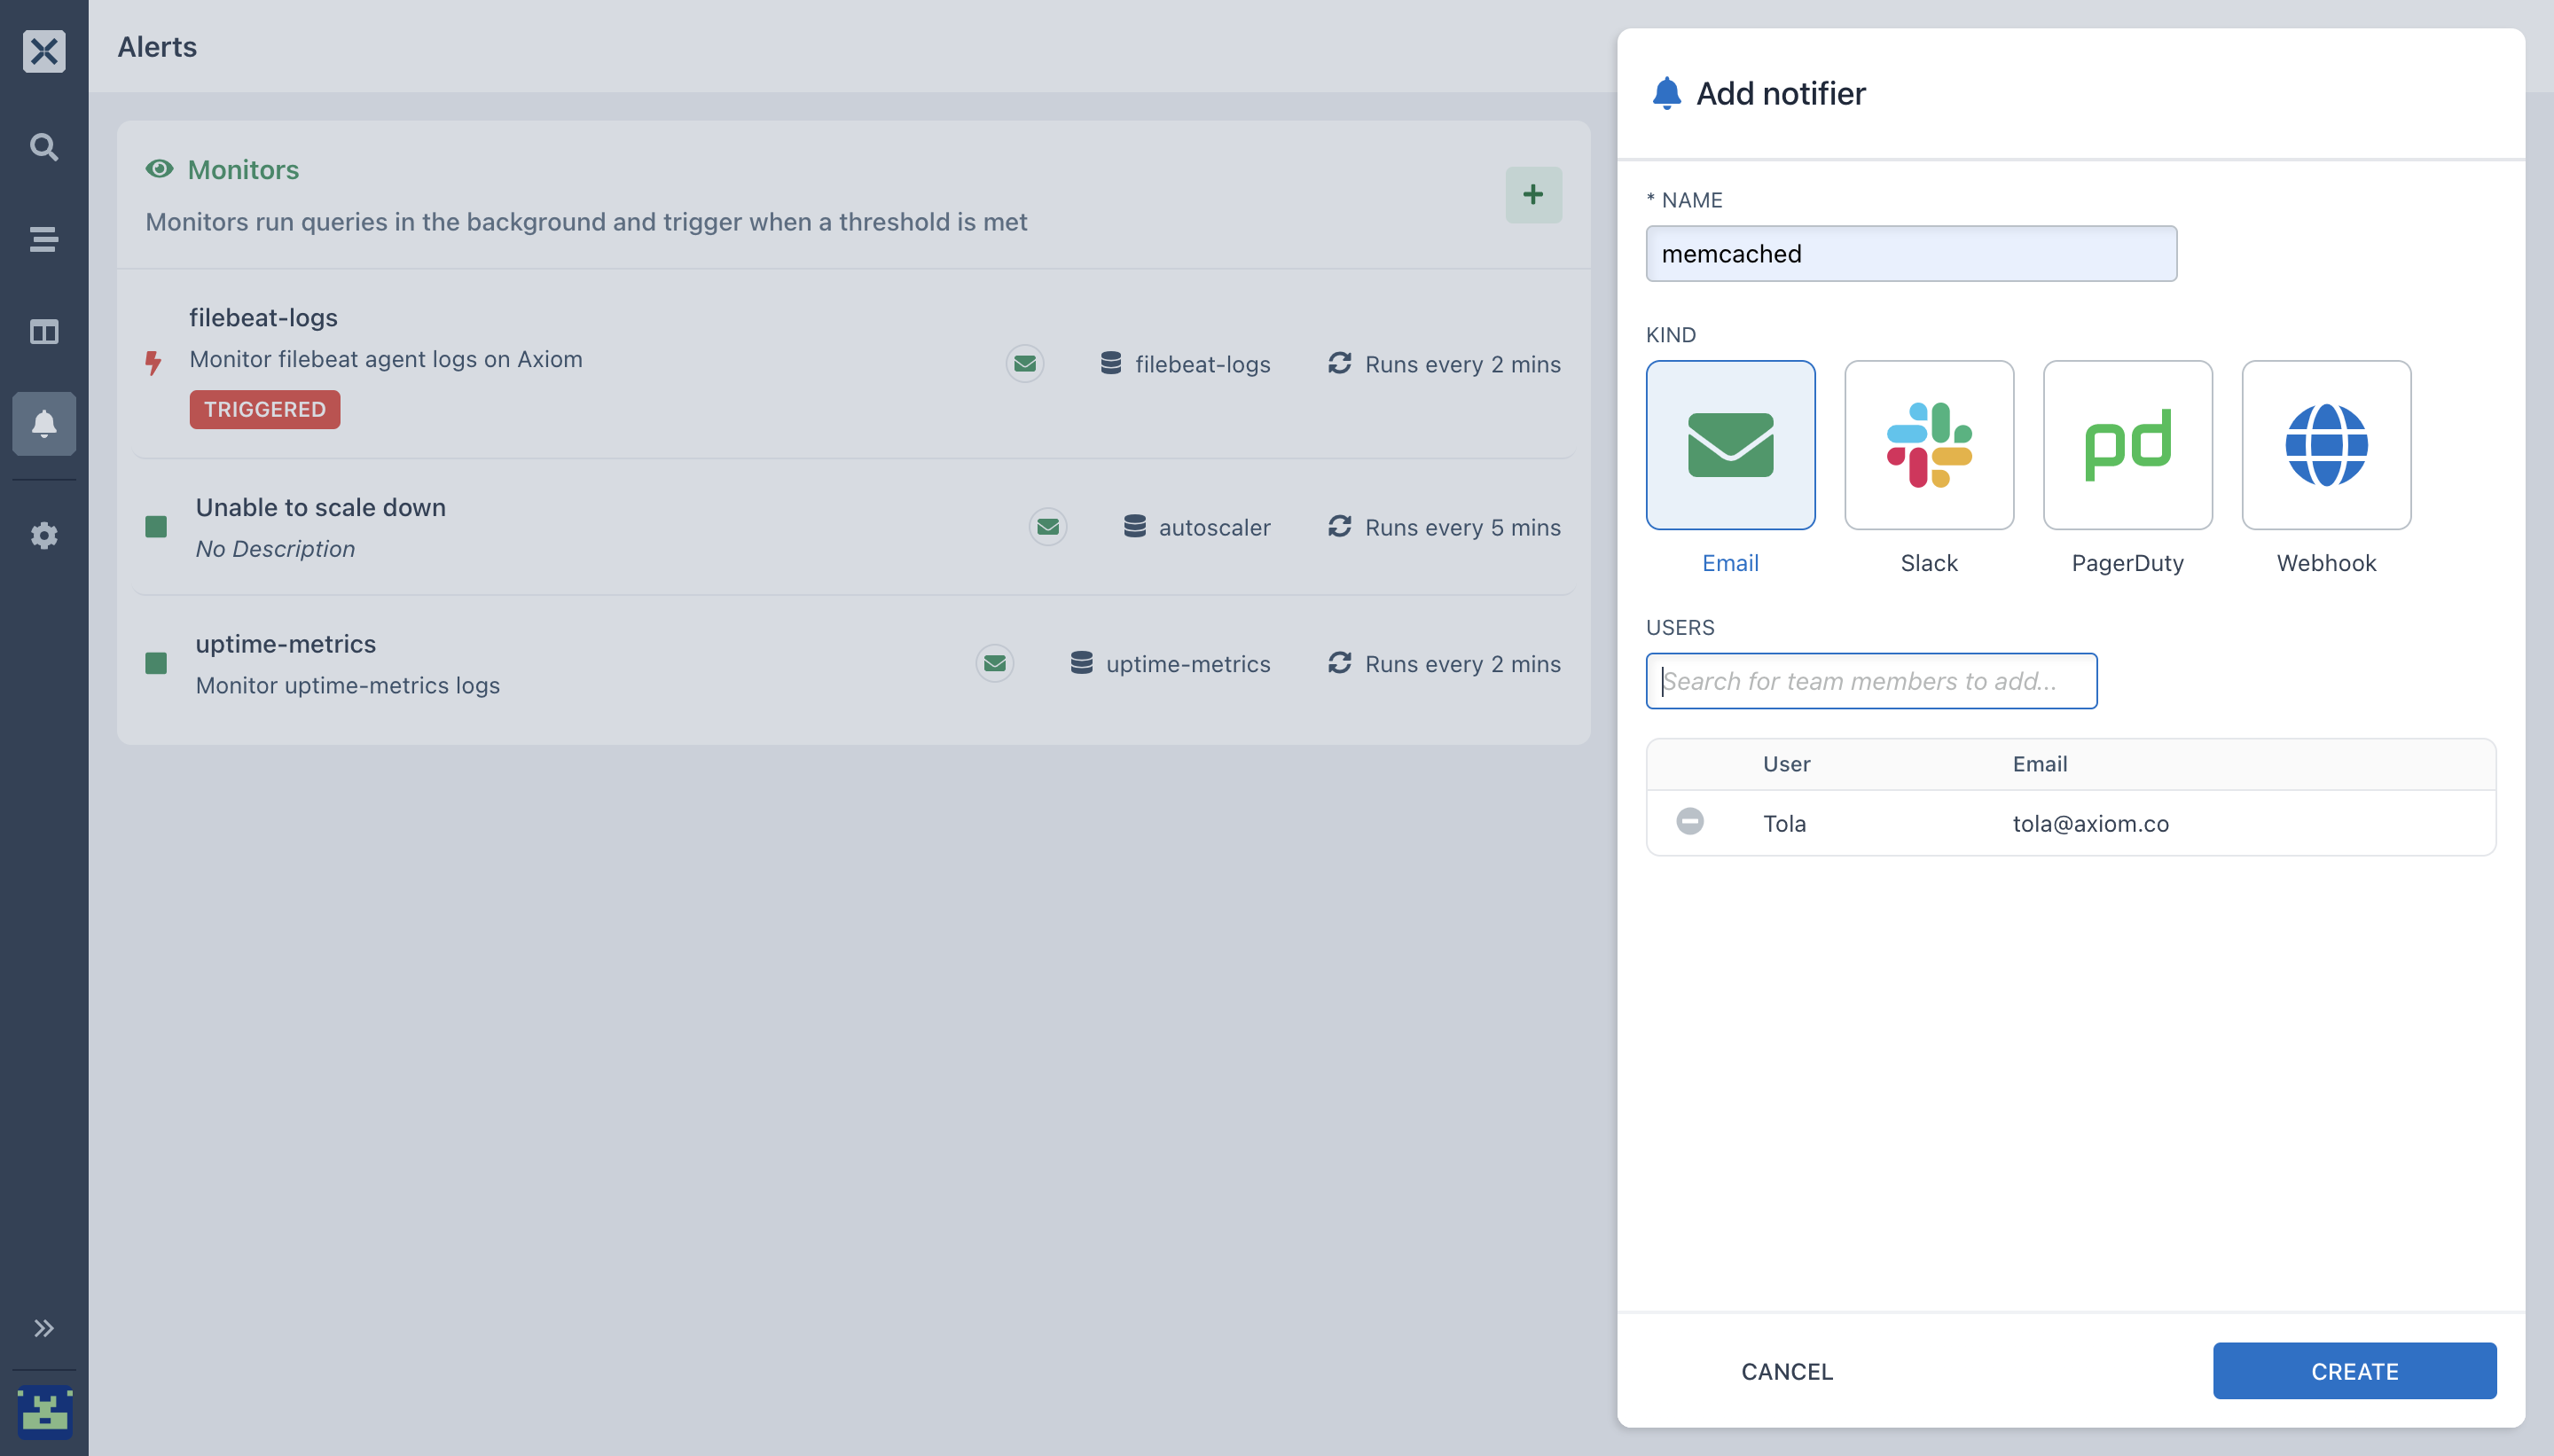
Notifications can be sent through four different Notifiers:
- Slack
- PagerDuty
- Webhook
- Select the specific notifier you would like to use for your Monitor.
- Select the number of users you want to add to the notifier.
- Click on create.
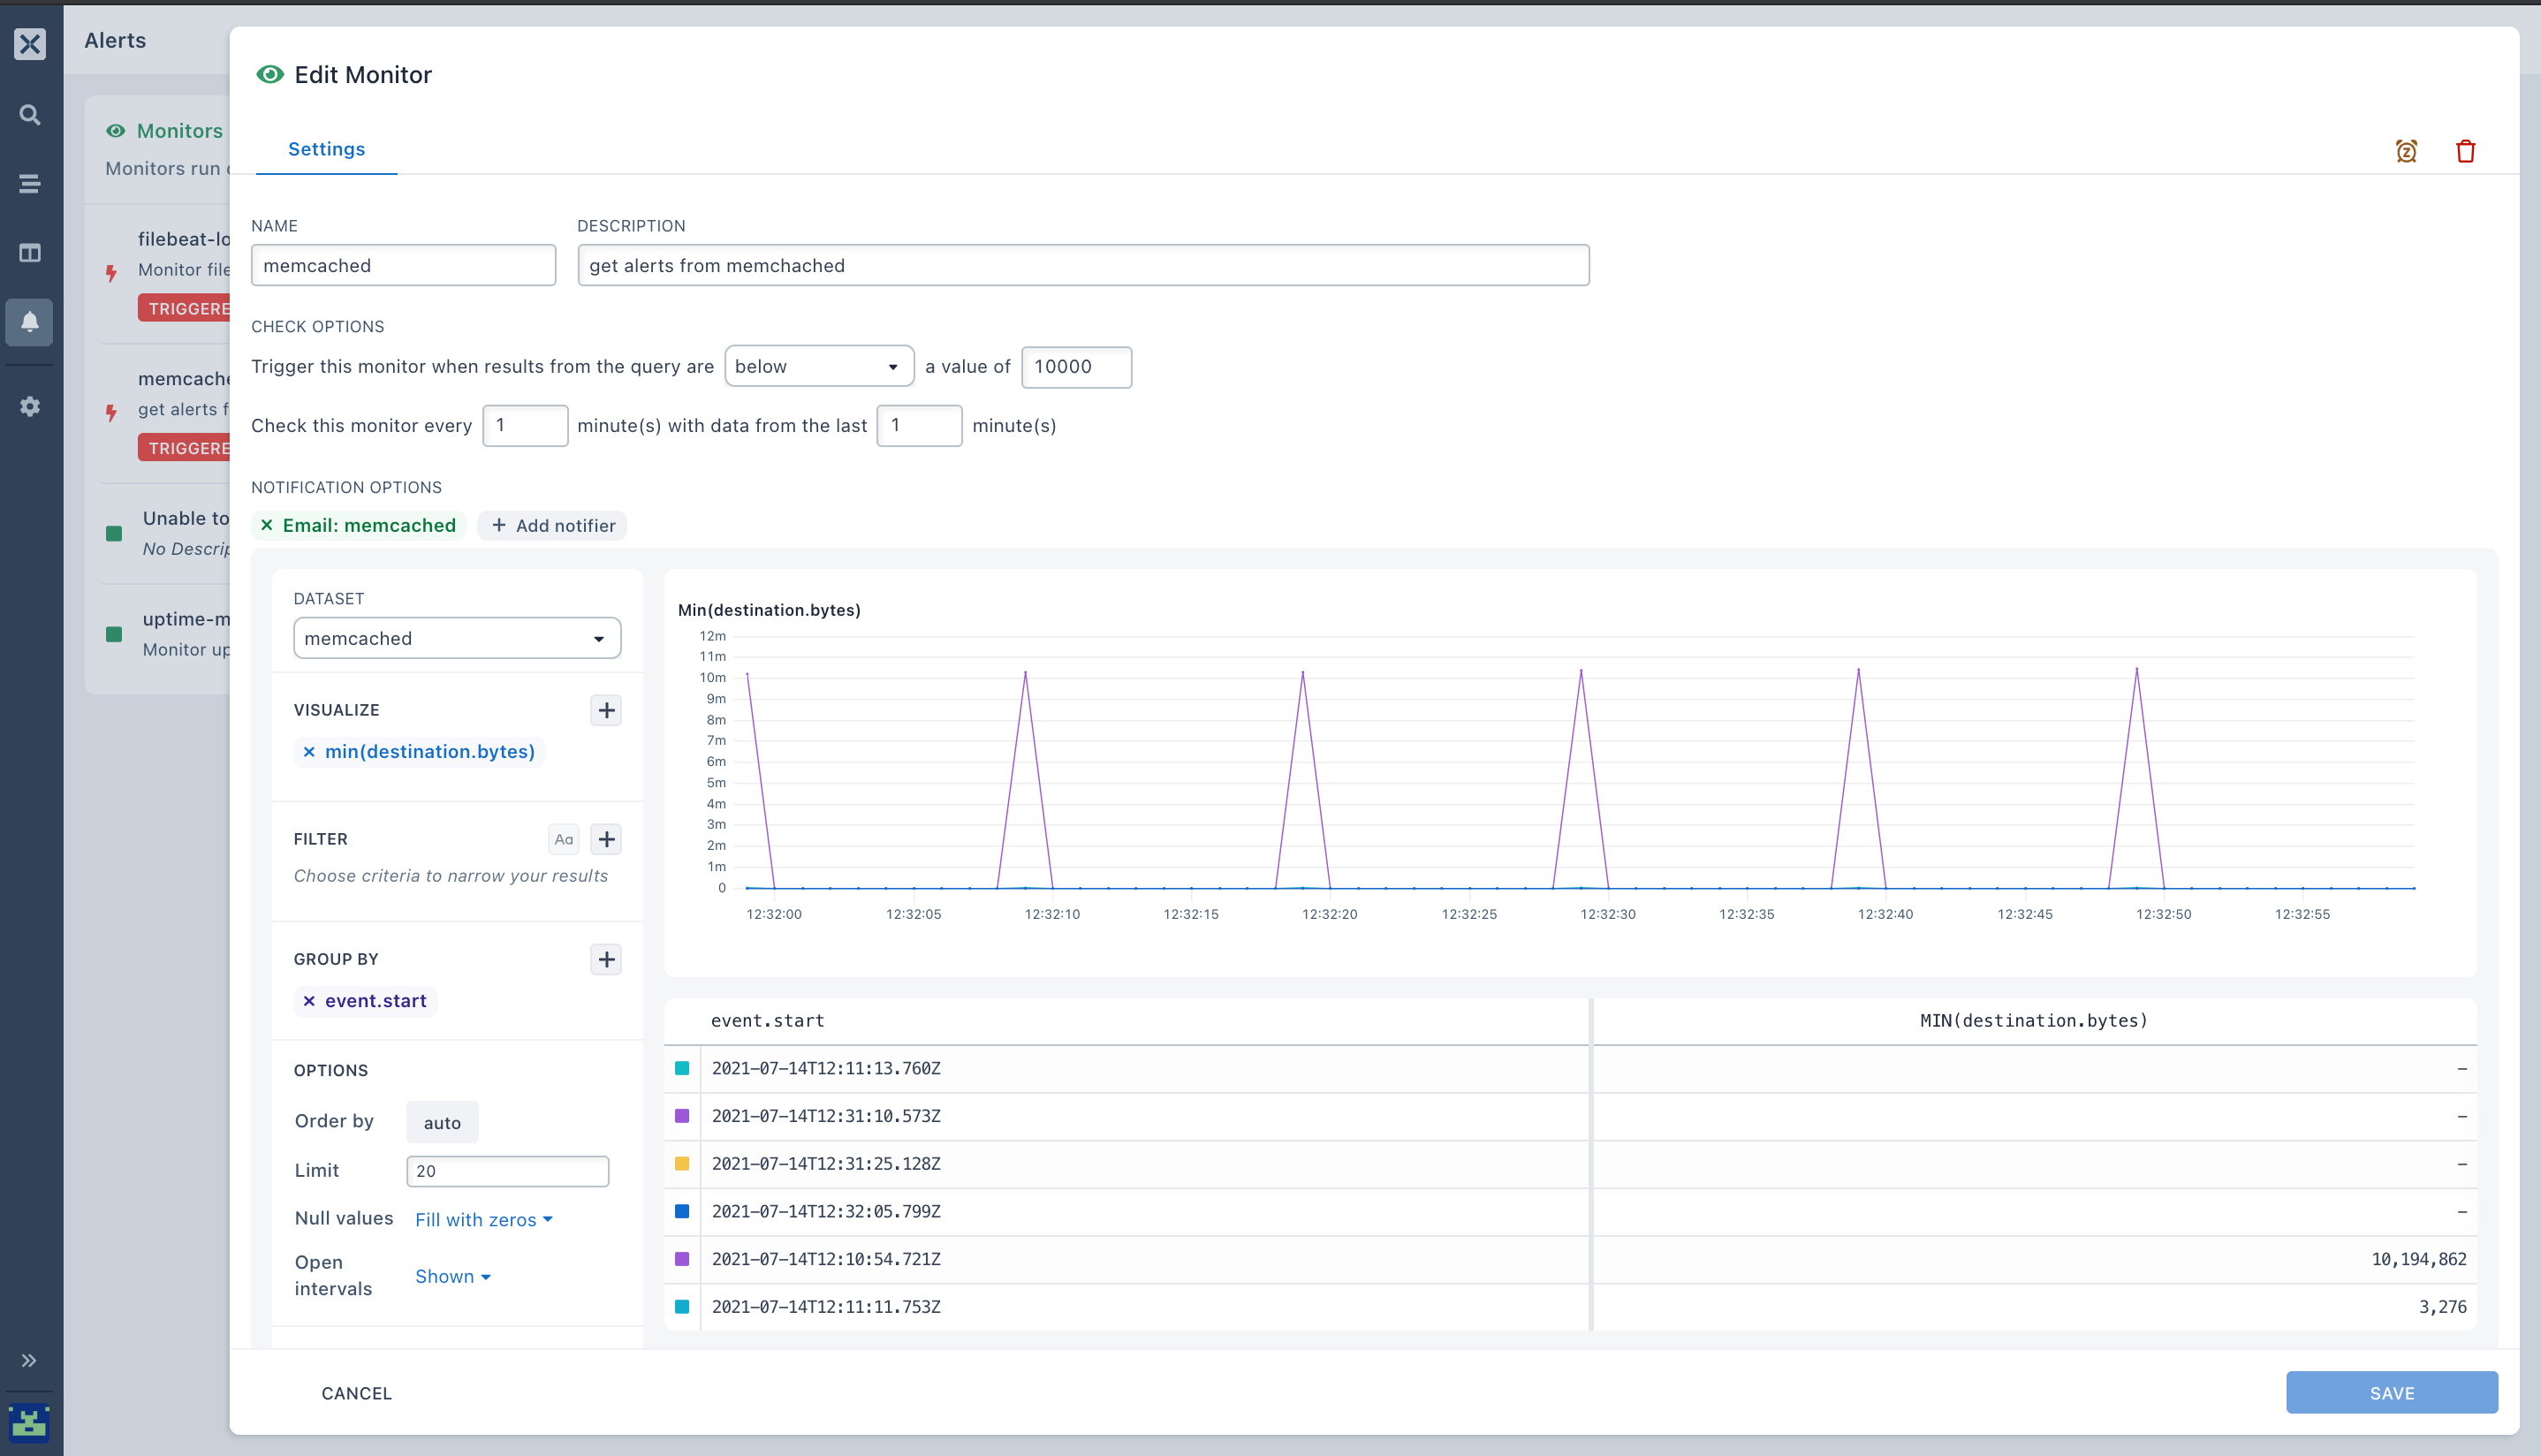
- After you have selected your Notifier, Configure your Monitor.
-
The name of my monitor is: Memcached
-
Description - get alerts from memcached. Inserting a description is very useful especially for your team members so that they can know what exactly your Monitor is for.
-
For Trigger options, I set the comparison type to below the value of 10000. 10000 is the value to compare the results of the network traffic query to. You can input any value you want for your monitor to get triggered.
-
Specify the frequency and time range for your monitor. Here I configured mine to check this monitor for every 1 minute with data from the last 1 minute.
-
Select your notification option. Here I'm selecting the notification via Email which I configured in step 6.
-
Choose the Aggregation type you want to run your Query on. Here I configured my query using the
minaggregation on thedestination.bytesfield. Using theminaggregation, I want to get thelowestamount of network traffic that has fallen below thethreshold valueof 10000.
It will trigger the monitor and send an alert to my email when the minimum network destination bytes is lower or equal to the threshold value of 10000.
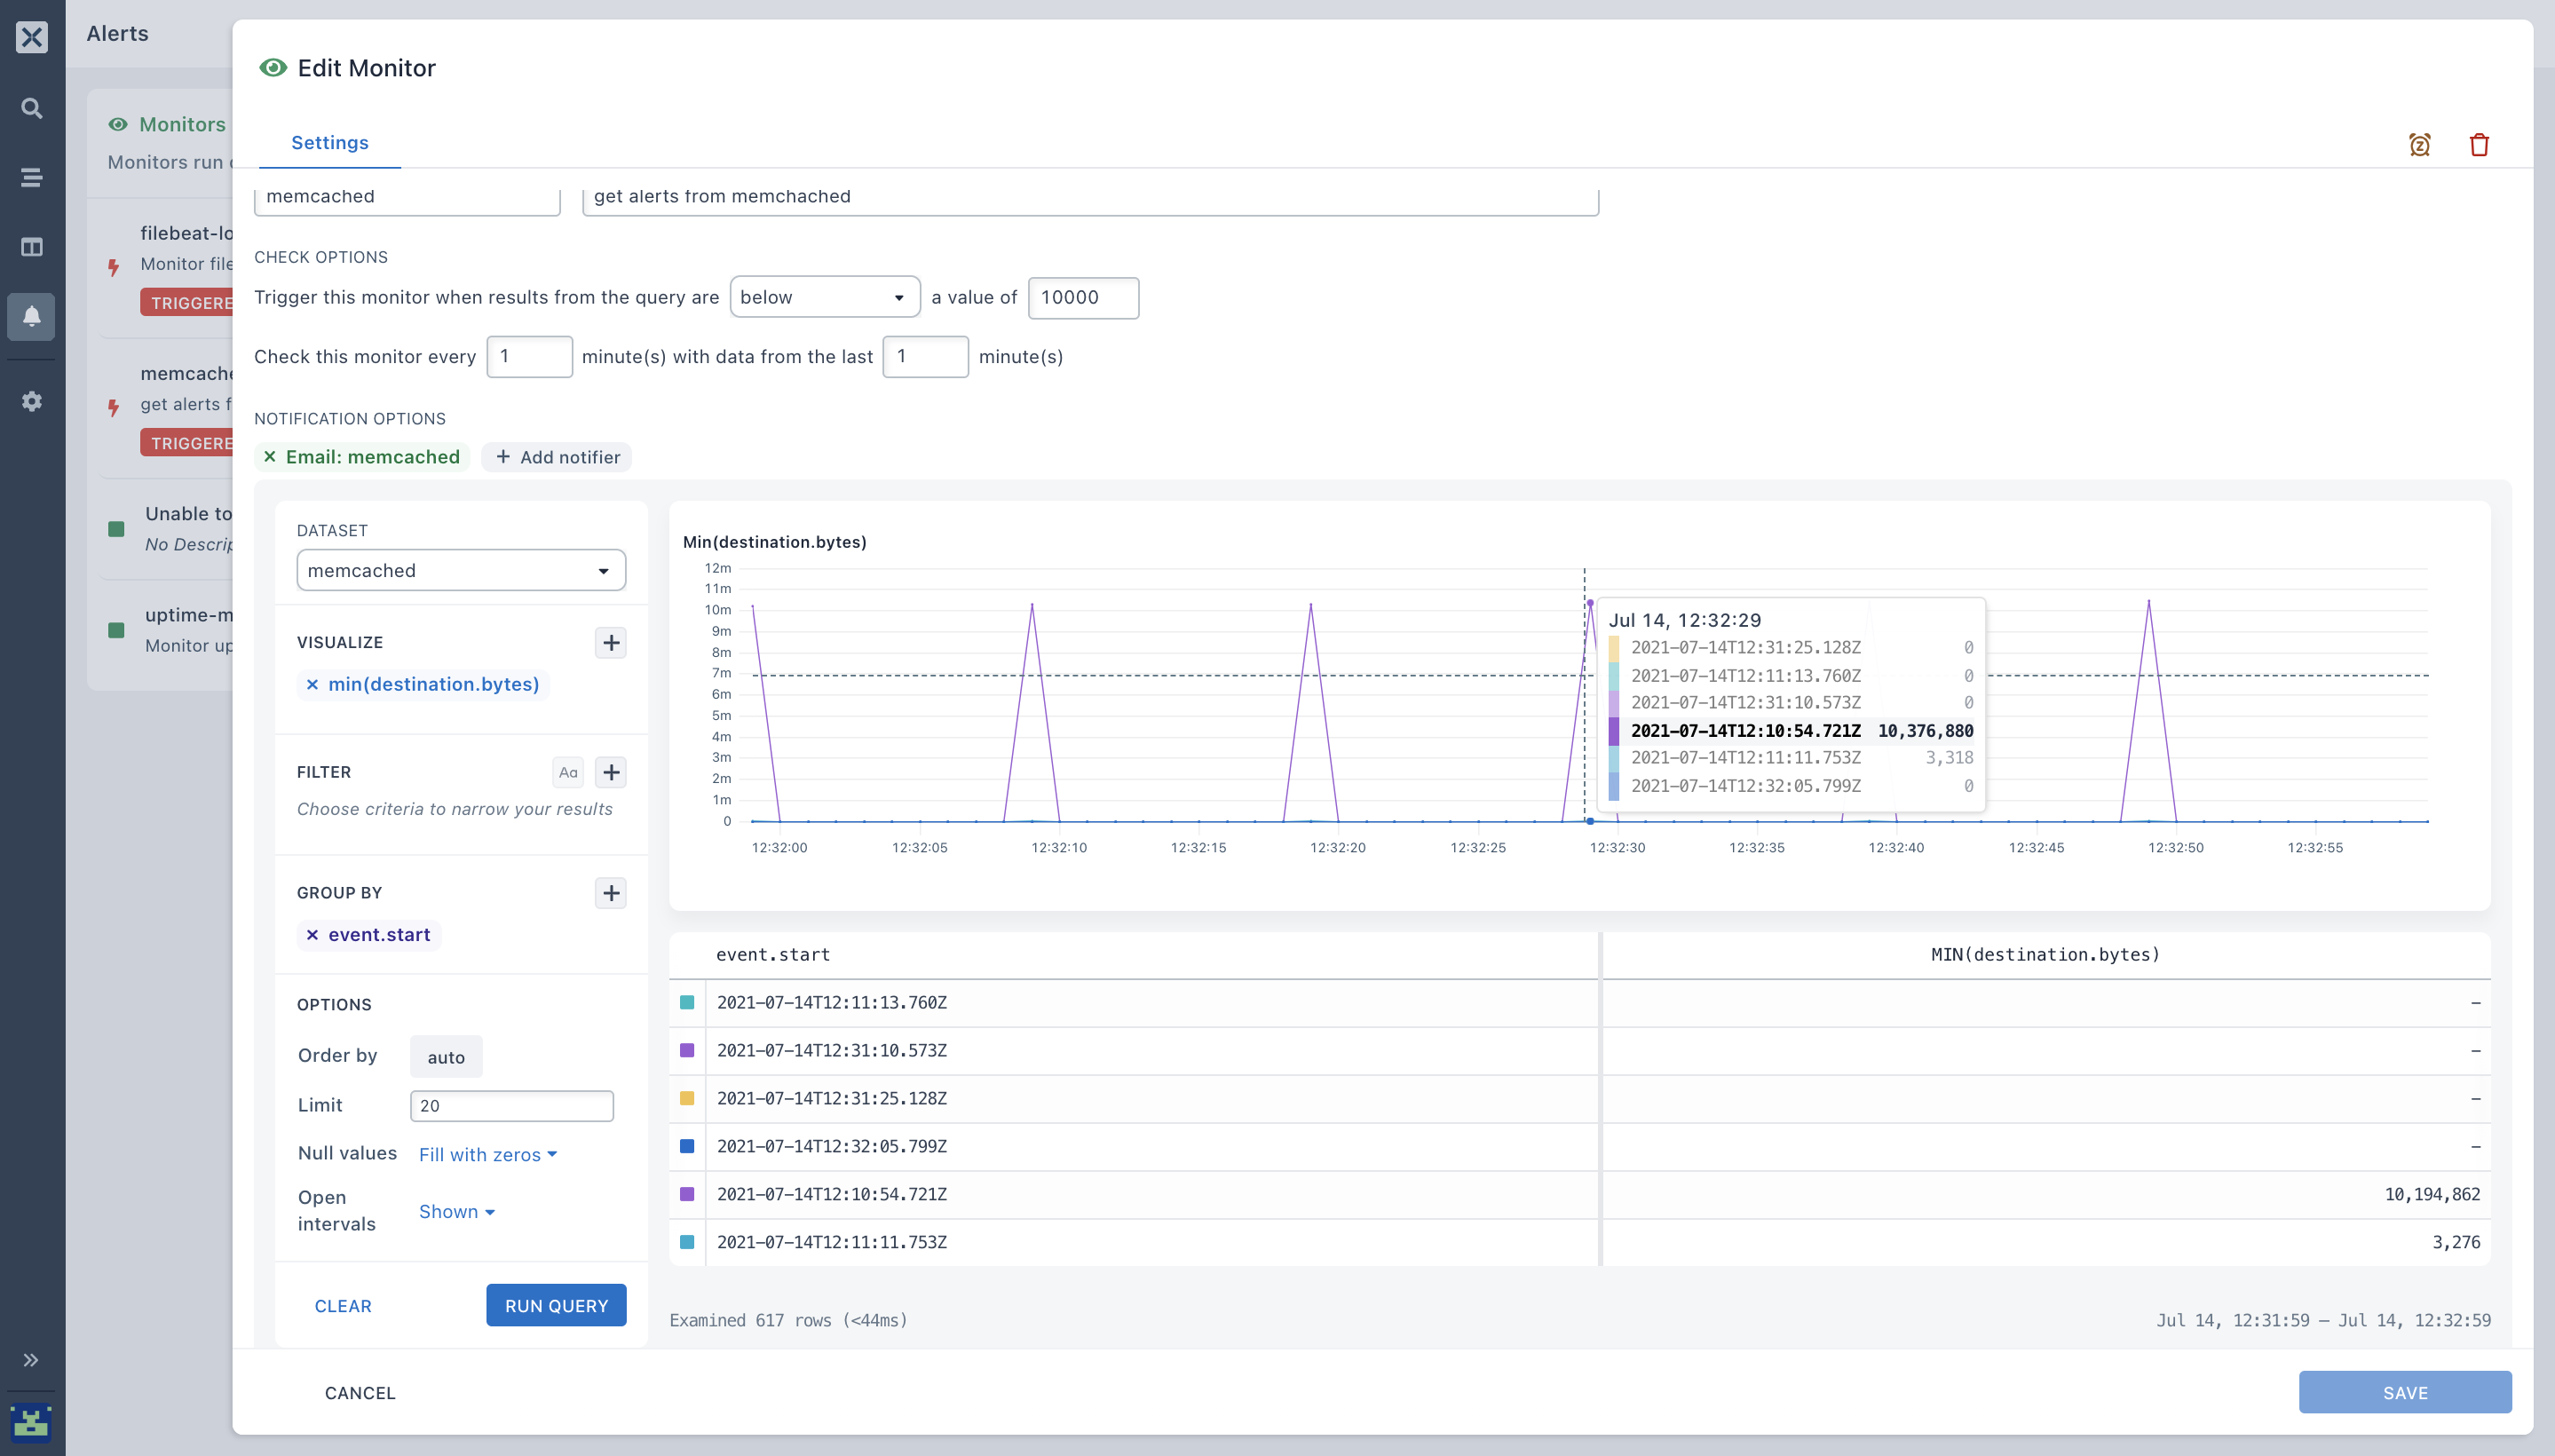
- You can also run the query from your monitor to see the lowest value for the overall time across the time range in the table beneath the chart, but when it reaches the threshold value you set on your monitor, it sends an alert to your E-mail.
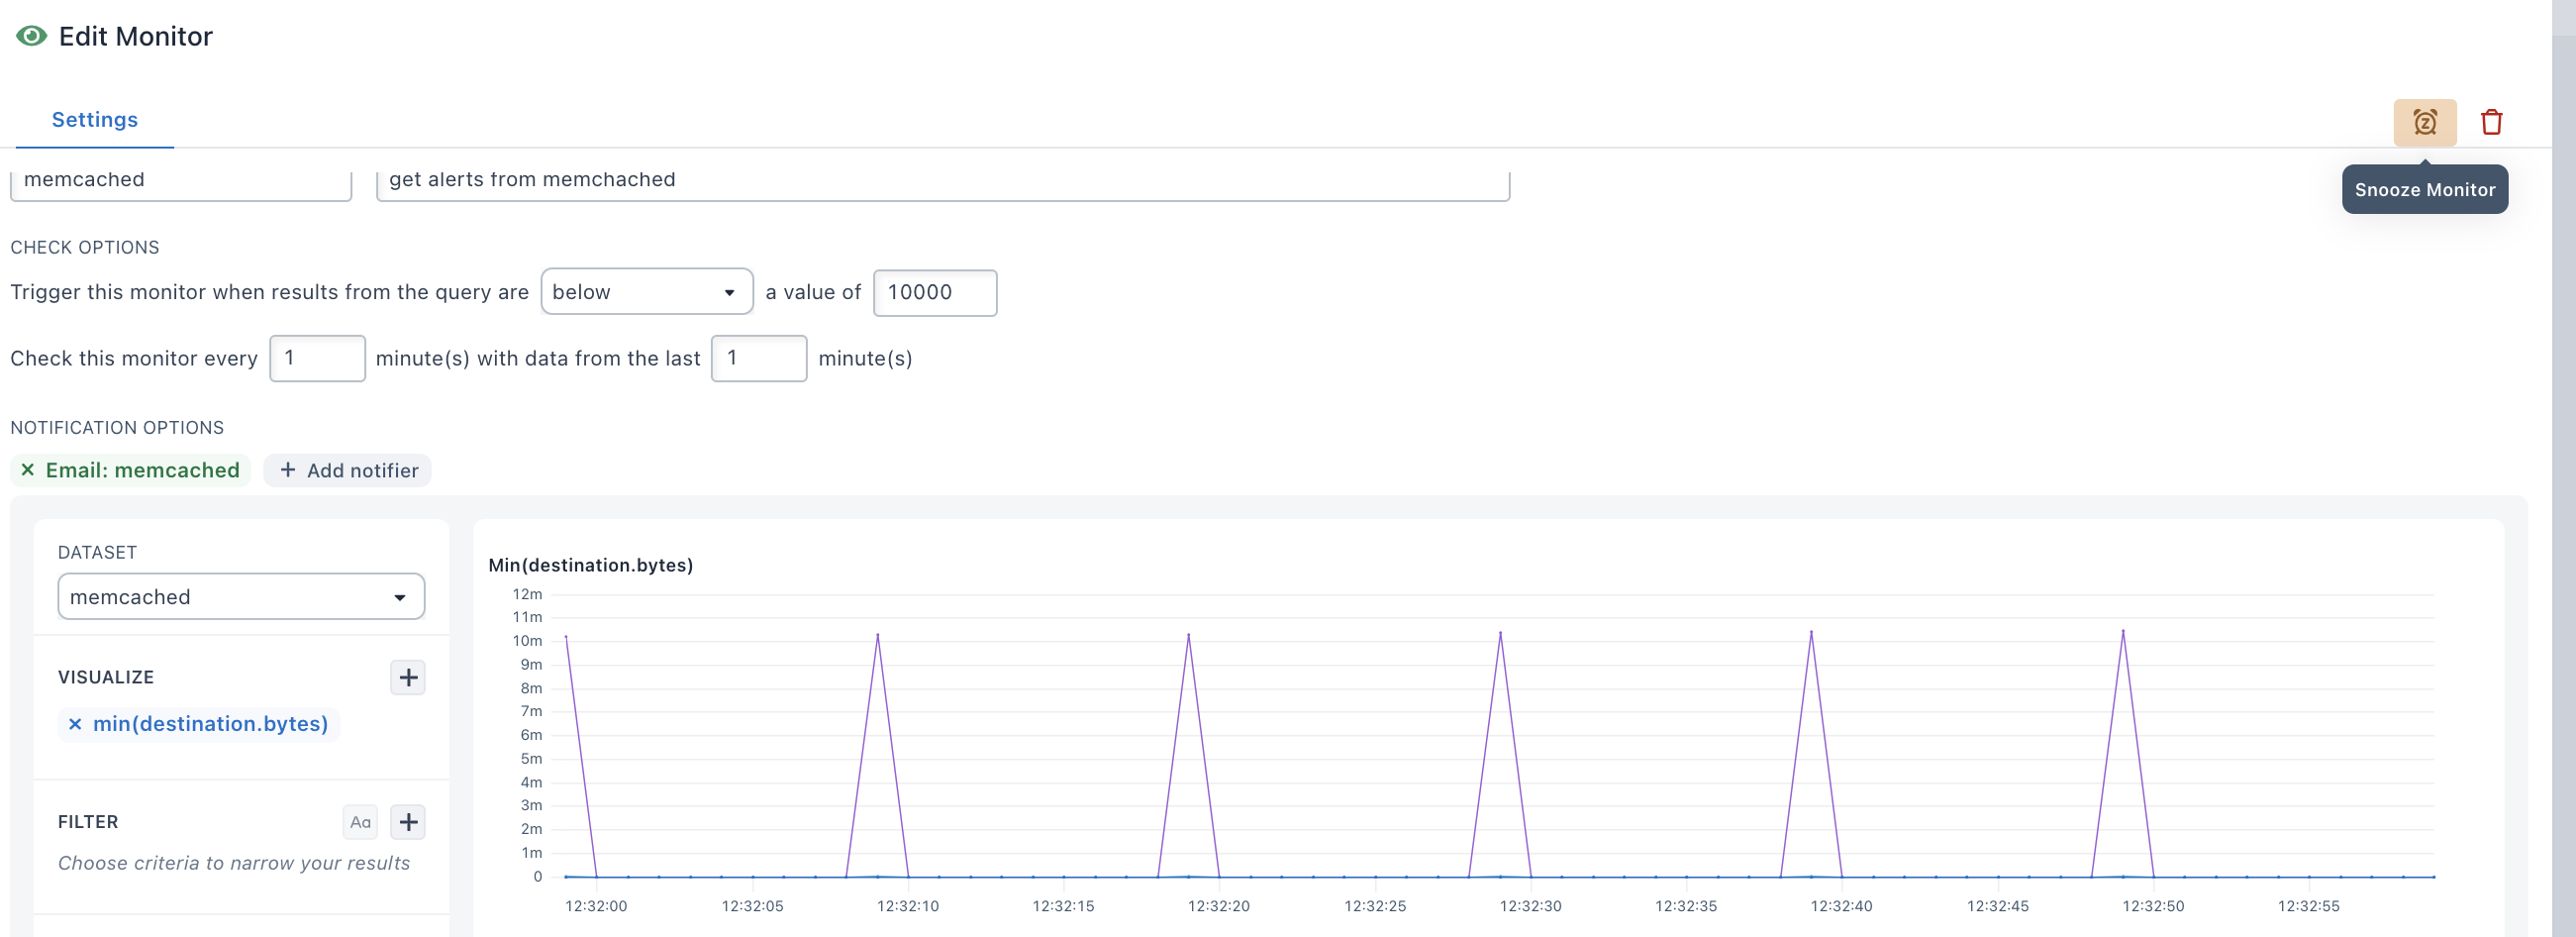
You can snooze your monitor by clicking the alarm clock icon in the slide-out toolbar. By snoozing a monitor, the monitor will carry no checks out until the snooze time is elapsed.
- You can use
GROUP BYto get more specific alerts where necessary, this will trigger your monitor once for every group that is produced by a query. Here, I selected theevent.startfield for myGROUP BY CLAUSE
- Go back to your Monitor’s page,
wait for 1 minute.You will see that the alert has been triggered.
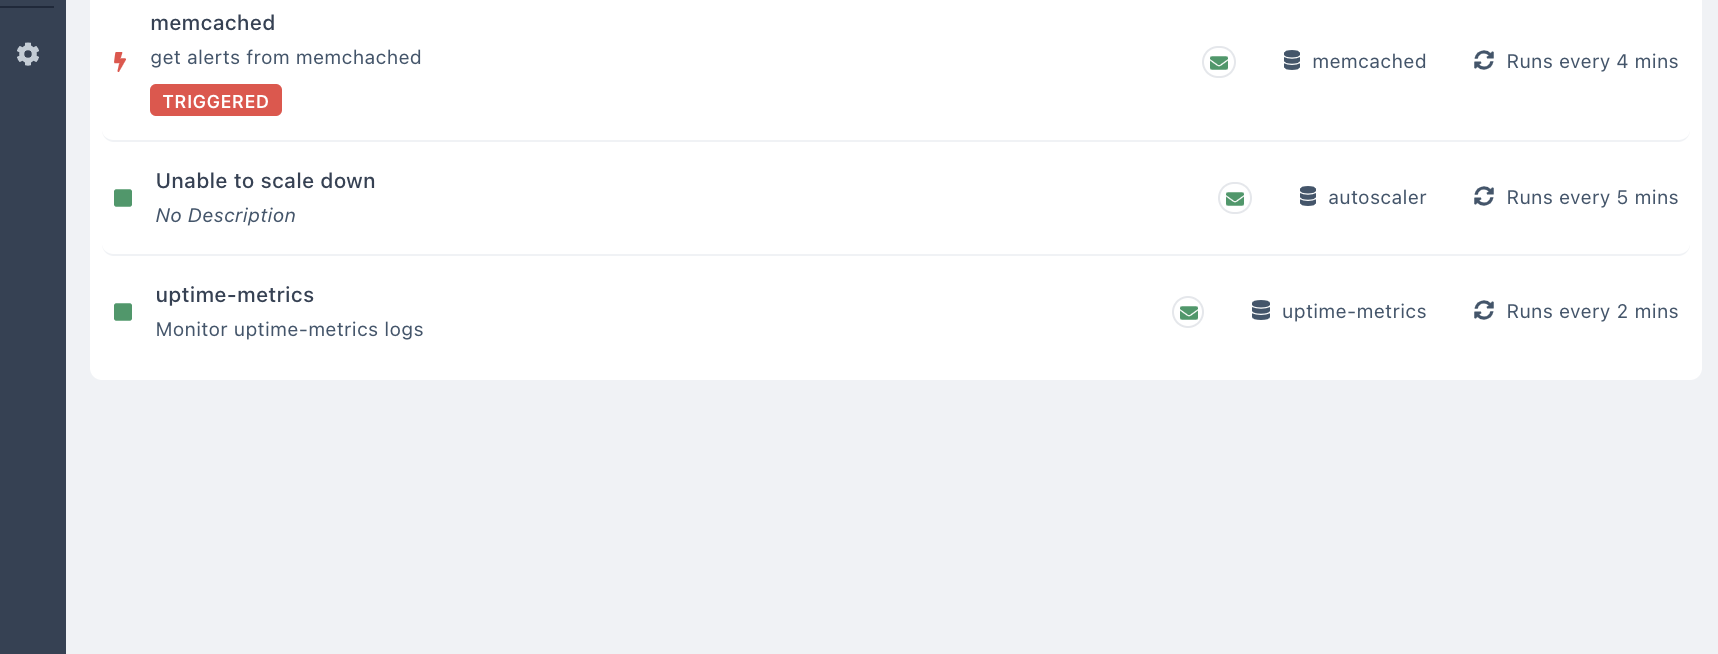
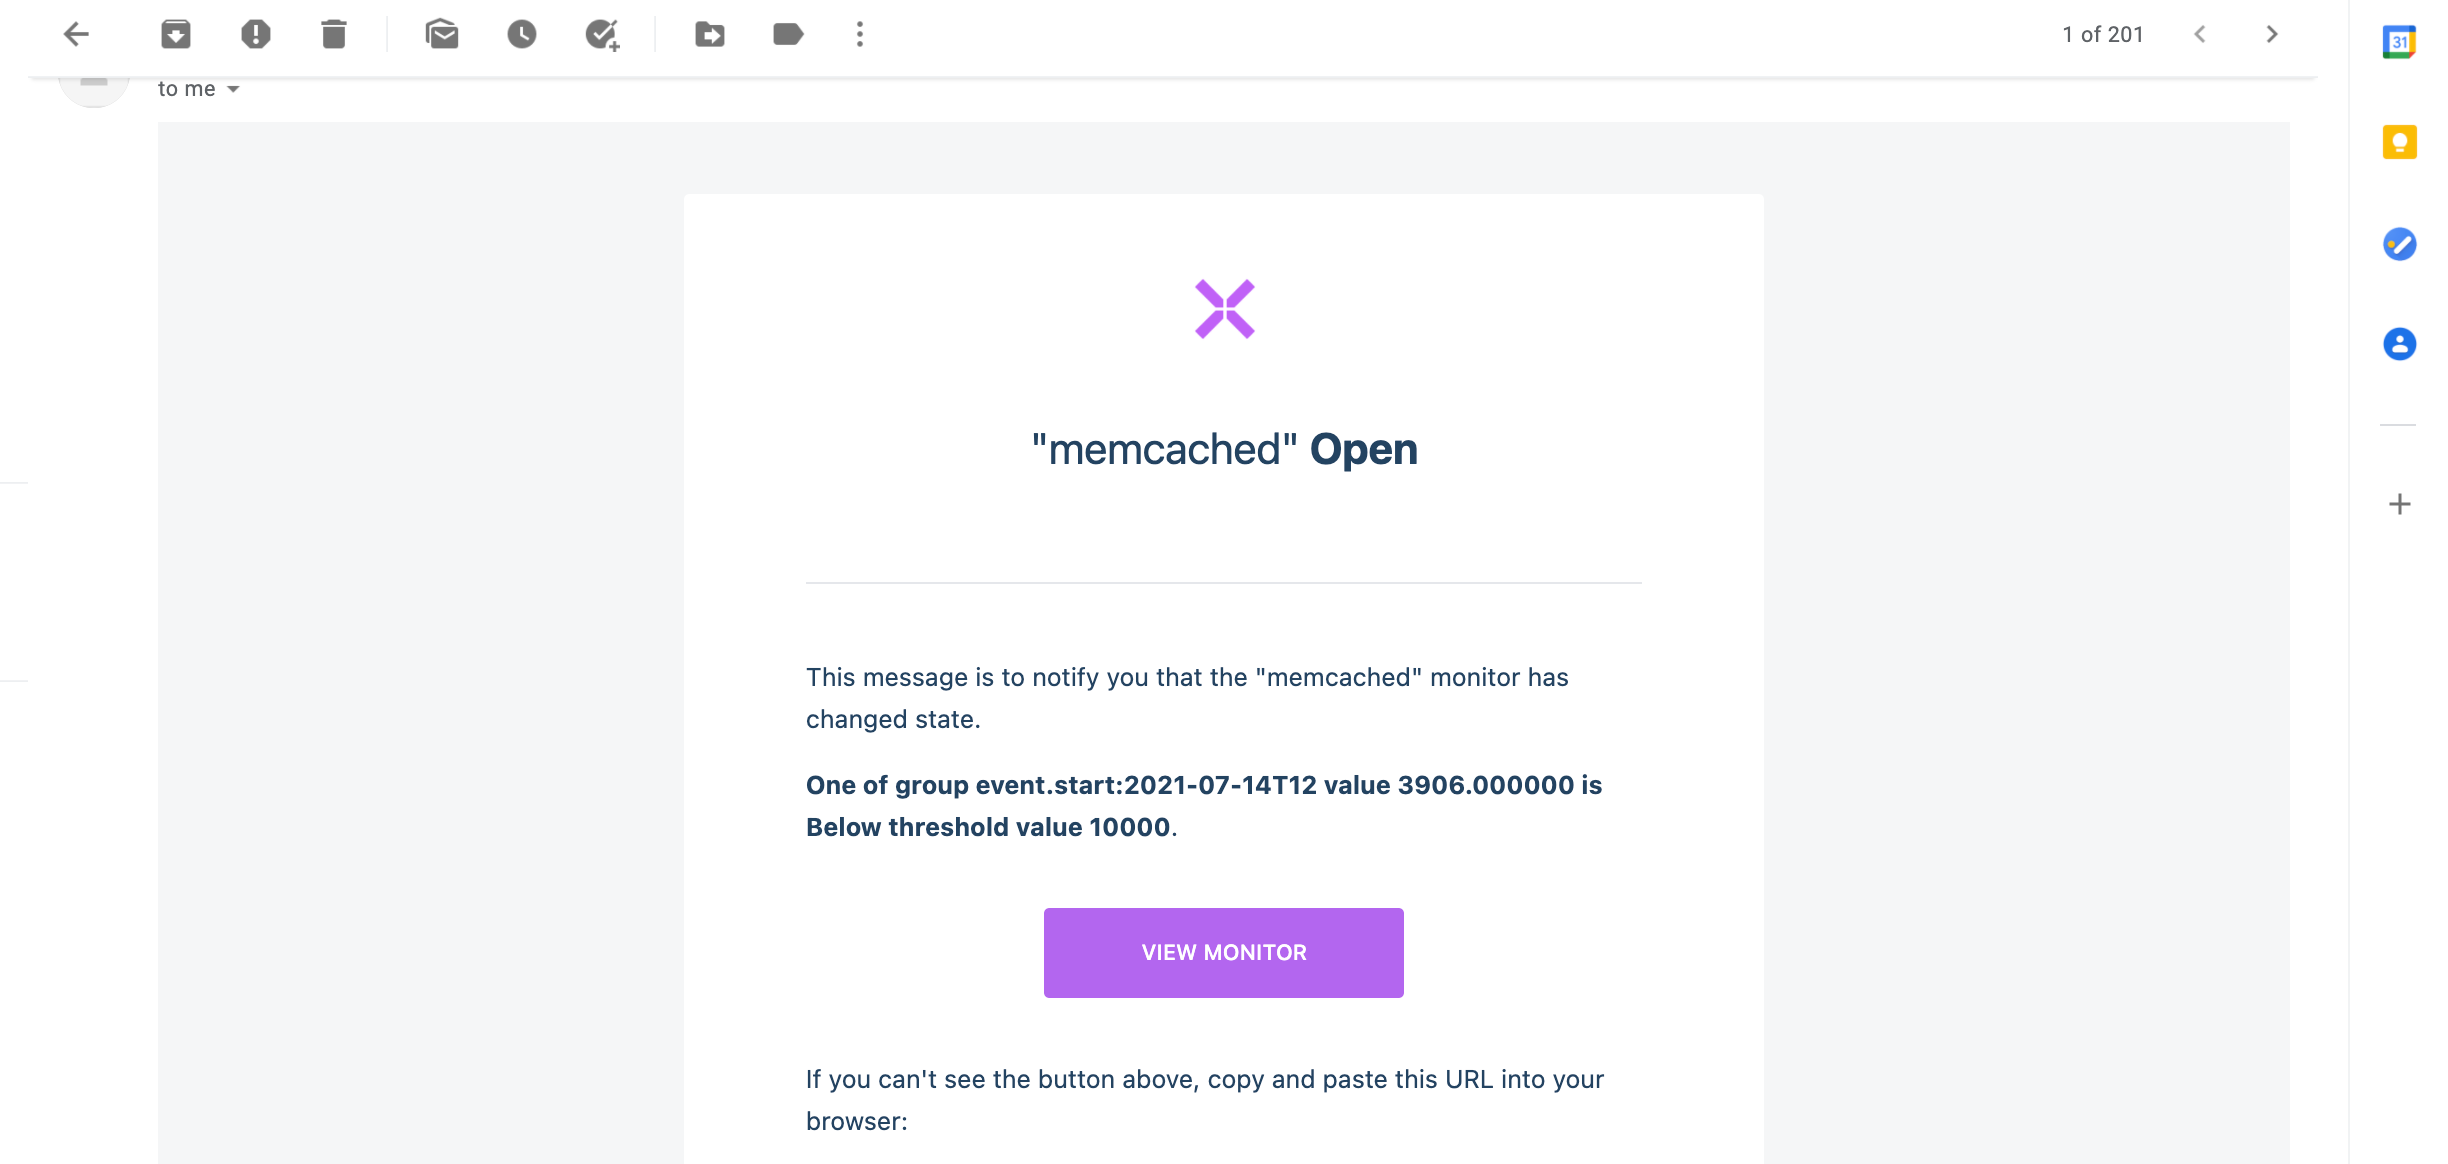
- Go back to your Email or whichever Notifier you configured earlier to see the Notification. I received an email alert that my network logs have changed state.
You can configure your monitors to get triggered at any value, frequency, period, rate, interval, and time range
That’s it? 😇
That’s it! There’s a lot you can do with Axiom.
- Setting up Monitors and Notifiers.
- Working with Aggregations.
- Read more about Packetbeat → Axiom Configuration on our docs
- Configuring Memcached fields
If you have specific questions or issues configuring the file, I'd love to hear about them. Contact us here or ask a question in our Discord community!
You can also follow us on Twitter and on our blog. And if you’ve enjoyed this post, please, take a second to share it on Twitter.
Stay tuned for our next blog post 😇


