
For you to maintain the health, visibility, and performance of your applications, you need to monitor Elasticsearch logstash configuration between all of your application’s dependencies and events.
Logstash pipeline is a centralized data processing config pipeline that lets you read data from various json and conf sources, and filter, transform, and extract DevOps data directly to your configured syslog output.
Logstash dynamically ingests, transforms persistent queues, and ships your TCP and UDP data regardless of format or complexity. Derive structure from unstructured data with grok, decipher geo coordinates from IP addresses, anonymize or exclude sensitive logstash pipeline fields, and ease overall codec processing.
By combining Logstash with Axiom, you can monitor and ship your logstash pipeline data. Using our advanced config query language enables you to visualize all your elasticsearch data from any config file input. Your engineering team will be able to collect all logstash pipeline logs, monitor apache and visualize logstash metrics applications with Axiom dashboards, correlate stdout logs, and set alerts with Axiom elasticsearch monitors.
For deep insights into your application health, you can analyze traffic efficiency between your logstash pipeline events using Axiom Data Explorer. Axiom maps all of your application dependencies so you can know how much data your logstash pipeline system is producing, and where the logstash instance data is coming from.
Use Axiom to collect and monitor all your logs in your Logstash pipeline. If your engineering team is running logstash, read on to learn how we can help
Prerequisites
In this tutorial, you will be able to:
- Analyze your logstash logs directly on Axiom.
- Gather live events on your Logstash data.
- Customize dashboard and run Aggregations.
Combining Logstash and Axiom for Observability
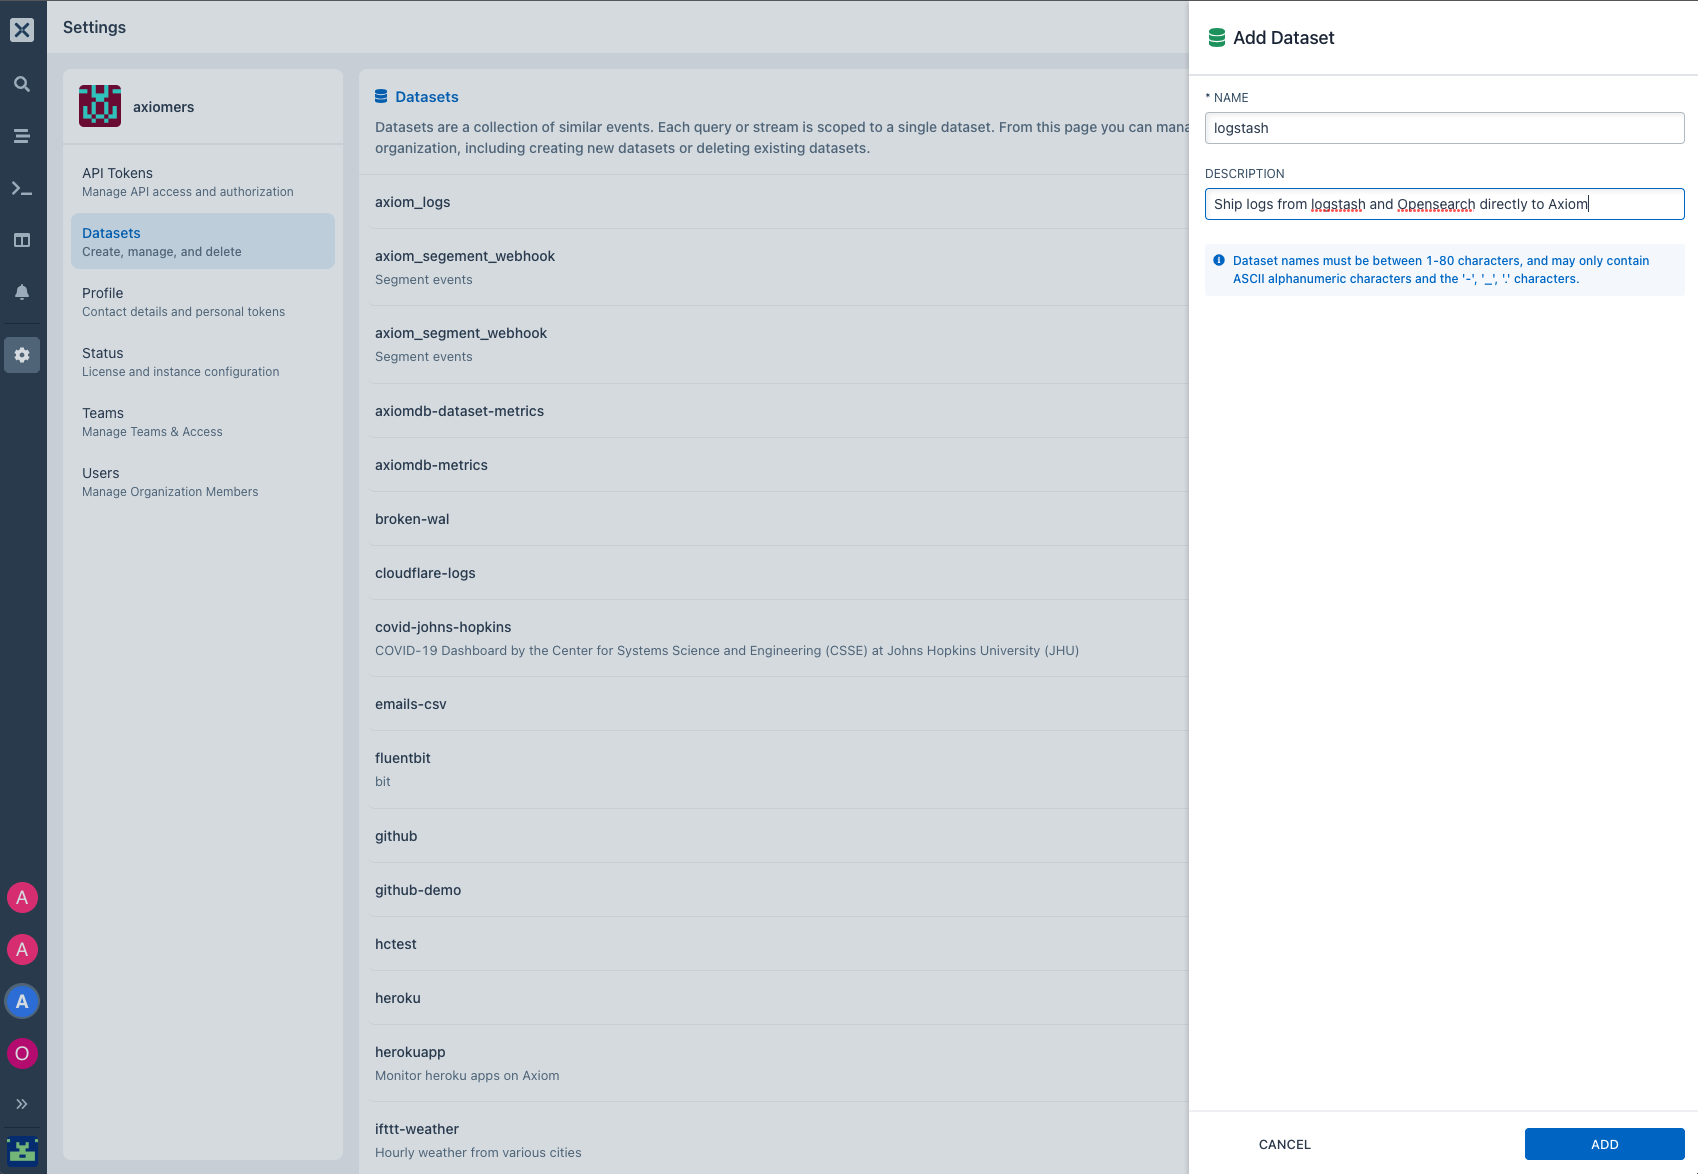
- Create your dataset for your logstash data by selecting Settings → Datasets on the Axiom UI
- Generate your API token,
- On the Axiom UI, click on settings, select API Tokens.
- Select Add ingest token.
- Enter a name, description and select the permissions you want to give your token. You can choose Ingest and Query, Ingest or Query permissions for your token.
- Copy the generated token to your clipboard. Once you navigate from the page, the token can be seen again by selecting API Tokens.
- Next, head over to our logstash configuration page, copy, edit and configure your
input,filter, andoutputstage.
input{
  exec{
    command => "date"
    interval => "1"
  }
}
output{
  opensearch {
    hosts => "https://app.axiom.co:443/api/v1/datasets/$DATASET_NAME/elastic"
    user => "axiom"
    password => "xaat-xxxx-xxxxxx-xxxxx"
  }
}- In your configuration,
https://app.axiom.co:443is your Axiom Cloud account URL. $DATASET_NAMEis the name of your dataset which we created in step 1passwordis your API Token we created in step 2.
- When you are done configuring your output stage, you can now run your logstash pipeline configuration and ship your logstash reference logs directly to Axiom. Visit the datasets tab; you will see your logstash logs ingested into your dataset.
- In our configuration, I’m running my logstash configuration using Docker
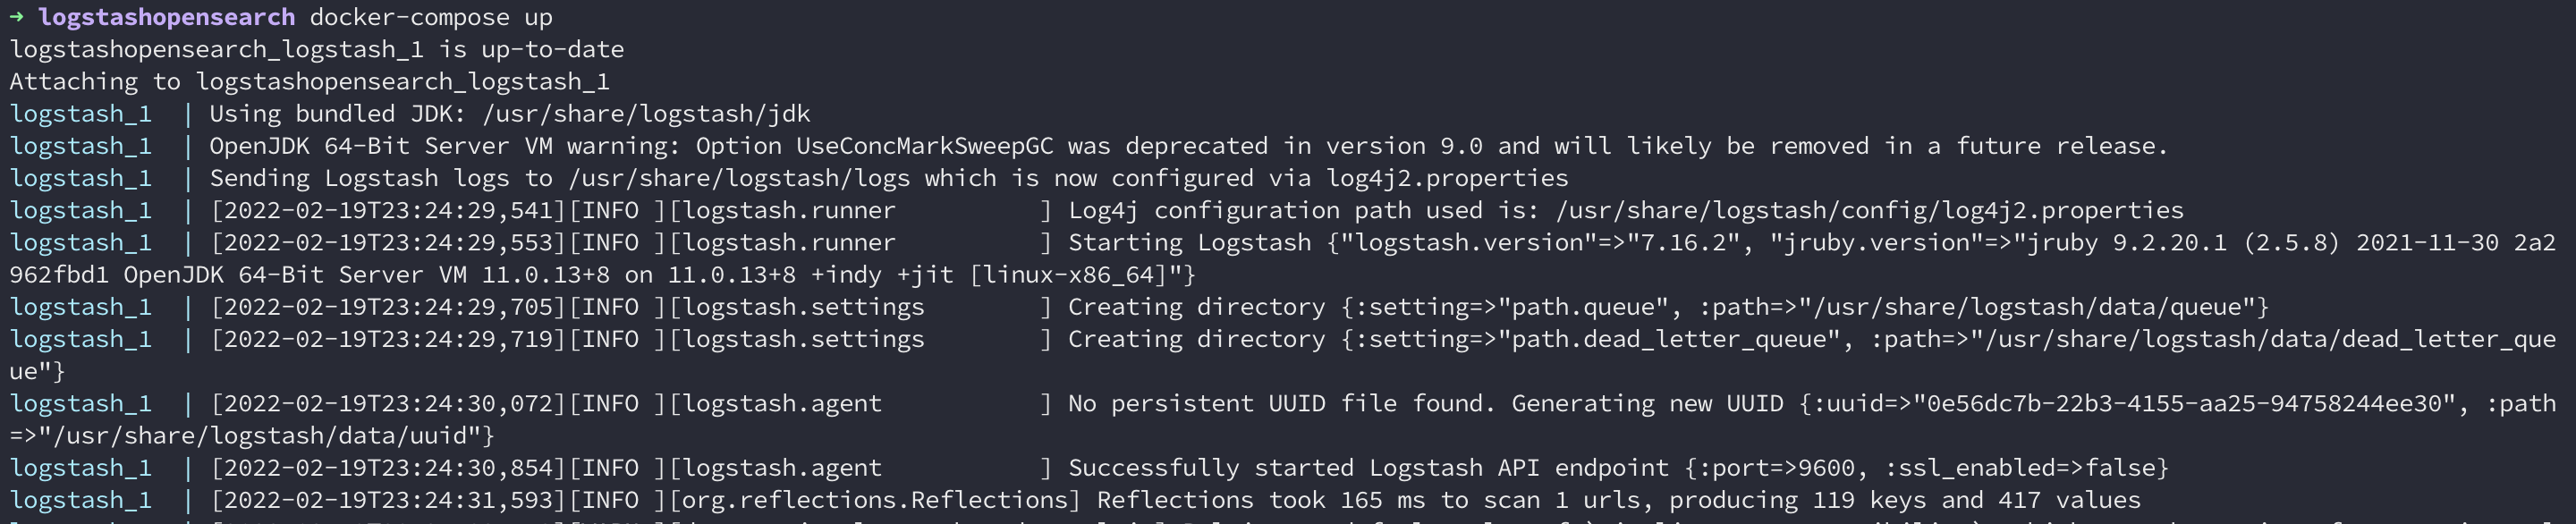
- and running the commands from using the opensearch output plugin using
docker-compose
logstash:
  image: opensearchproject/logstash-oss-with-opensearch-output-plugin:7.16.2
  volumes:
    - ./logstash/pipeline/:/usr/share/logstash/pipeline/
  ports:
- '9600:9600'- Next, in the logstash dataset in your Axiom Cloud console, you can see your Logstash data directly in your dataset view.
- On your logstash pipeline dataset, you can run rubydebug queries using our operators and metrics functions directly on Data Explorer.
-
With Axiom Data Explorer, you can explore use cases and monitor your logstash pipeline logs, get timestamp insights into how your stdin applications perform over time, and run super-fast elasticsearch queries in seconds.
-
On the Axiom dashboard, select the fourth (4th) icon on the pane, the Data Explorer dashboard, and click on your dataset. The syntax of the tabular mutate expression tabular flow from one logstash pipeline query operator to another, starting with your logstash dataset, and then flow through a set of filebeat data operators and syslog functions that are bound together through the use of the elk stack pipe
|delimiter.
Explore different operators and functions with Axiom Data Explorer:
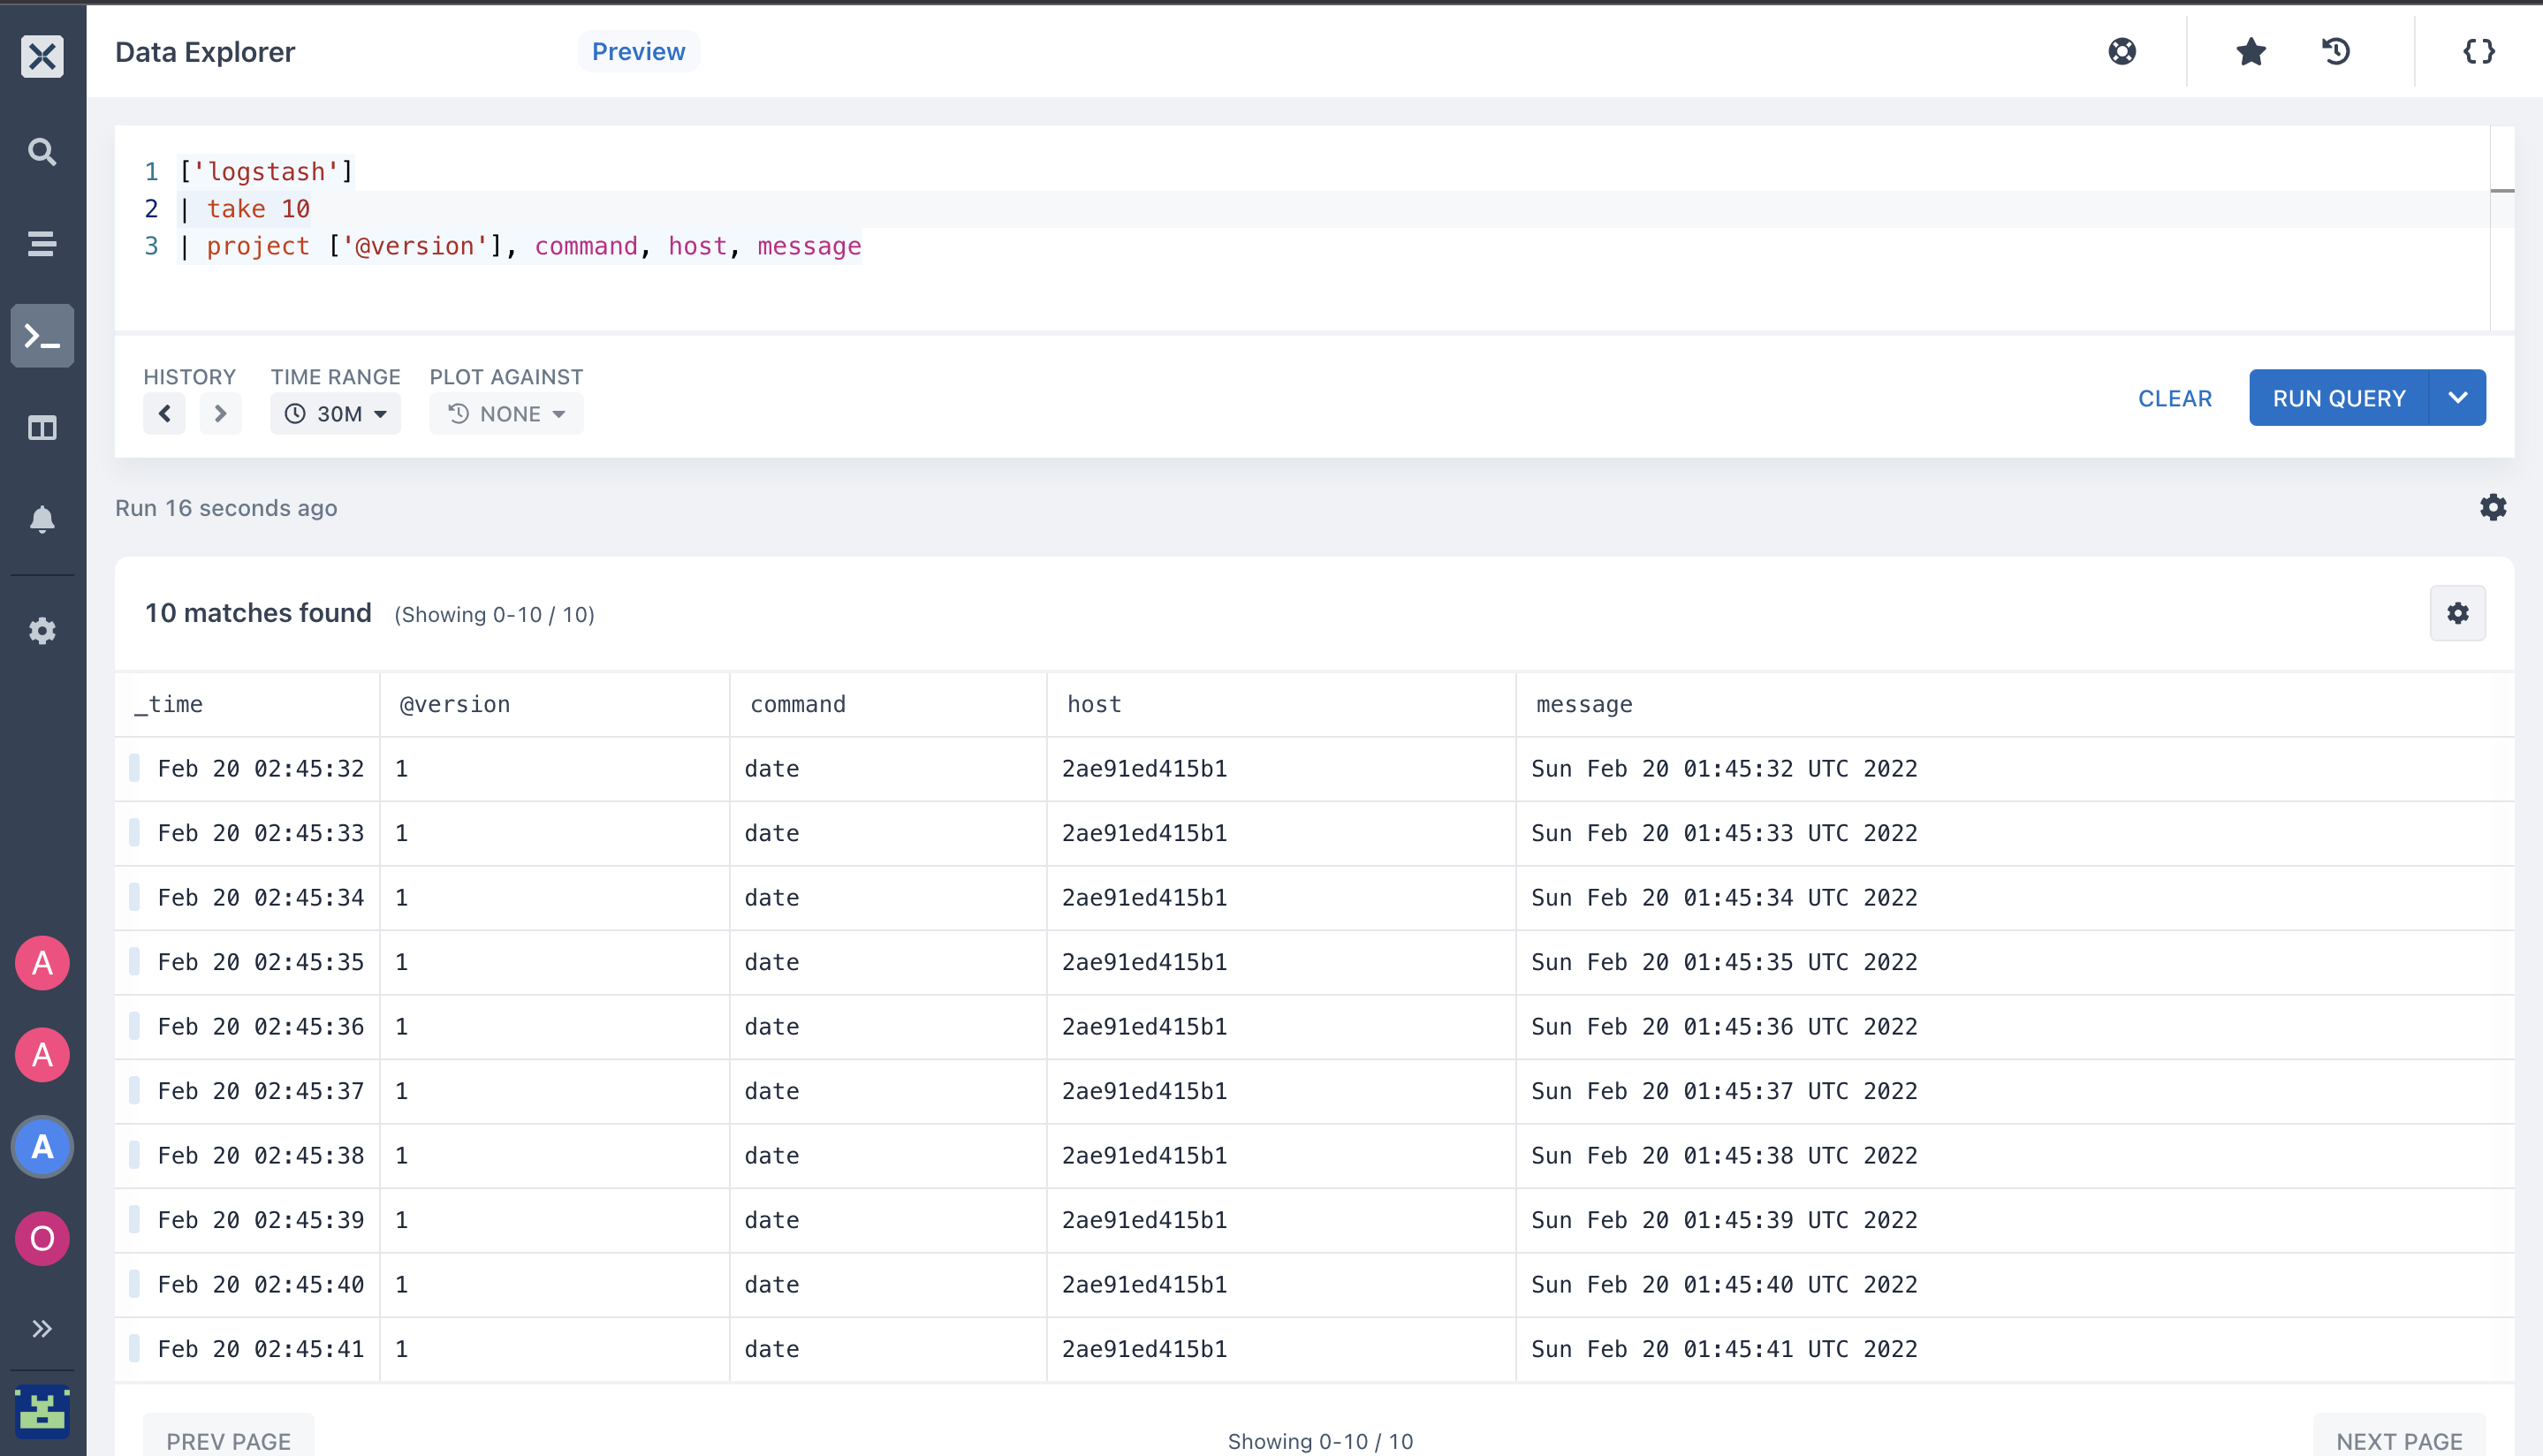
- Project Operator: Use the
projectoperator to select logstash pipeline fields to insert and embed new syslog columns. The following query returns a specific set of logstash reference fields as columns.
- In the query below, we are inserting the
project@versioncommandhostandmessagefields from our logstash data
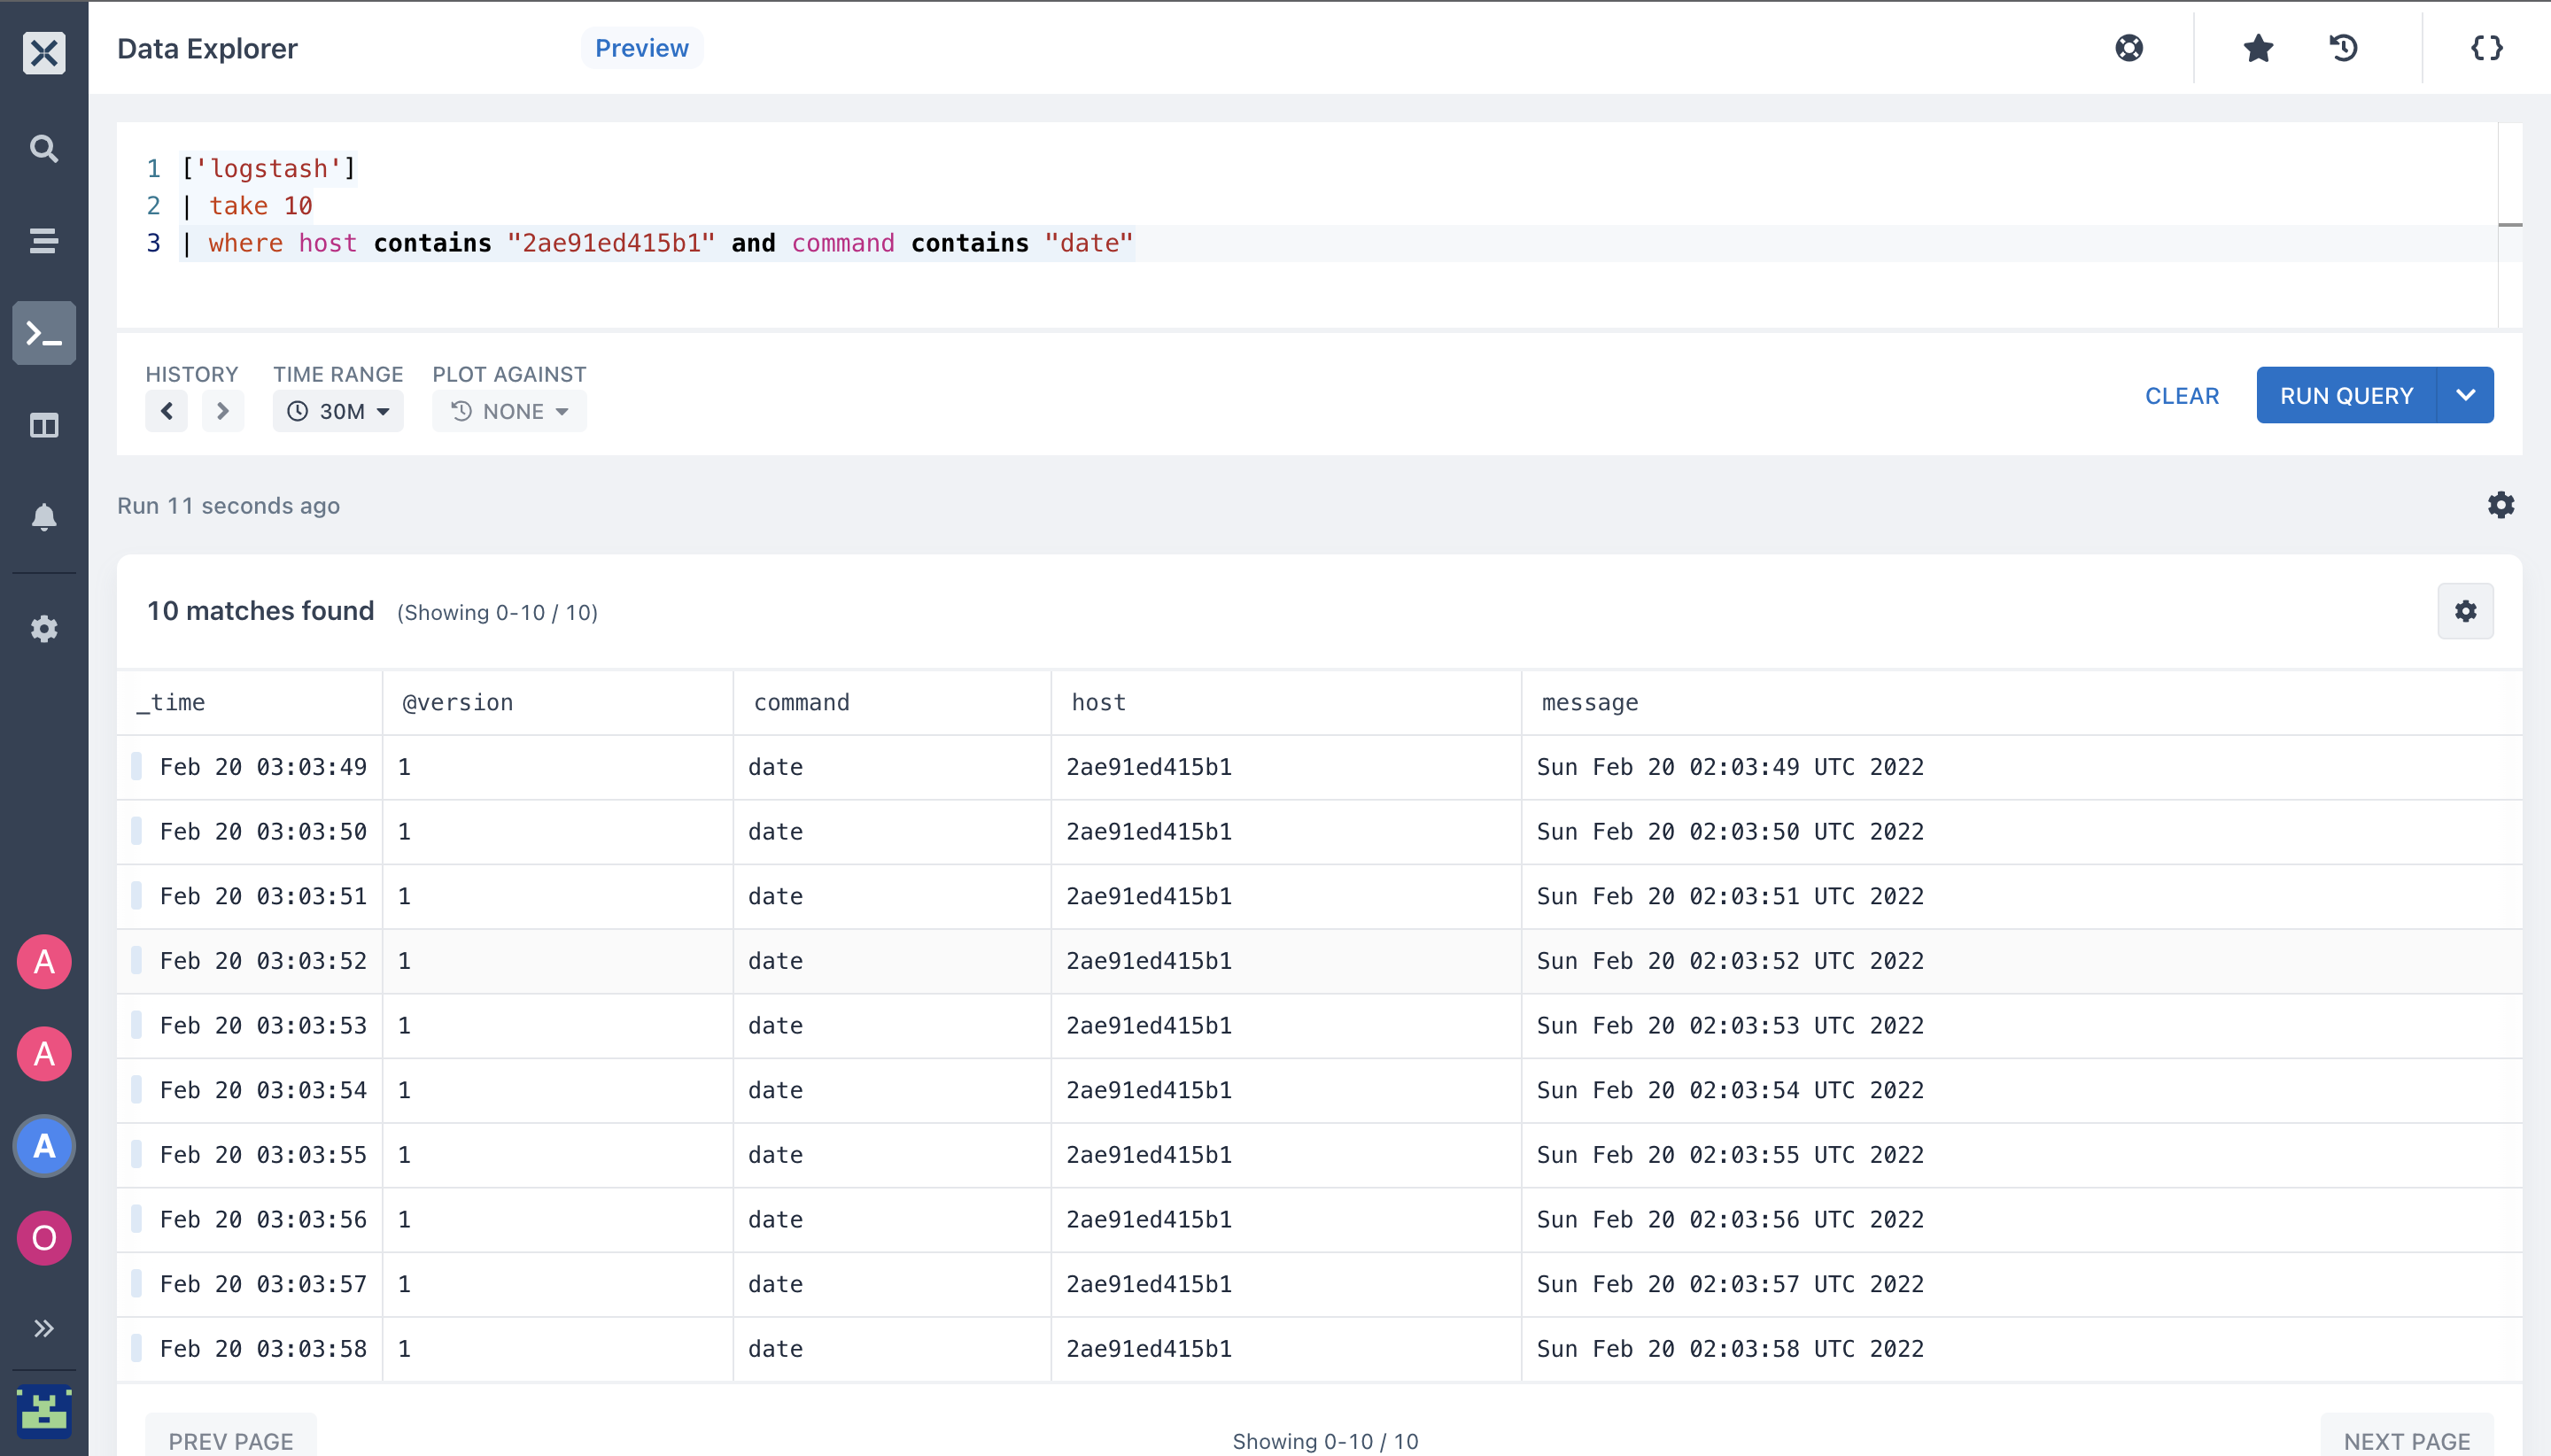
- Where: Filters out a dataset to a branch of rows that meets a condition when executed.
- The query below filters our logstash data by the
hostandcommand
- summarize operator: Produces a table that aggregates the content of the dataset.
The summarize operator groups together rows that have the same values in the by clause. In the query below, the logstash pipeline aggregation functions (count and topk) combine each group into one pipeline.id row.
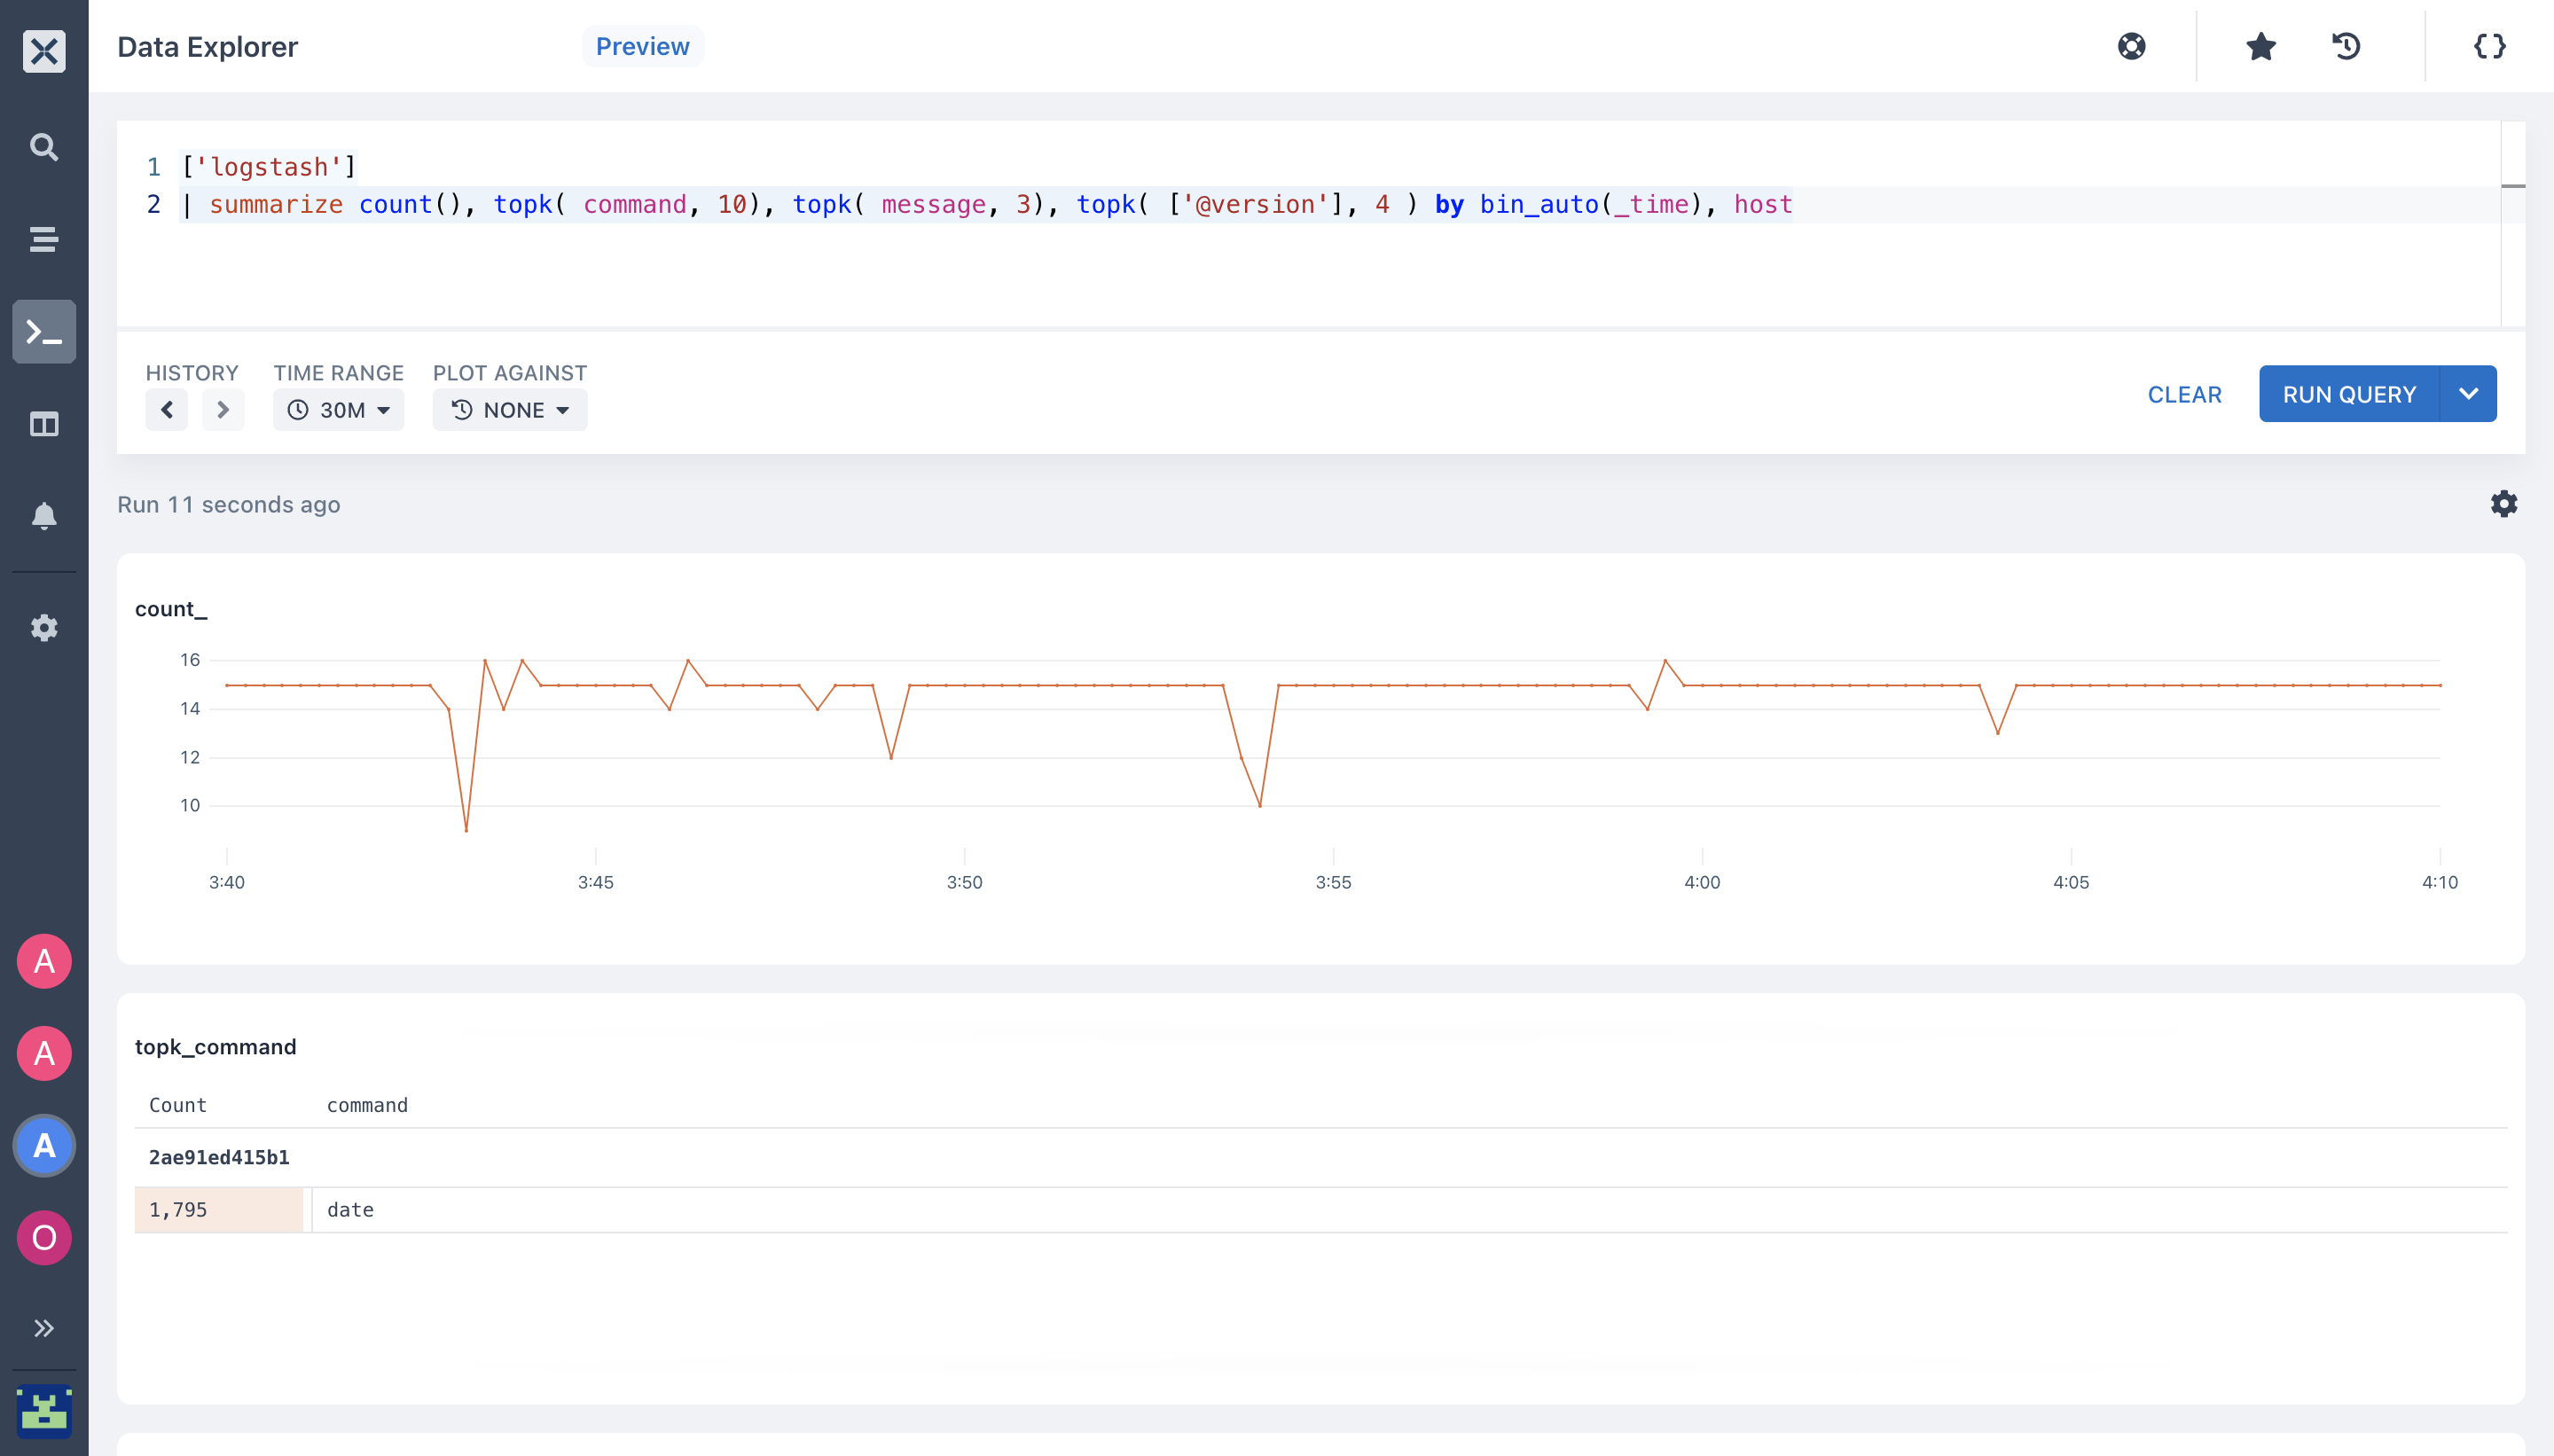
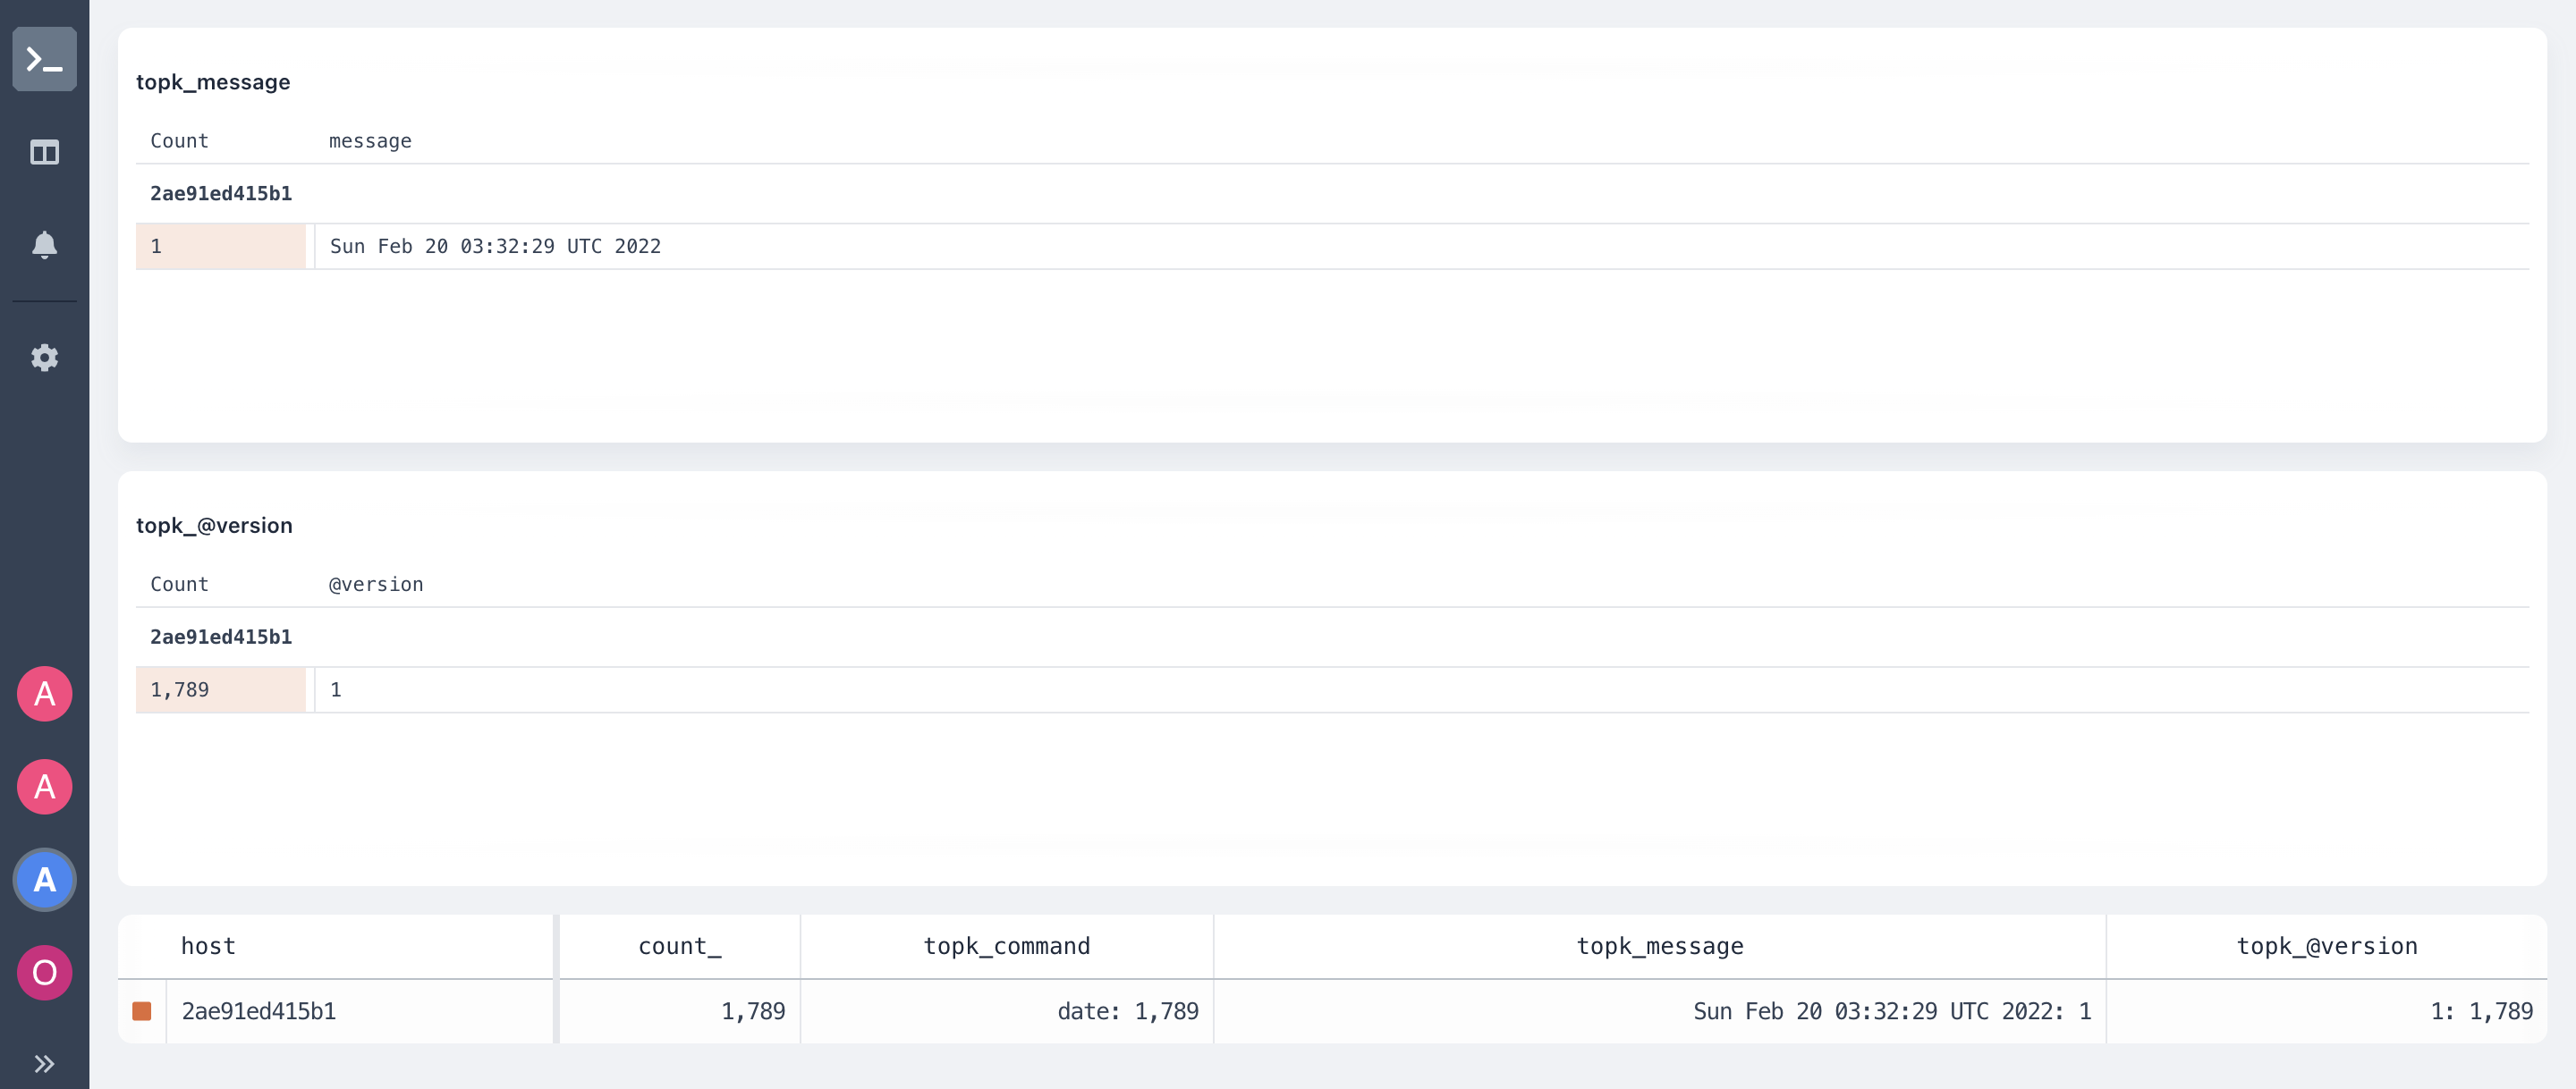
- In the query below, there is a row for
topk_messagetopk_commandtopk_@versionand a column for each filter plugins aggregationfieldin the logstash pipeline operator.
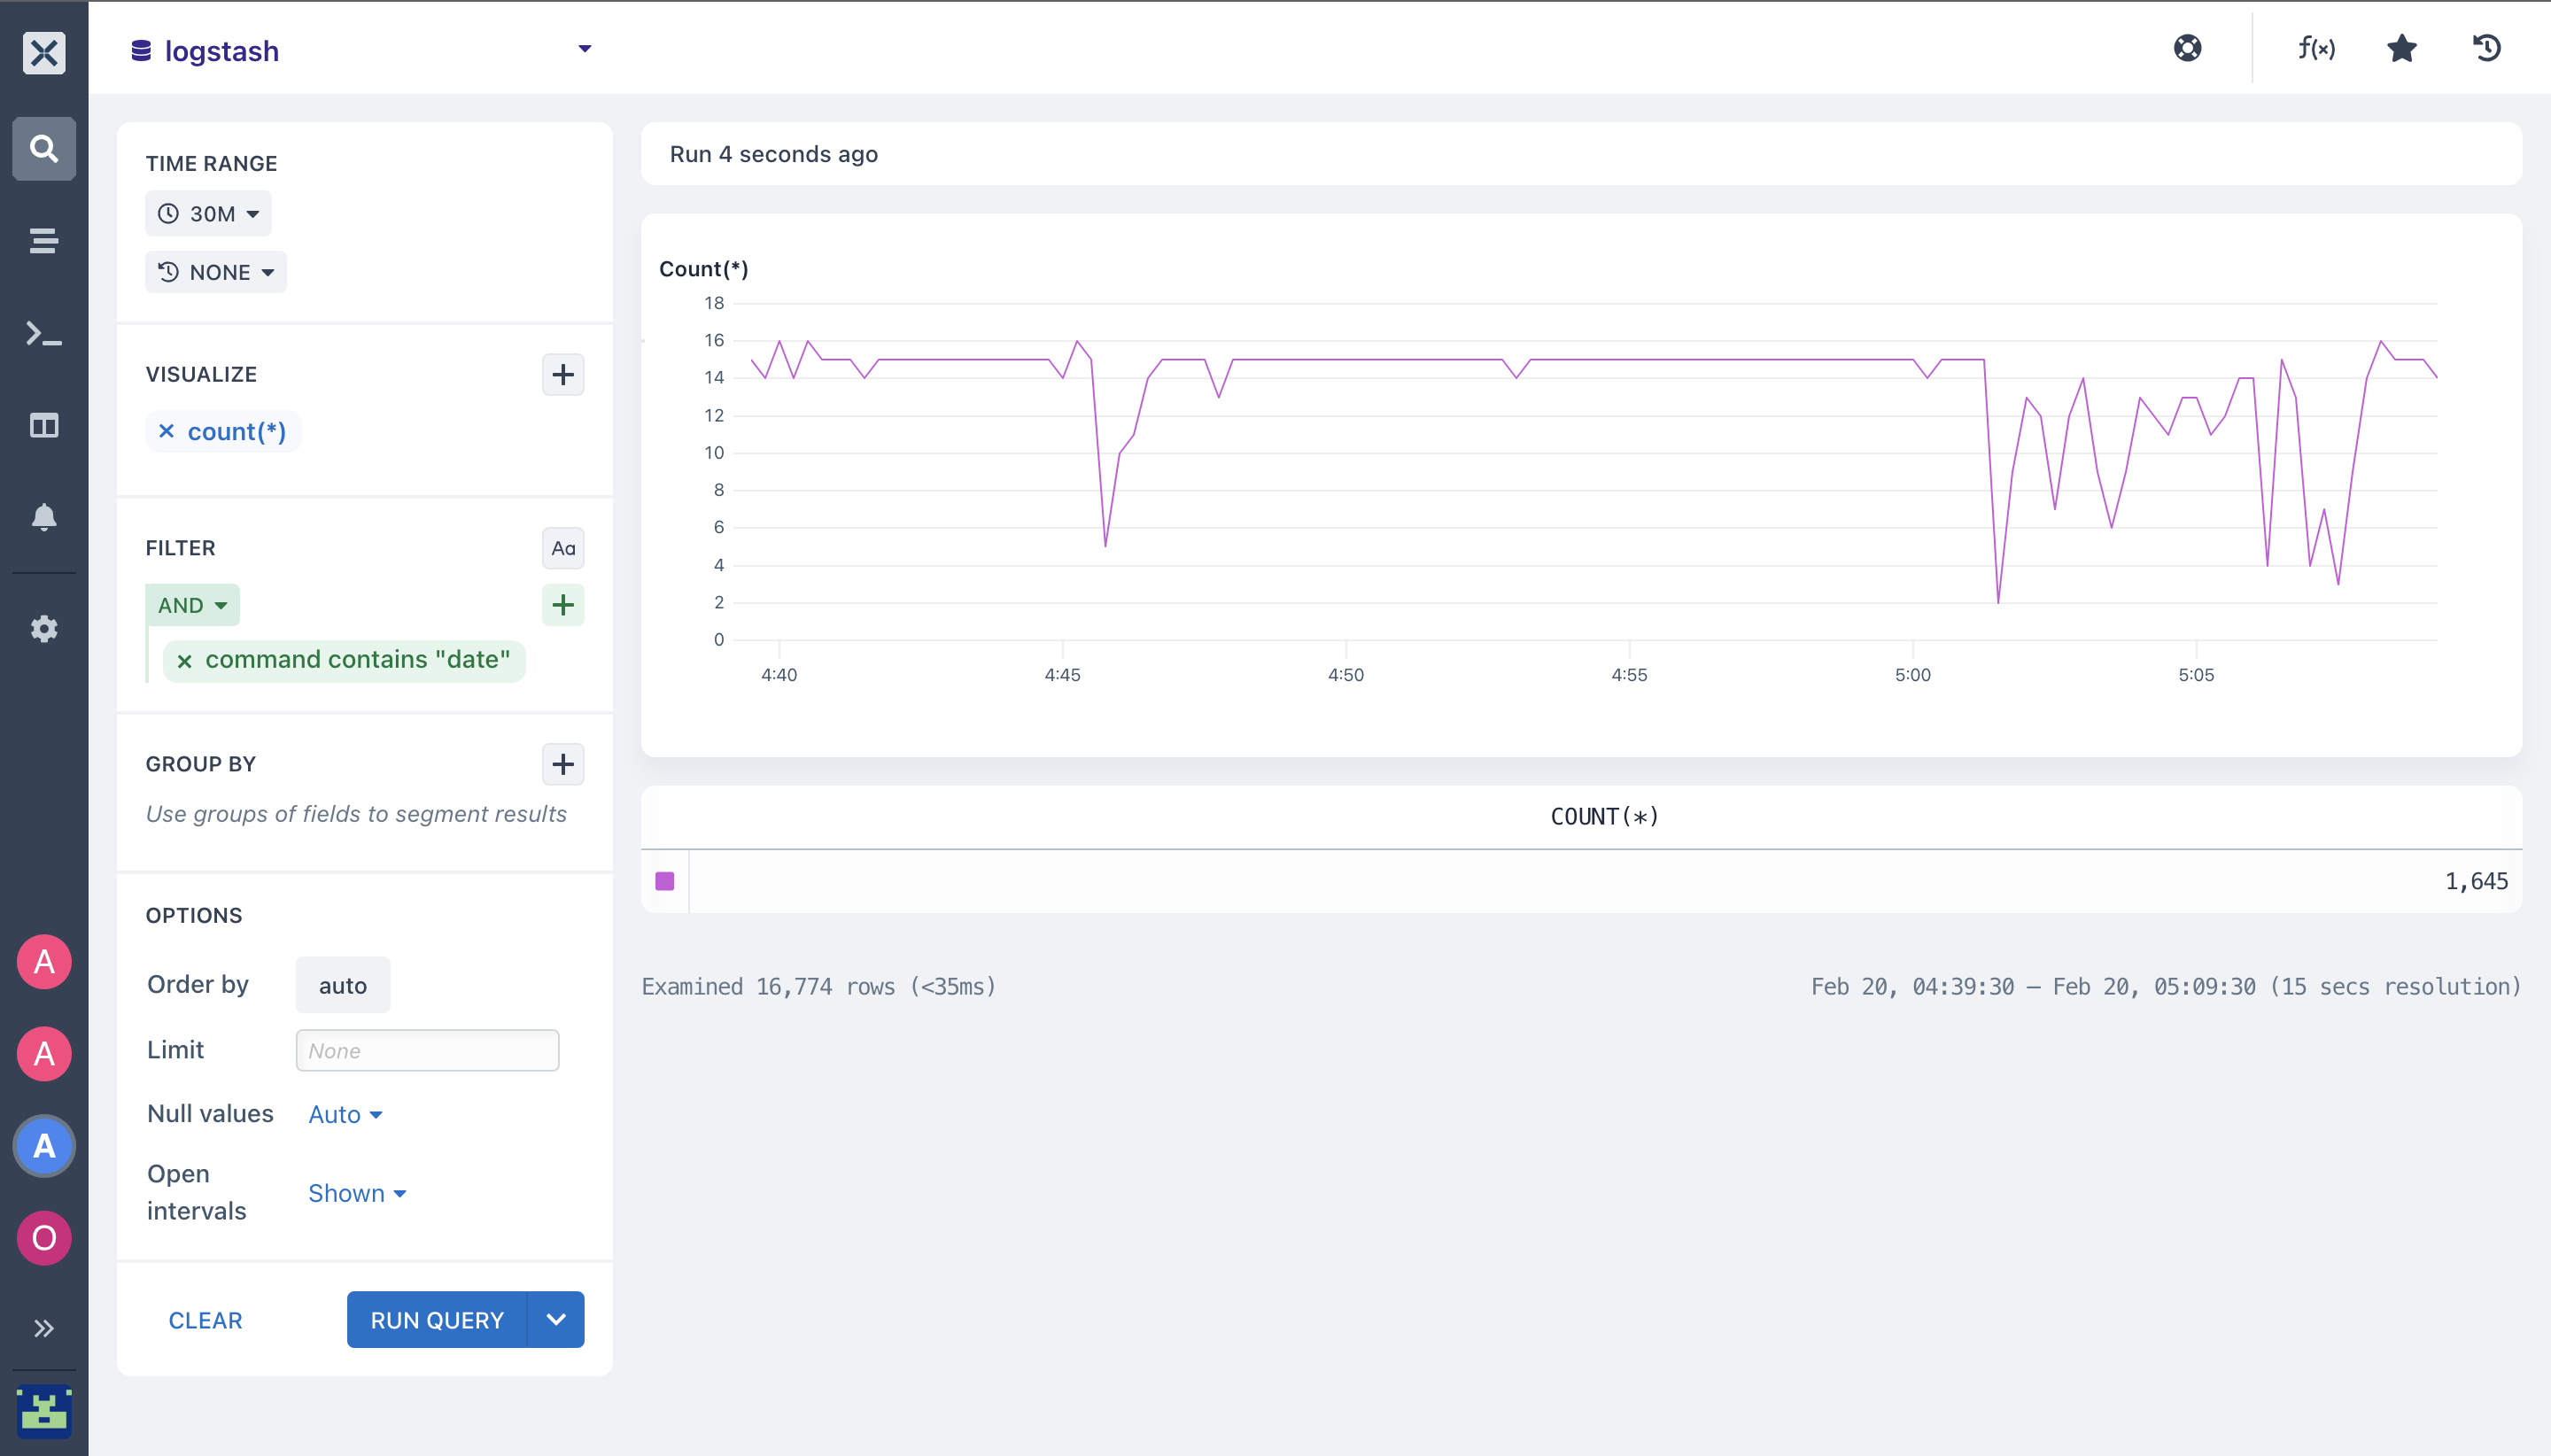
Visualize queries with pipeline configuration Aggregations:
- You can group and extract statistics/insights from your Logstash events by running aggregations across your logstash dataset.
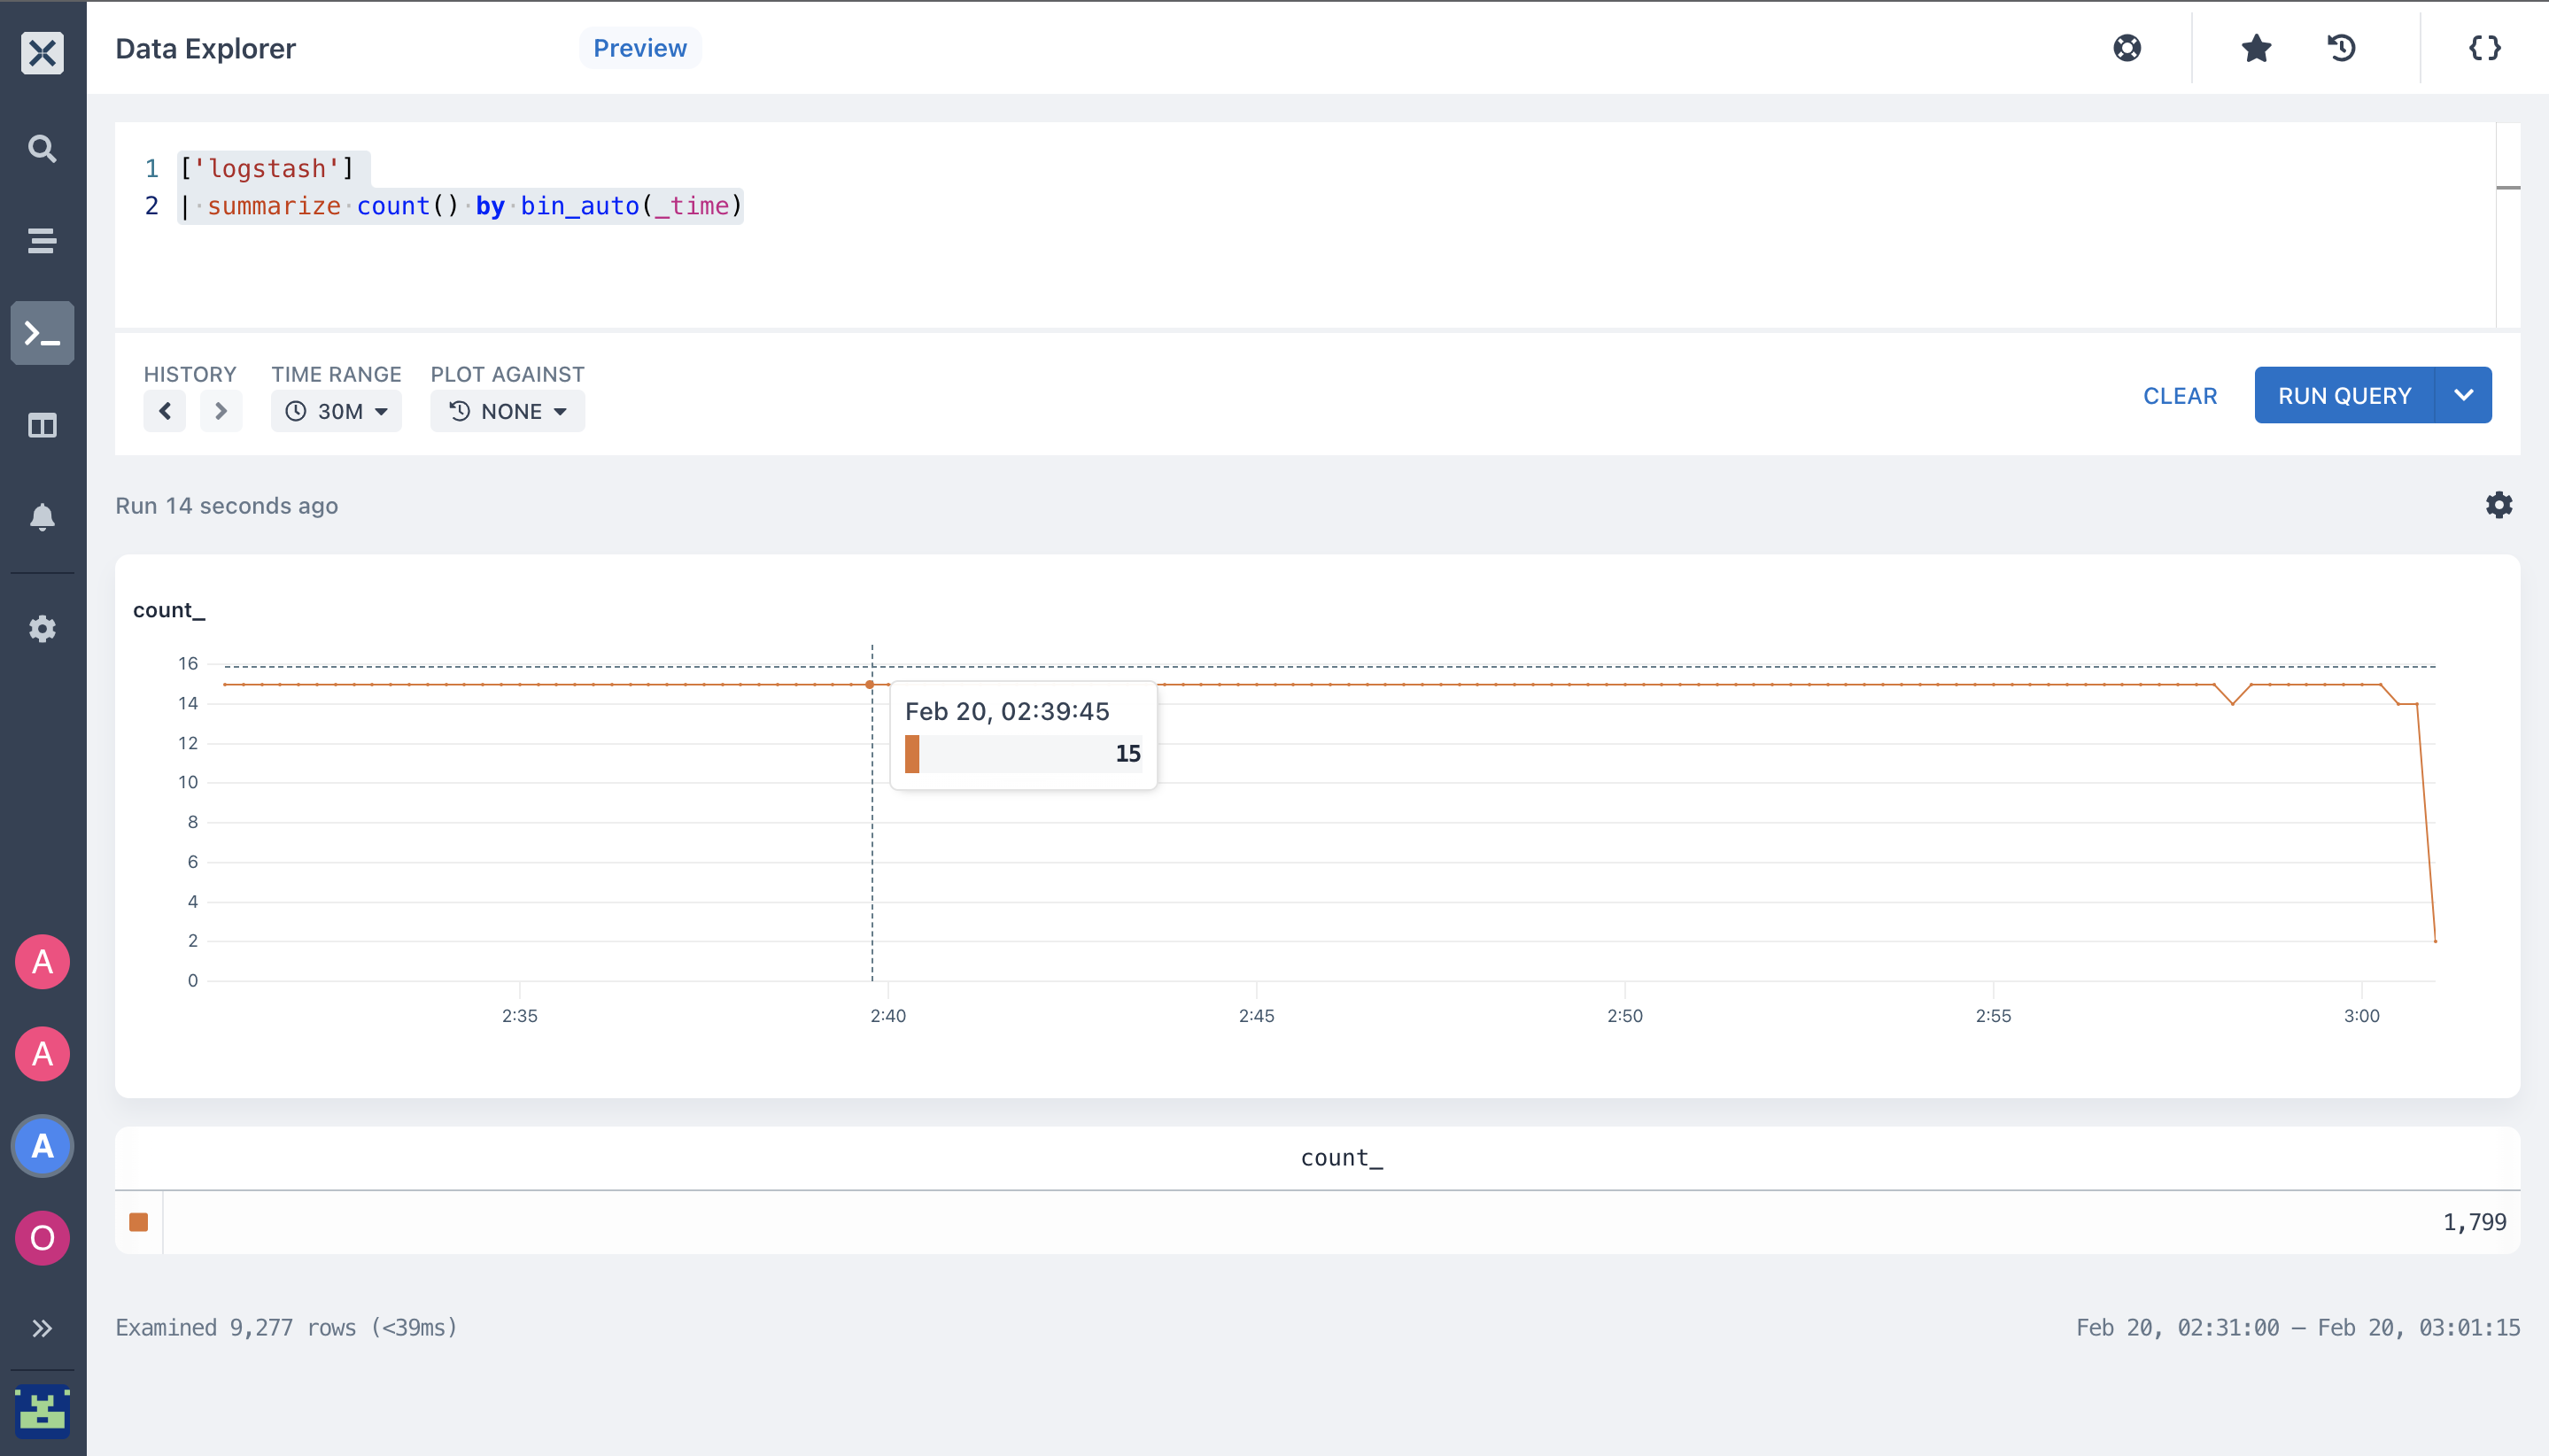
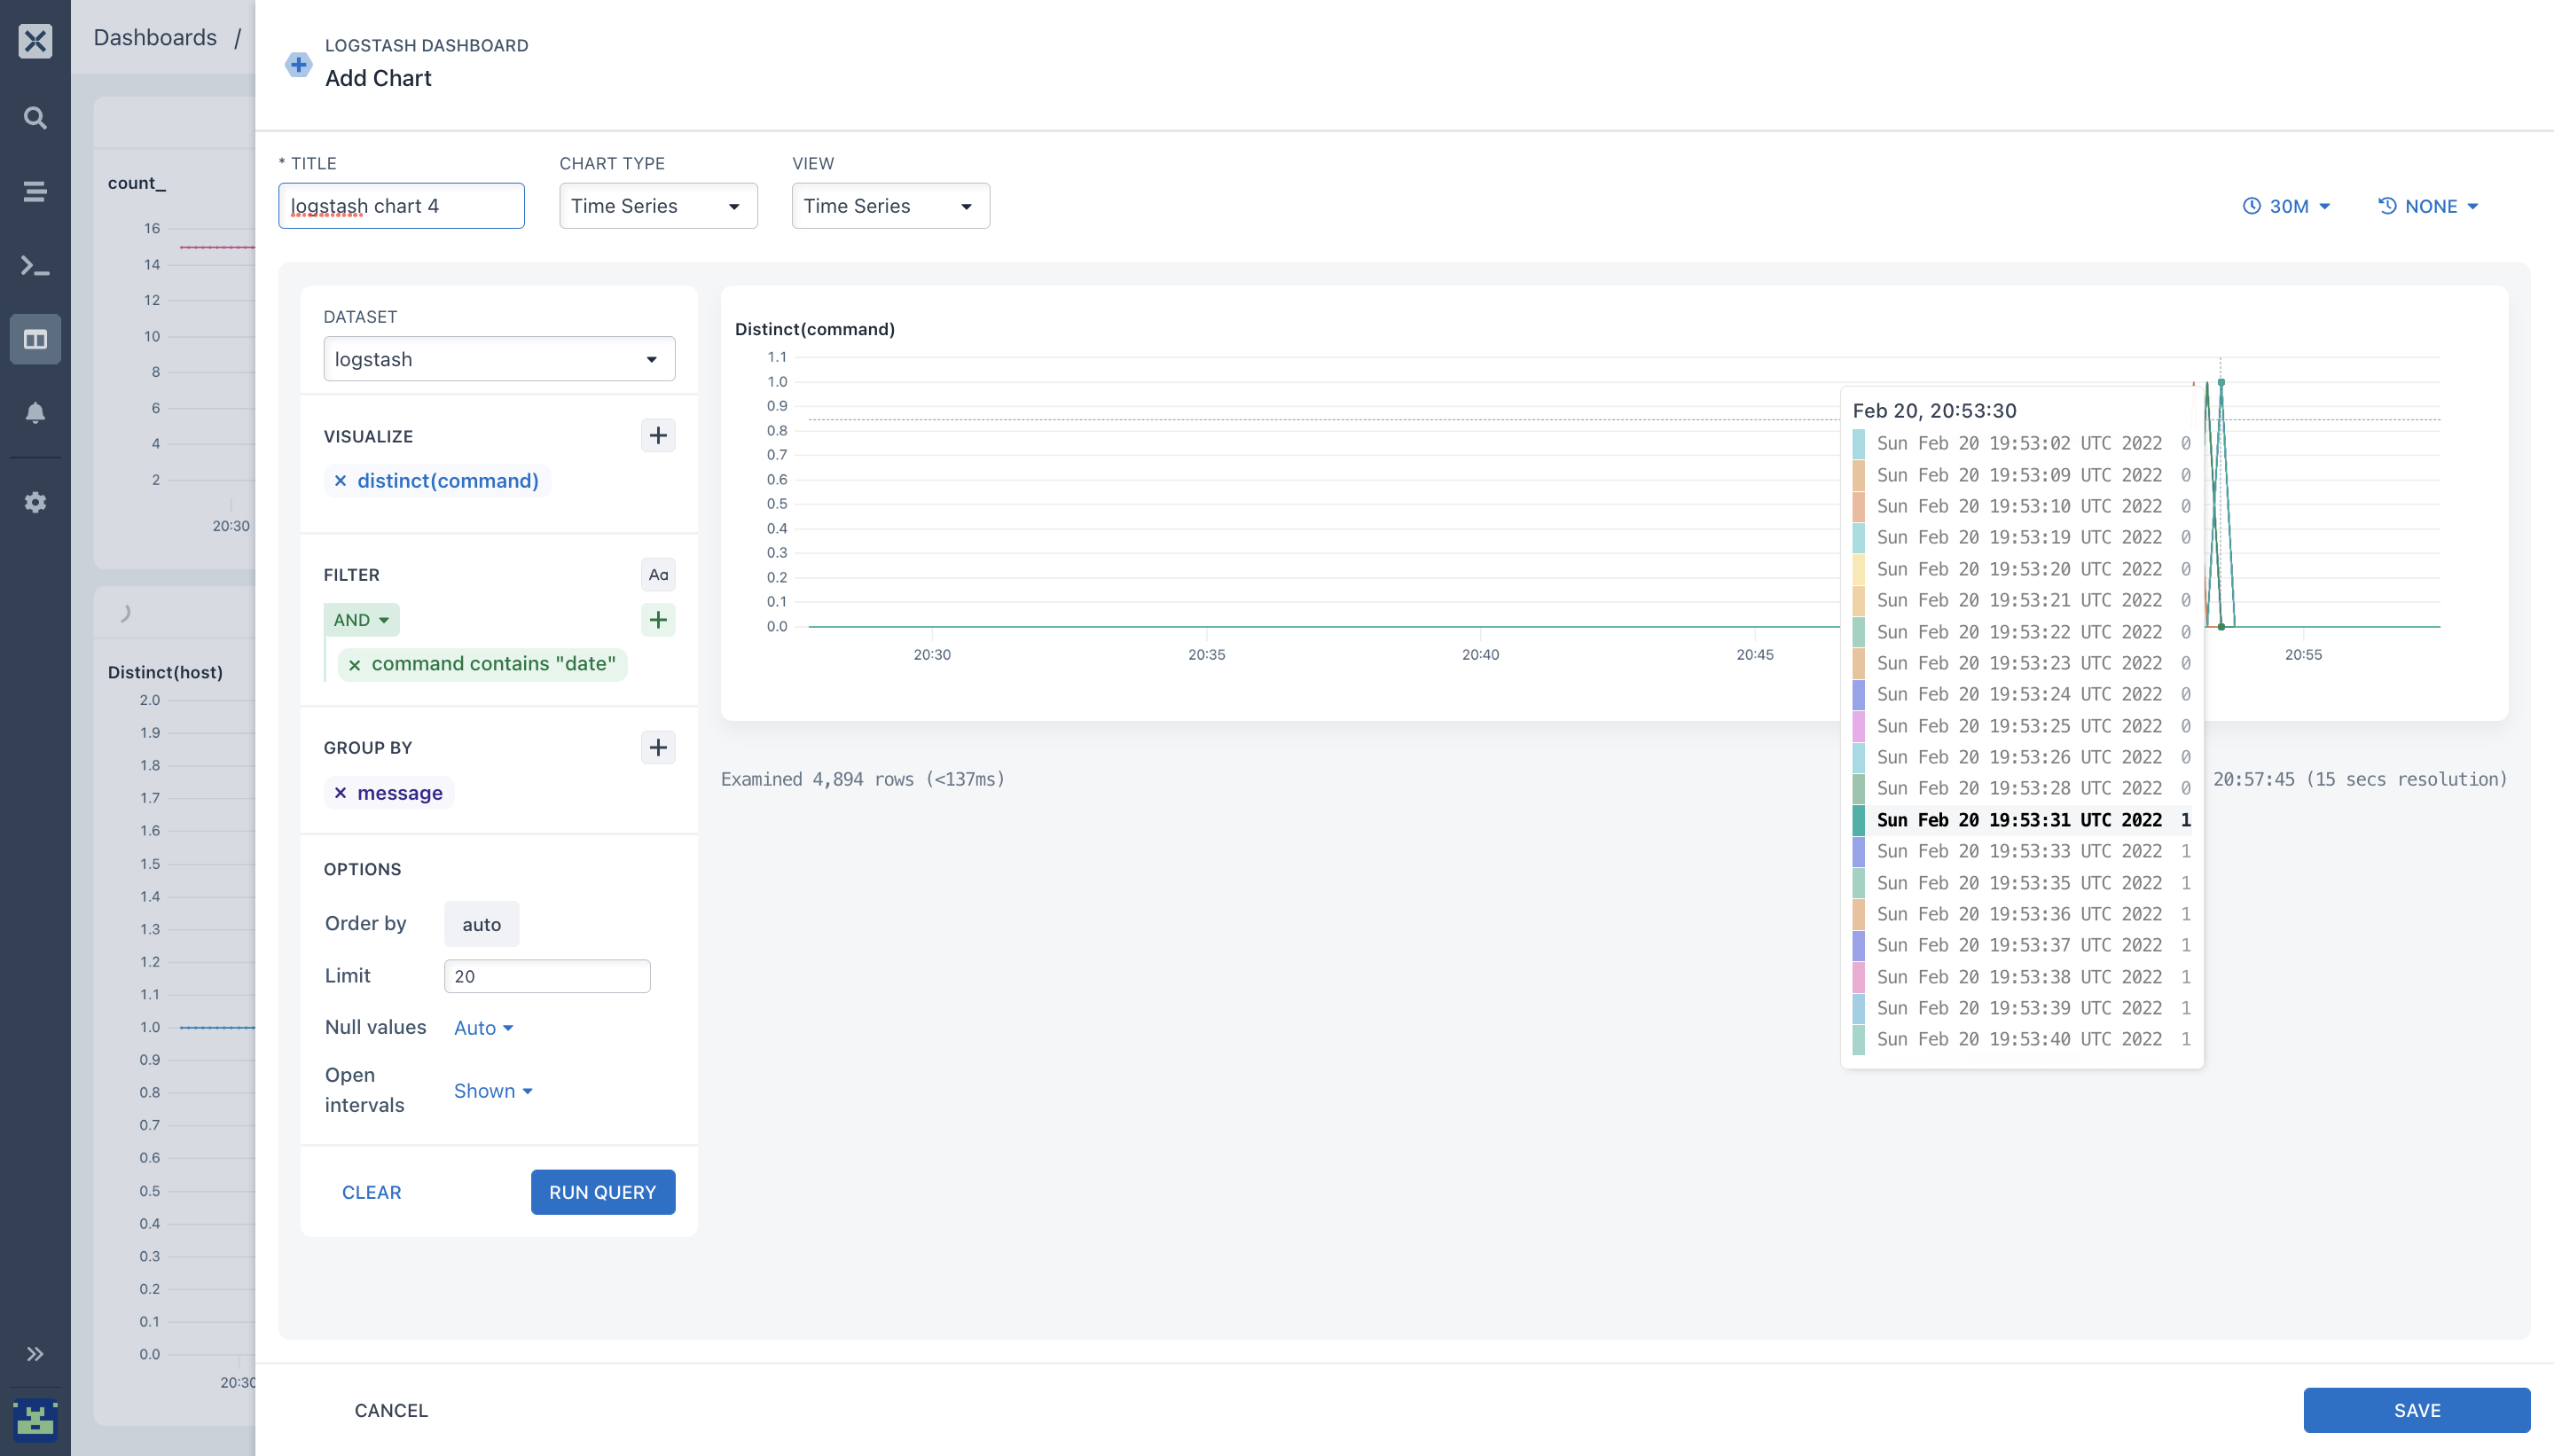
- count(): Here, we run the count logstash pipeline aggregation with the
ANDfilter clause where the command contains “date”.
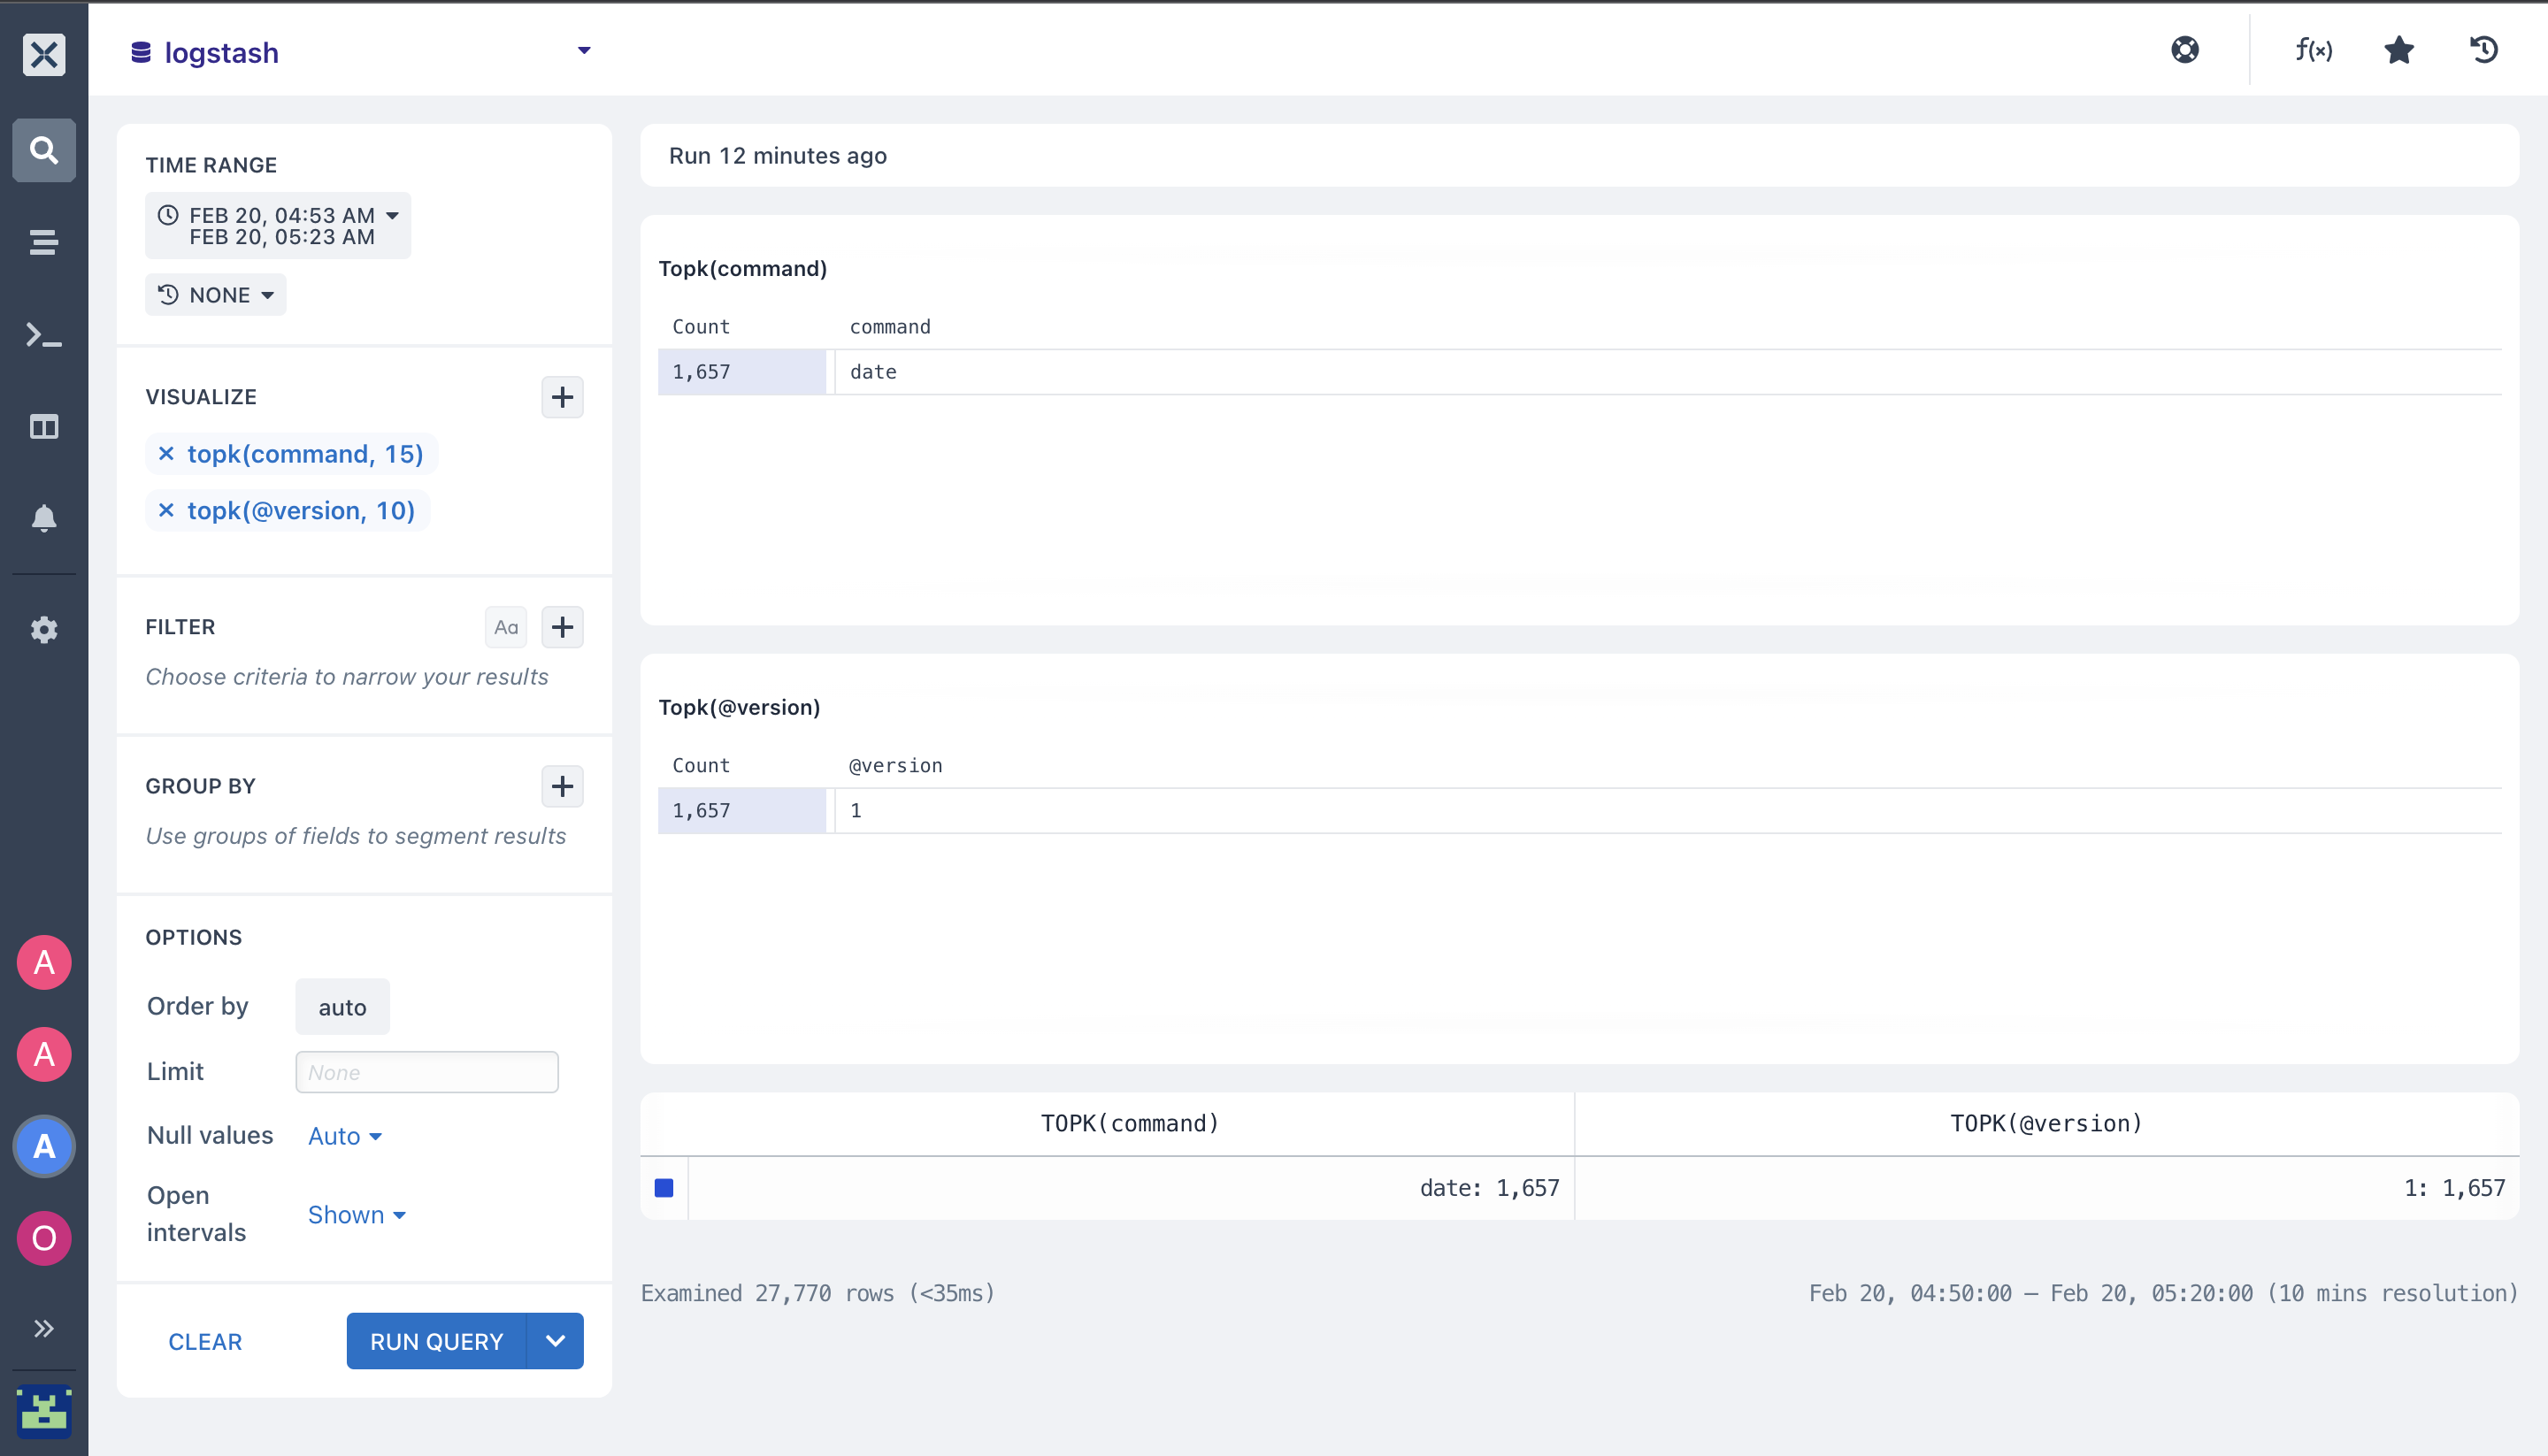
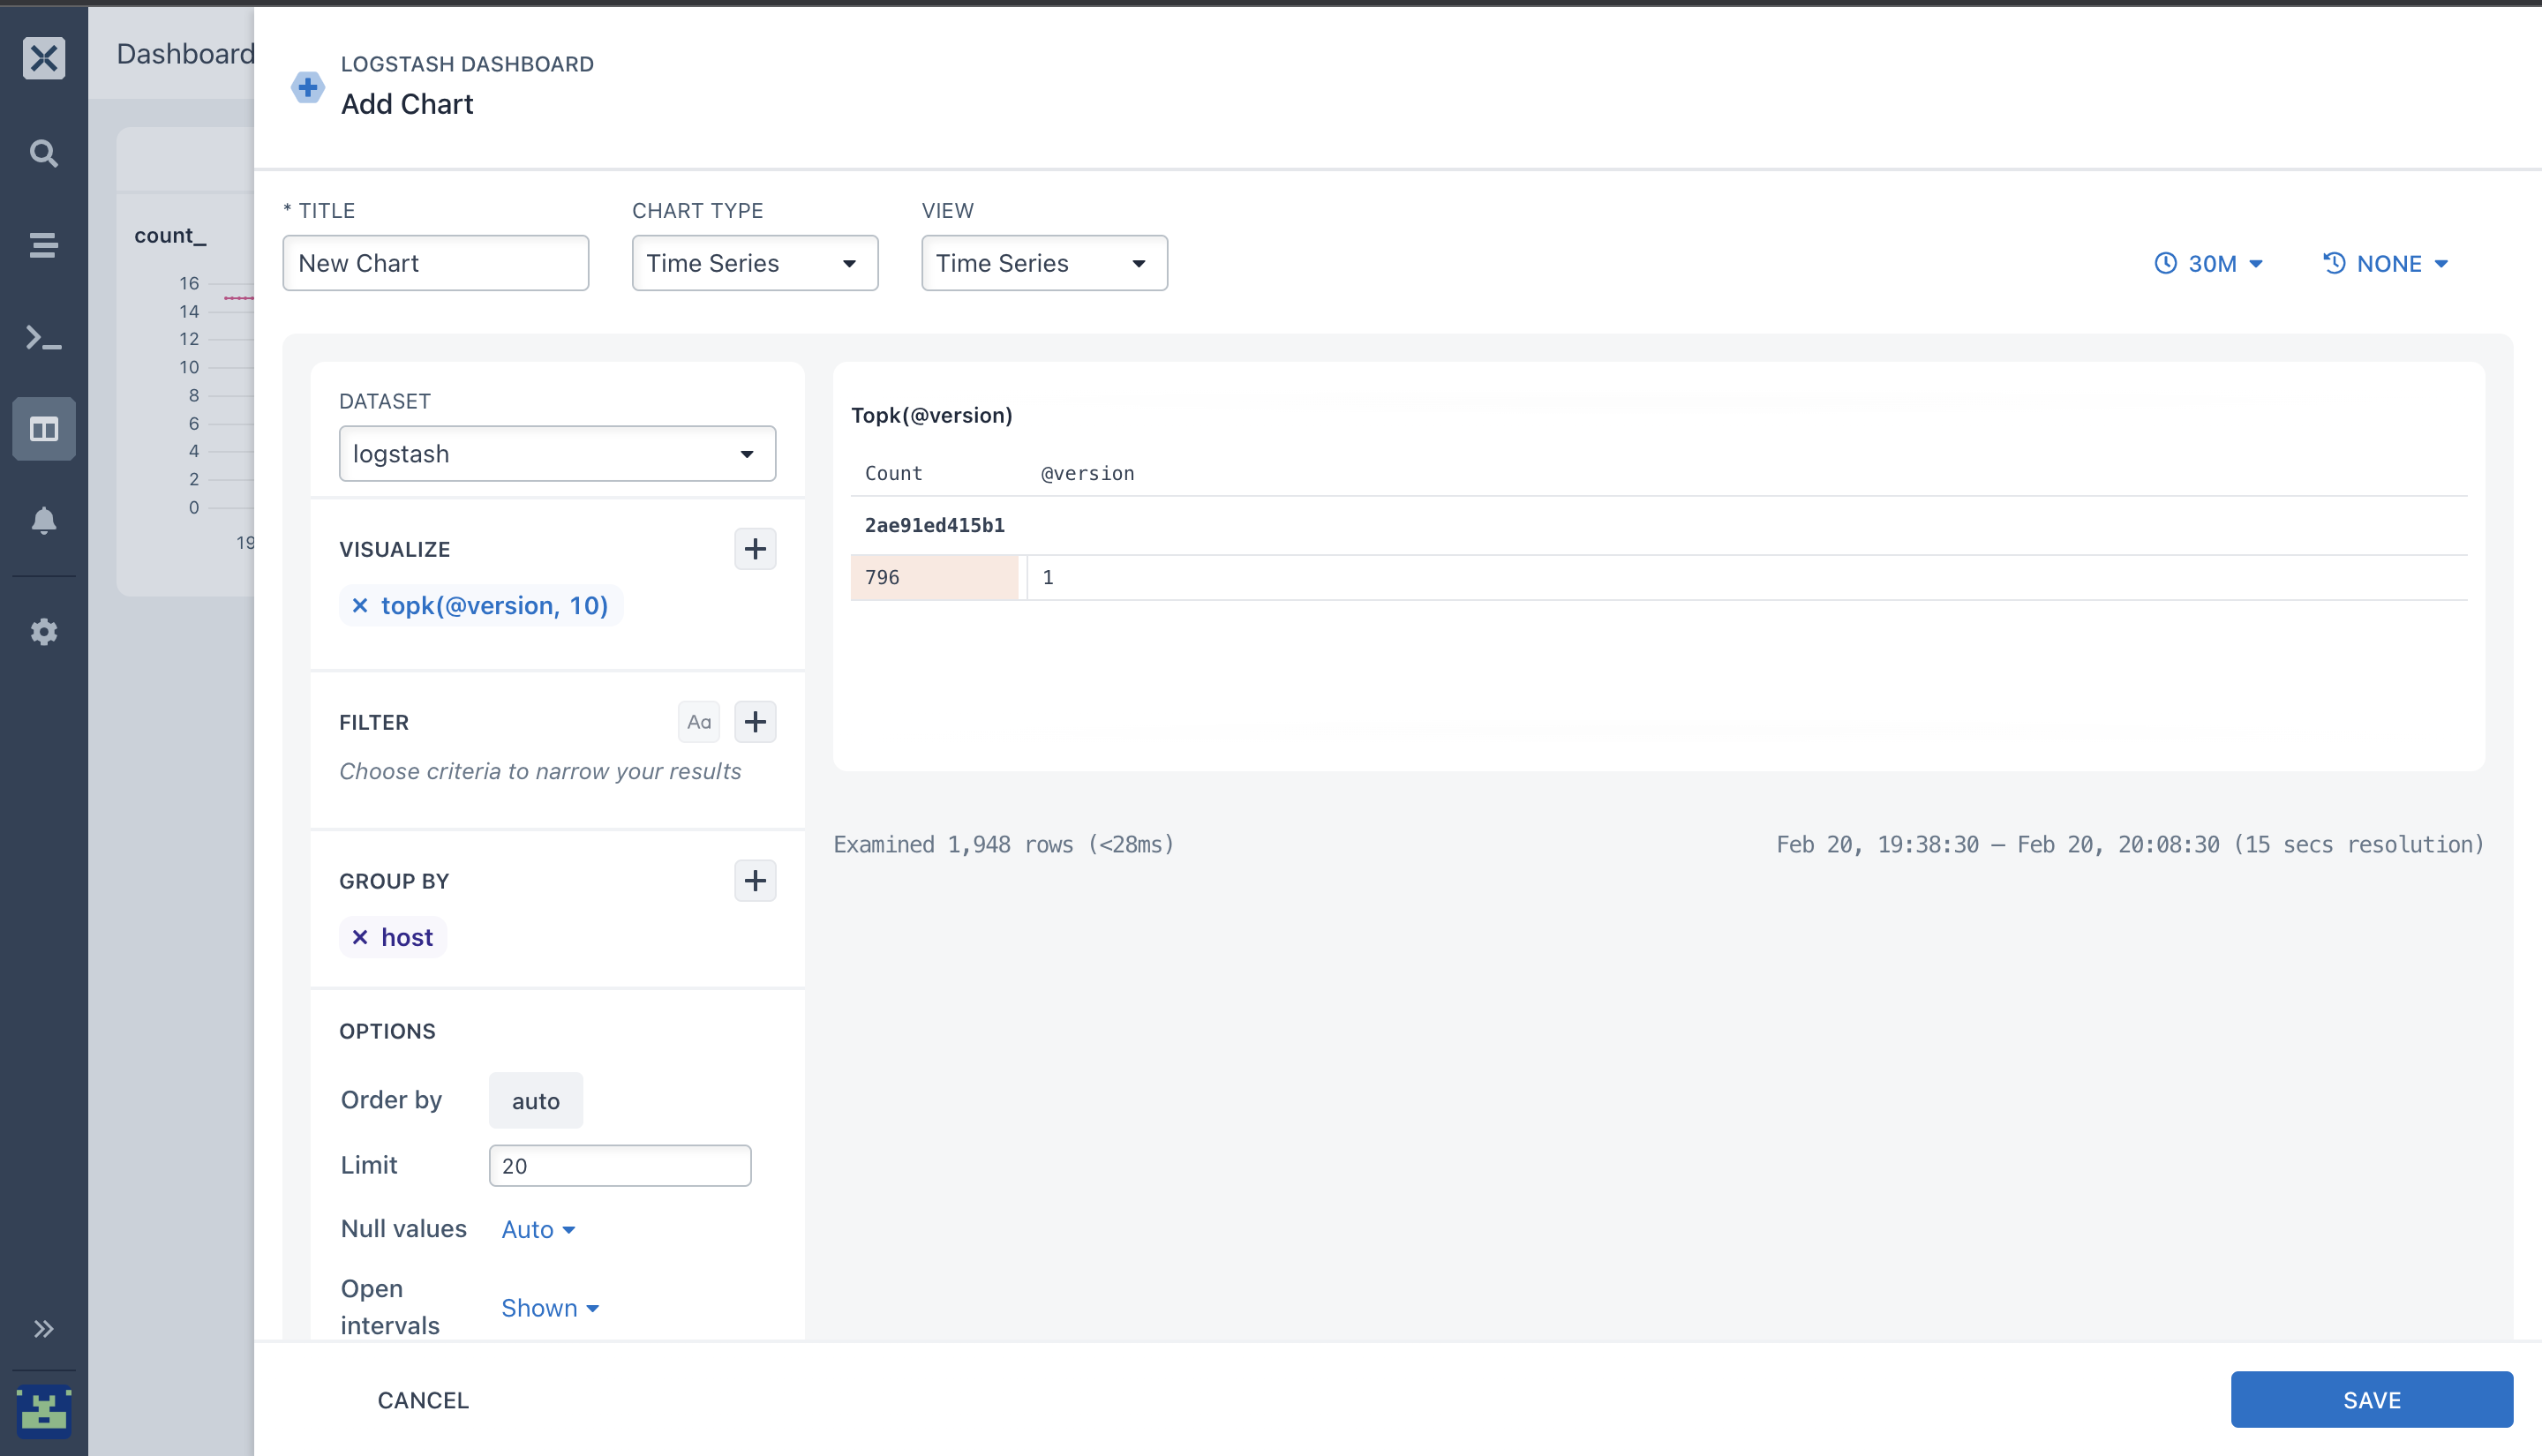
- topk(): ou can use the
topkaggregation to get the “top 10” or “top 15” (where ‘10’ and ‘15’ are ‘k’ in topk) values for your geoipfieldsin your logstash dataset.
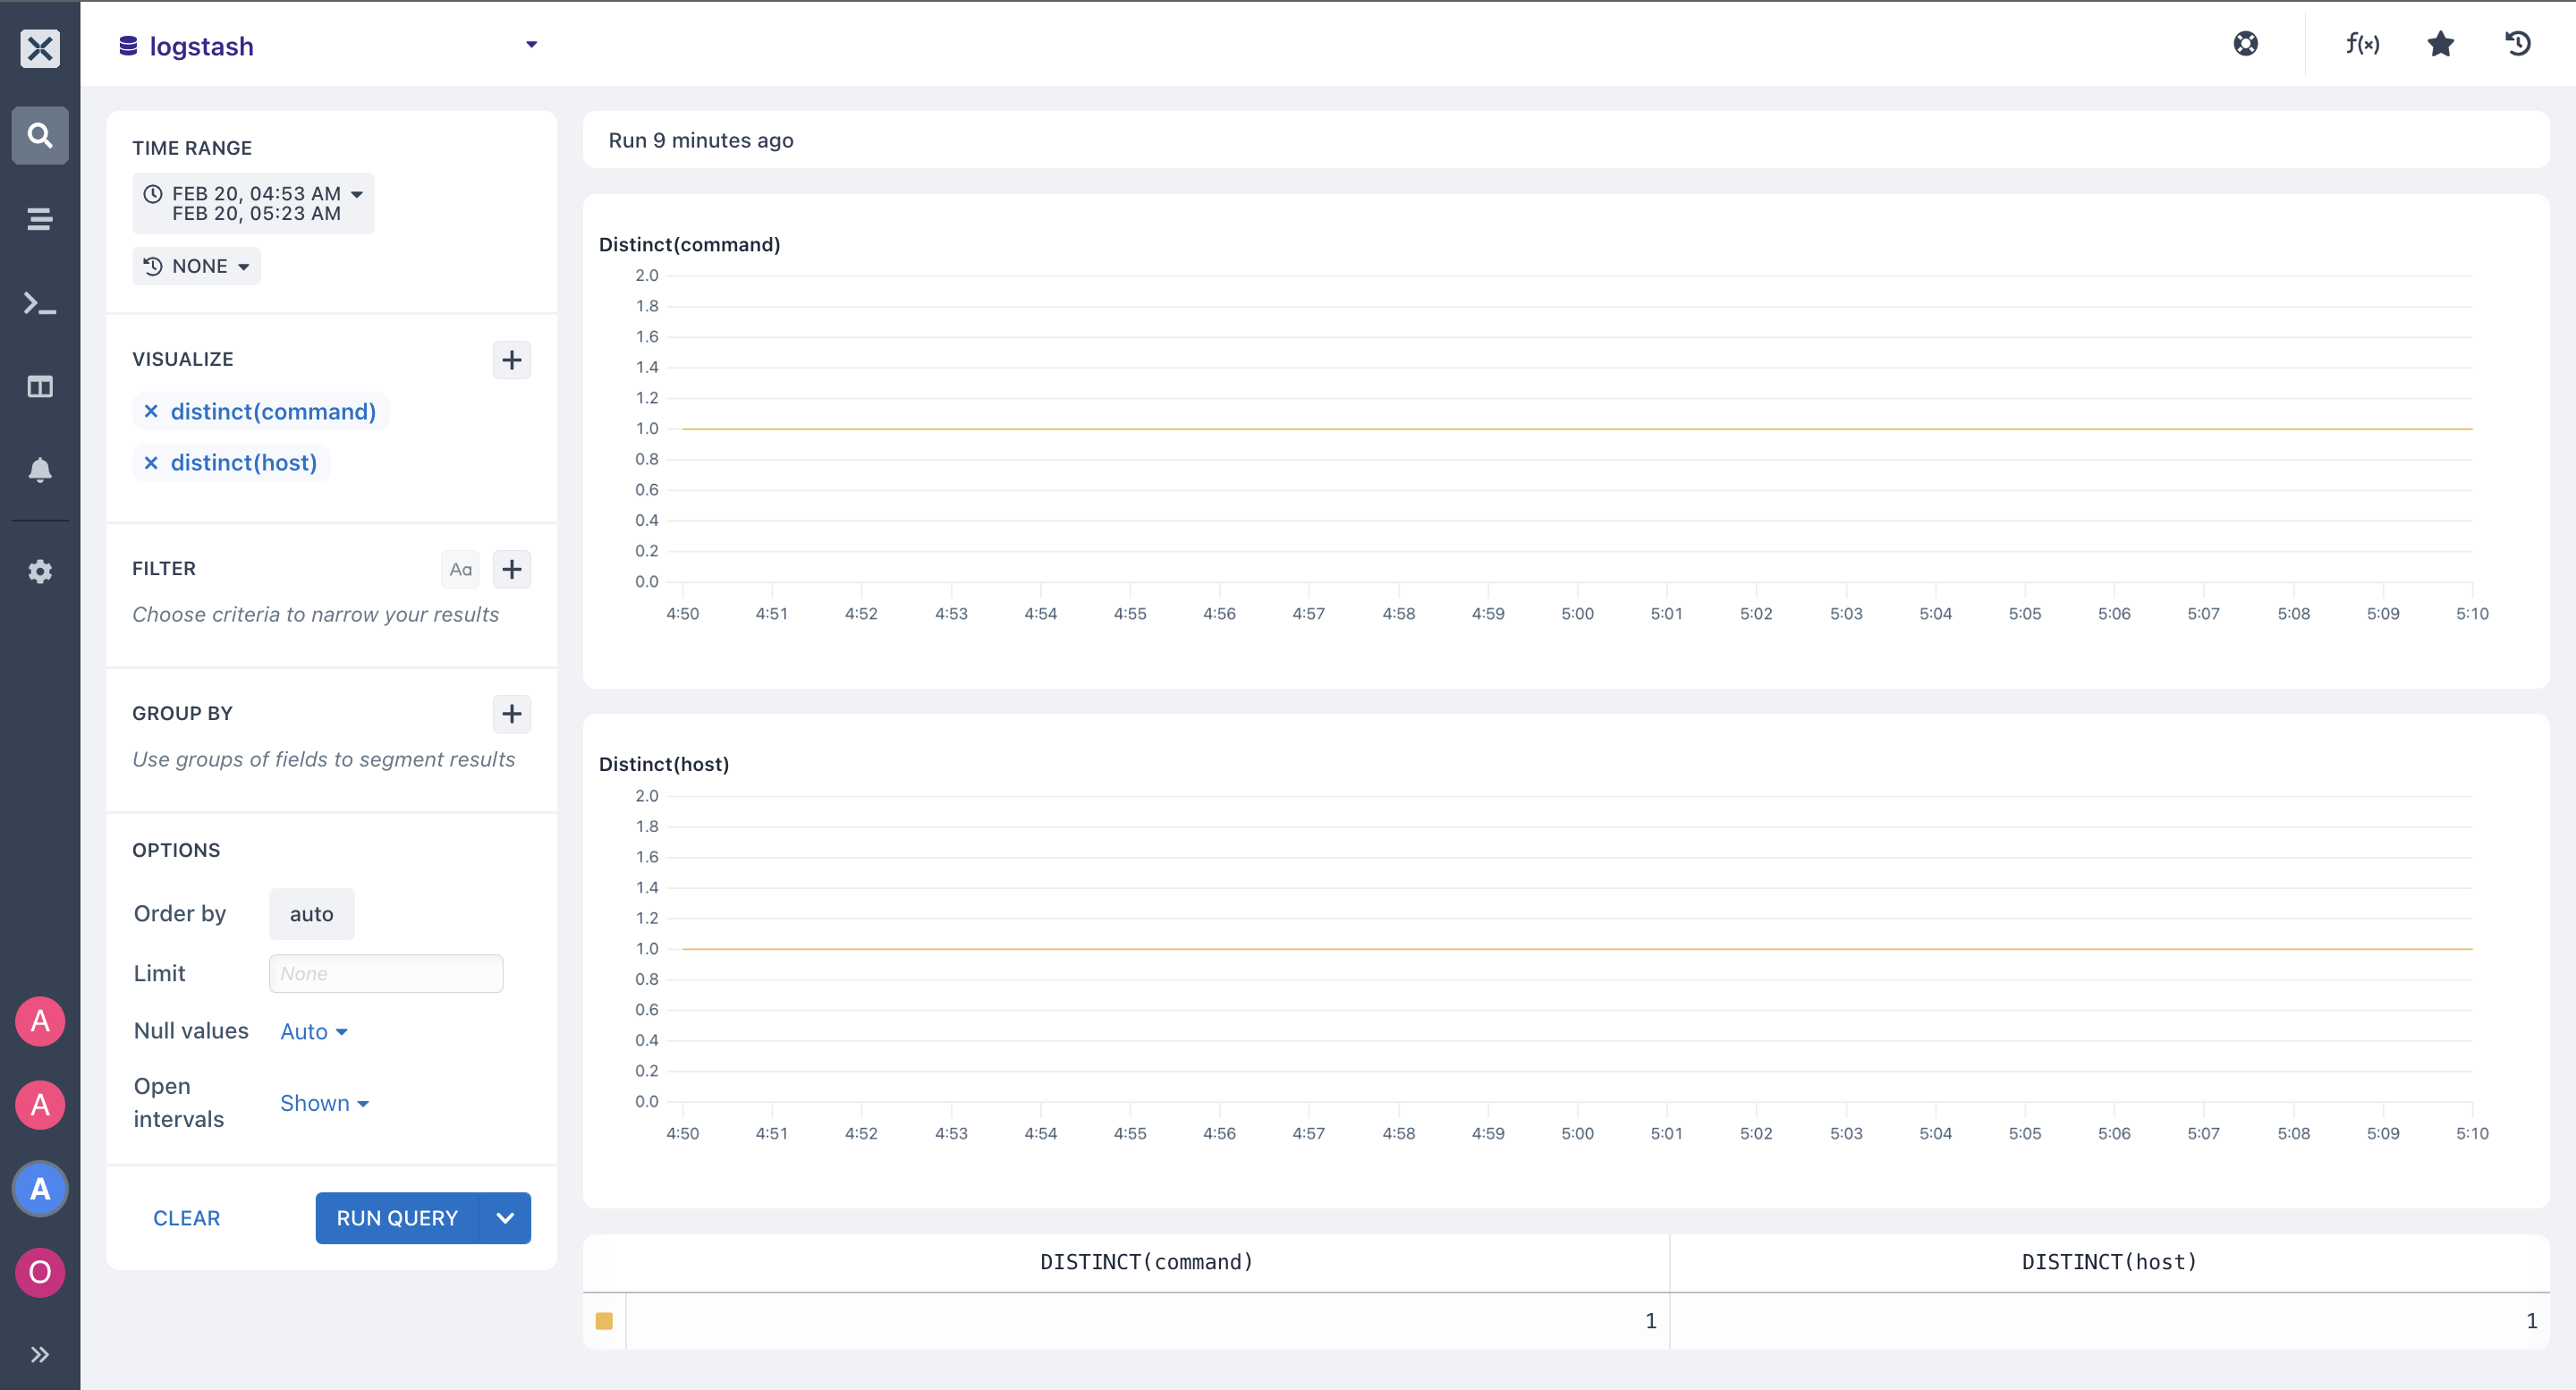
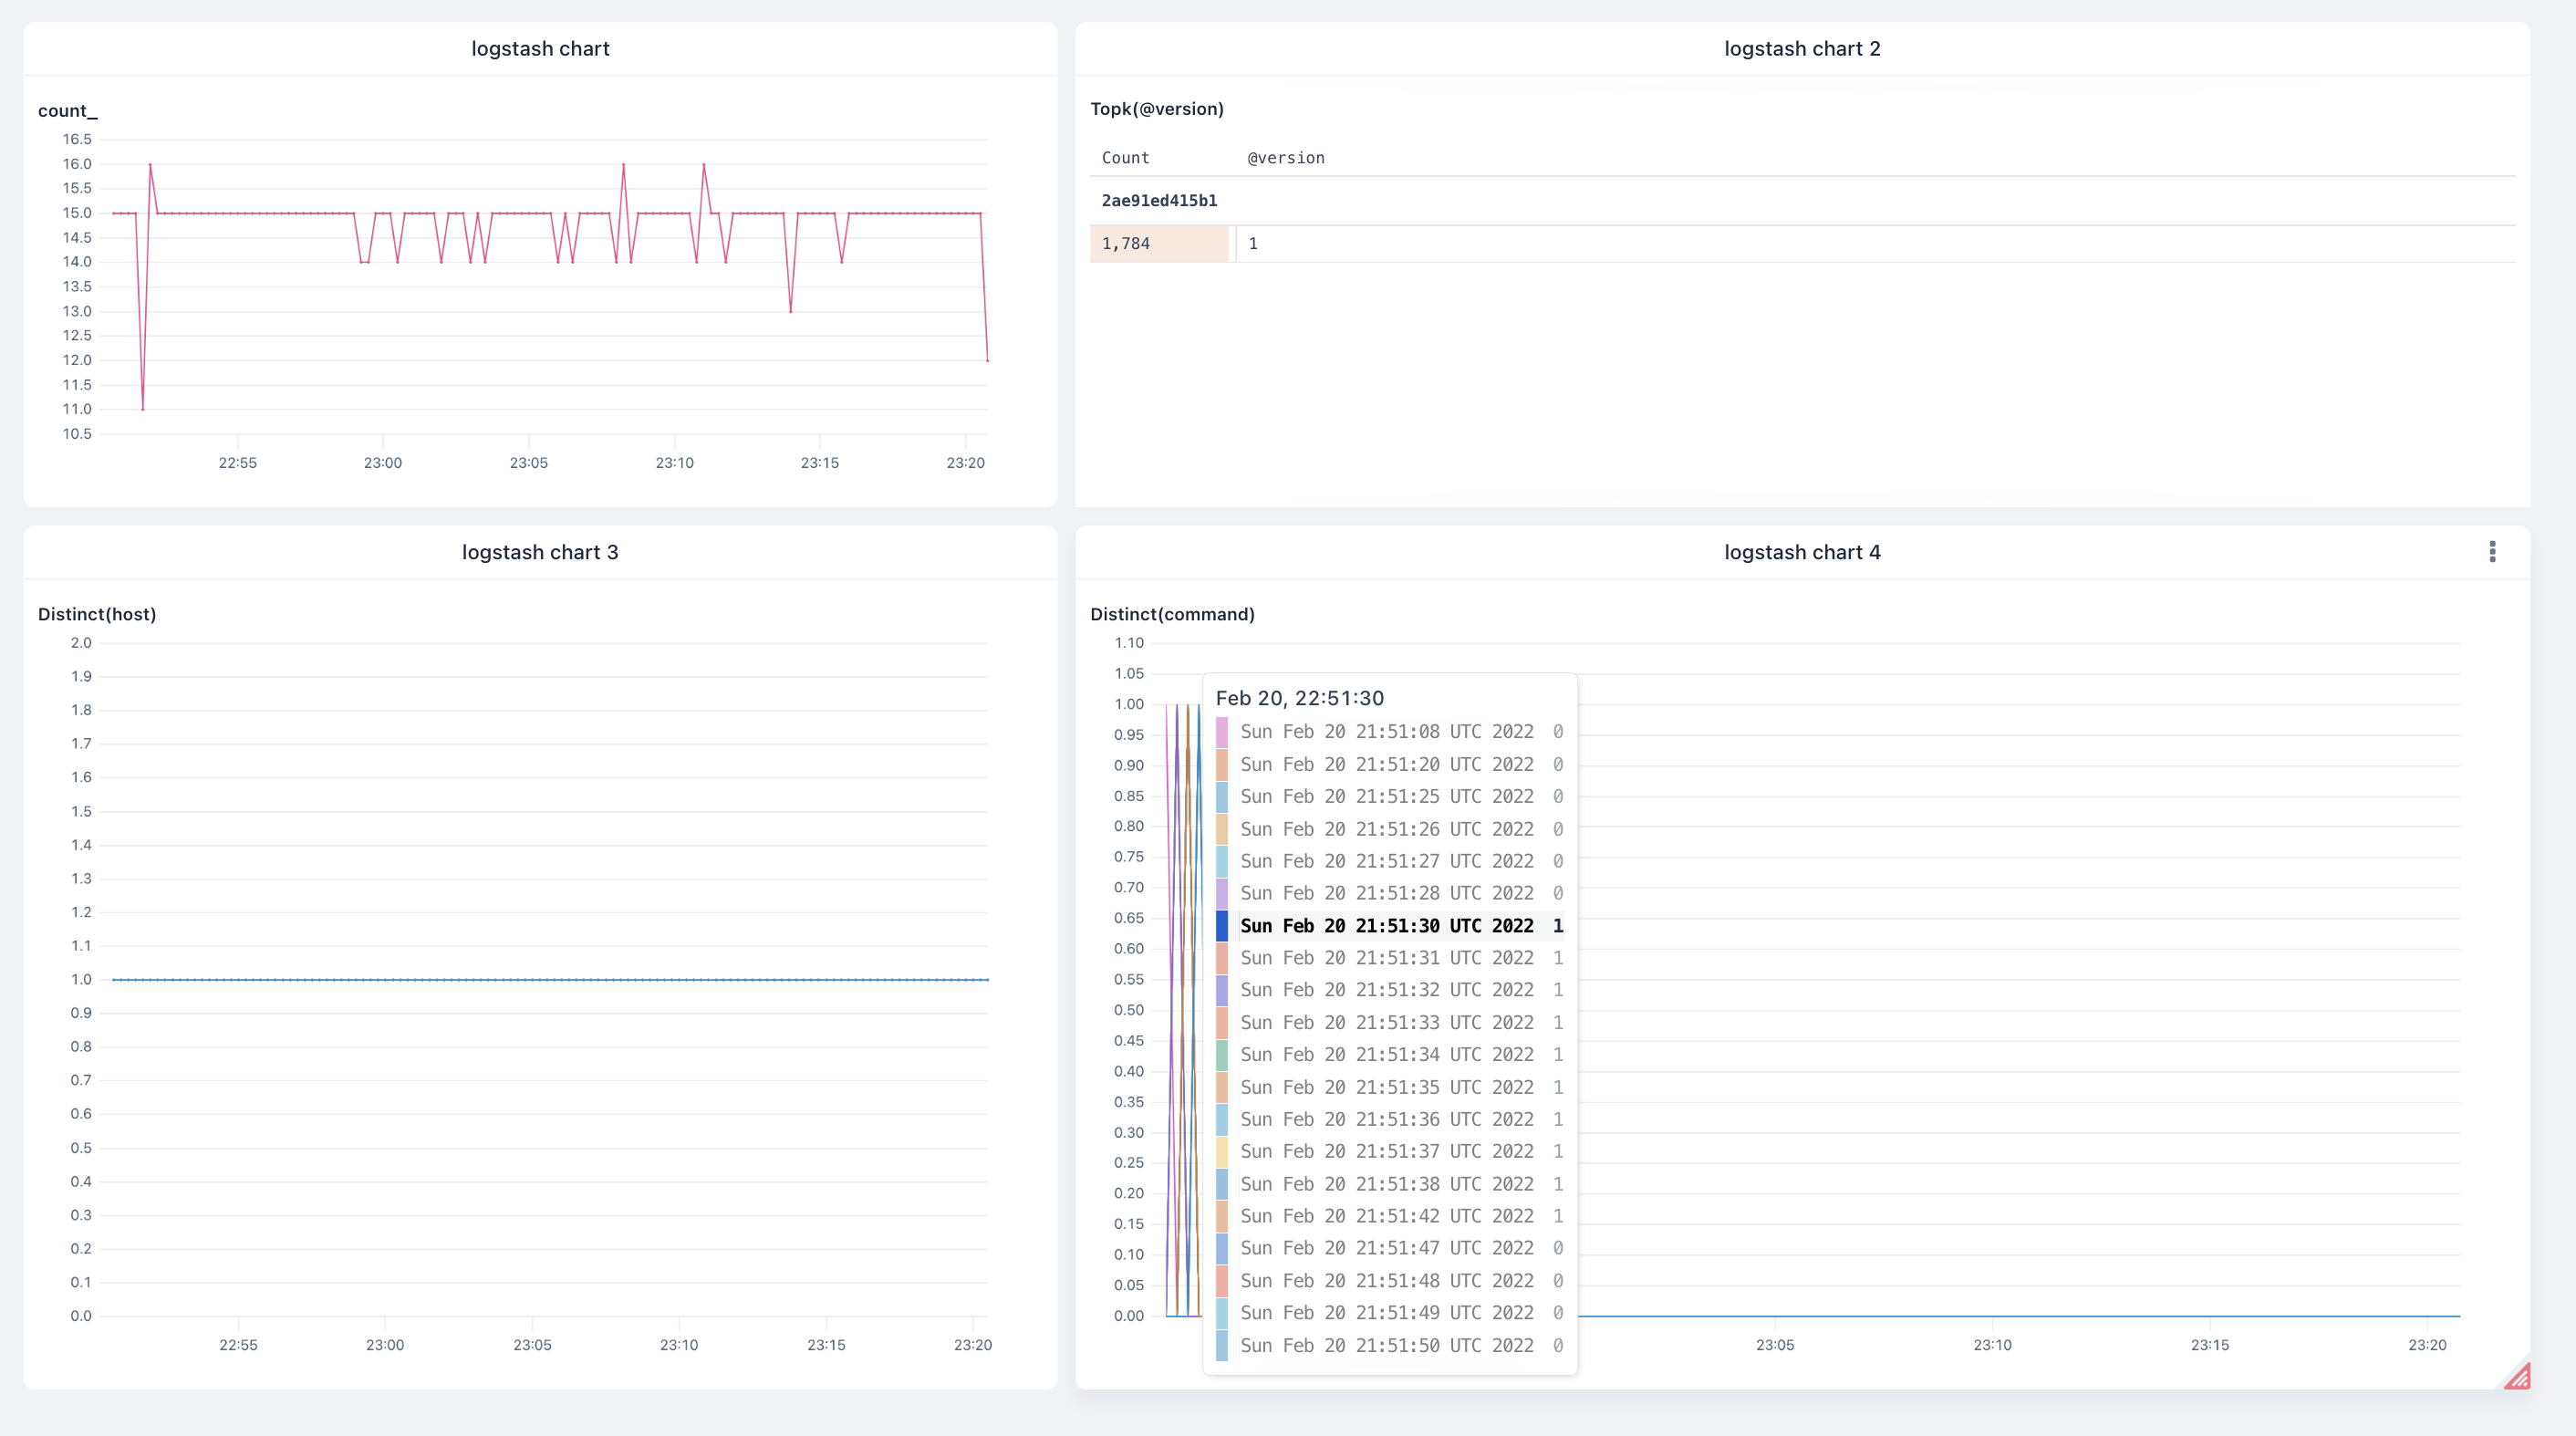
- distinct(): You can specify the
distinct($fieldName)function to get the chart for the stdin and x-pack values in each field you select from your logstash pipeline dataset. The table below the chart shows the total number of distinct values for the entire timestamp period selected.
- You can group collections of syslog queries from your logstash pipelines to identify and diagnose common apache issues quickly when elasticsearch problems occur using Axiom Dashboard. To get started with Dashboards, head over to Dashboards on Axiom.
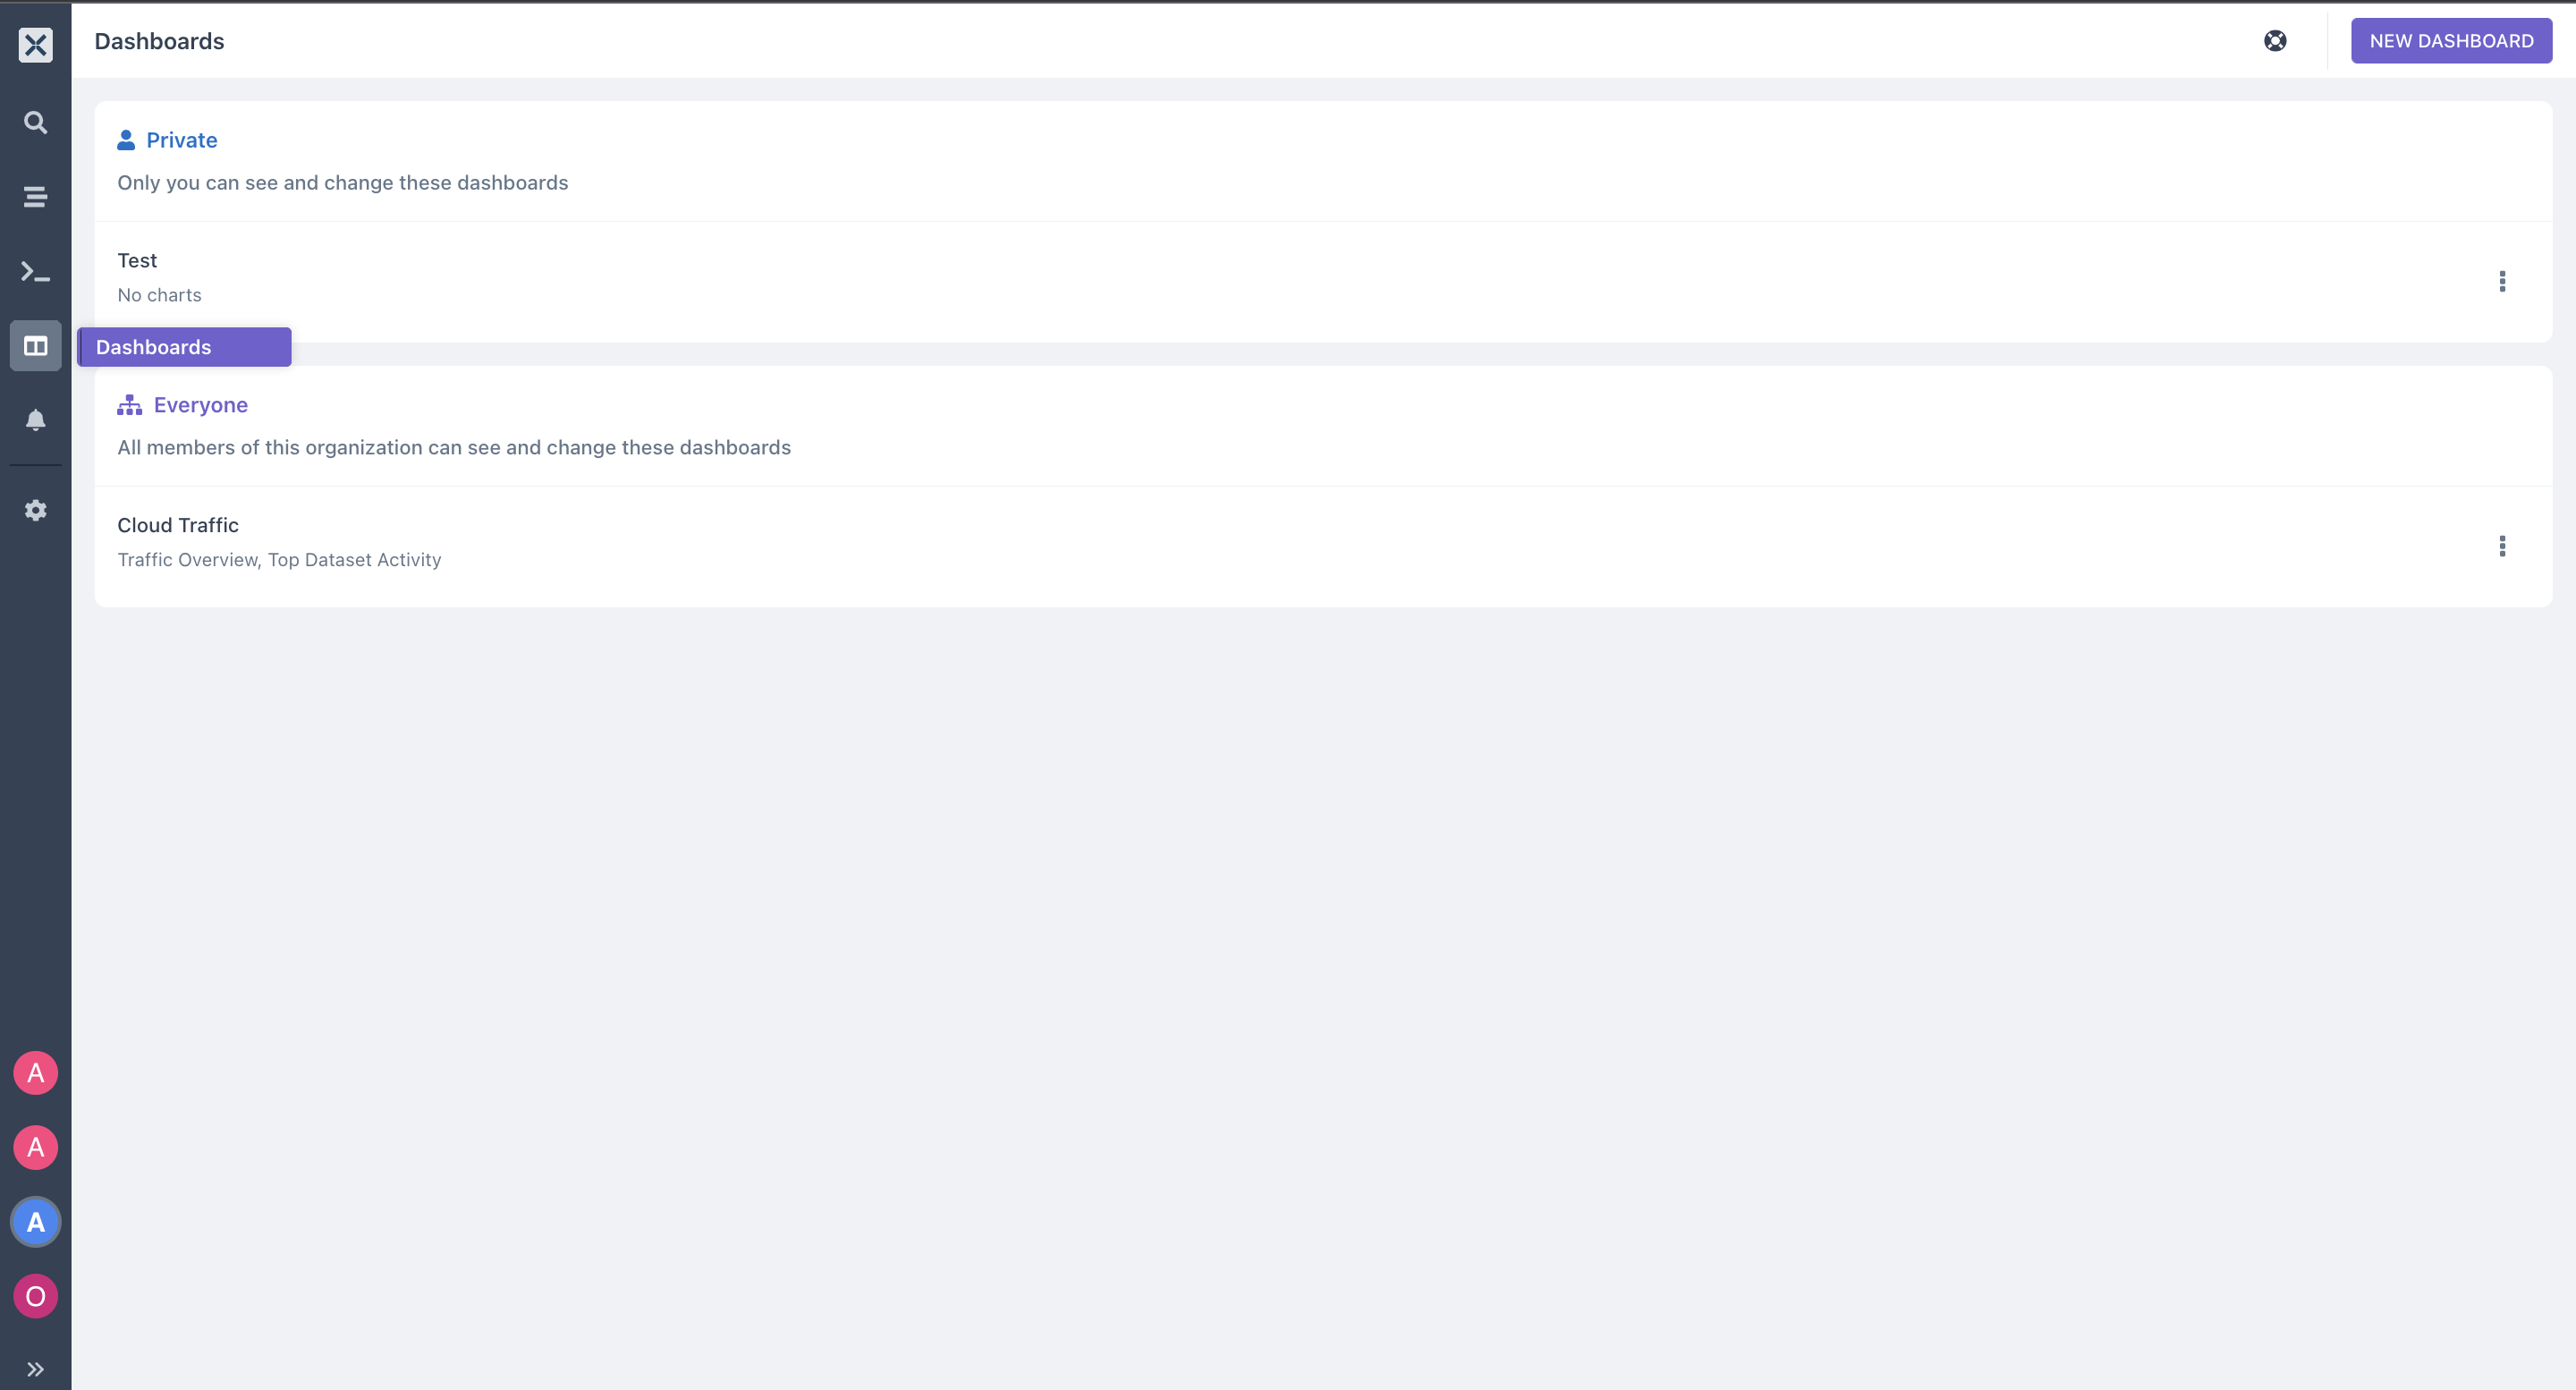
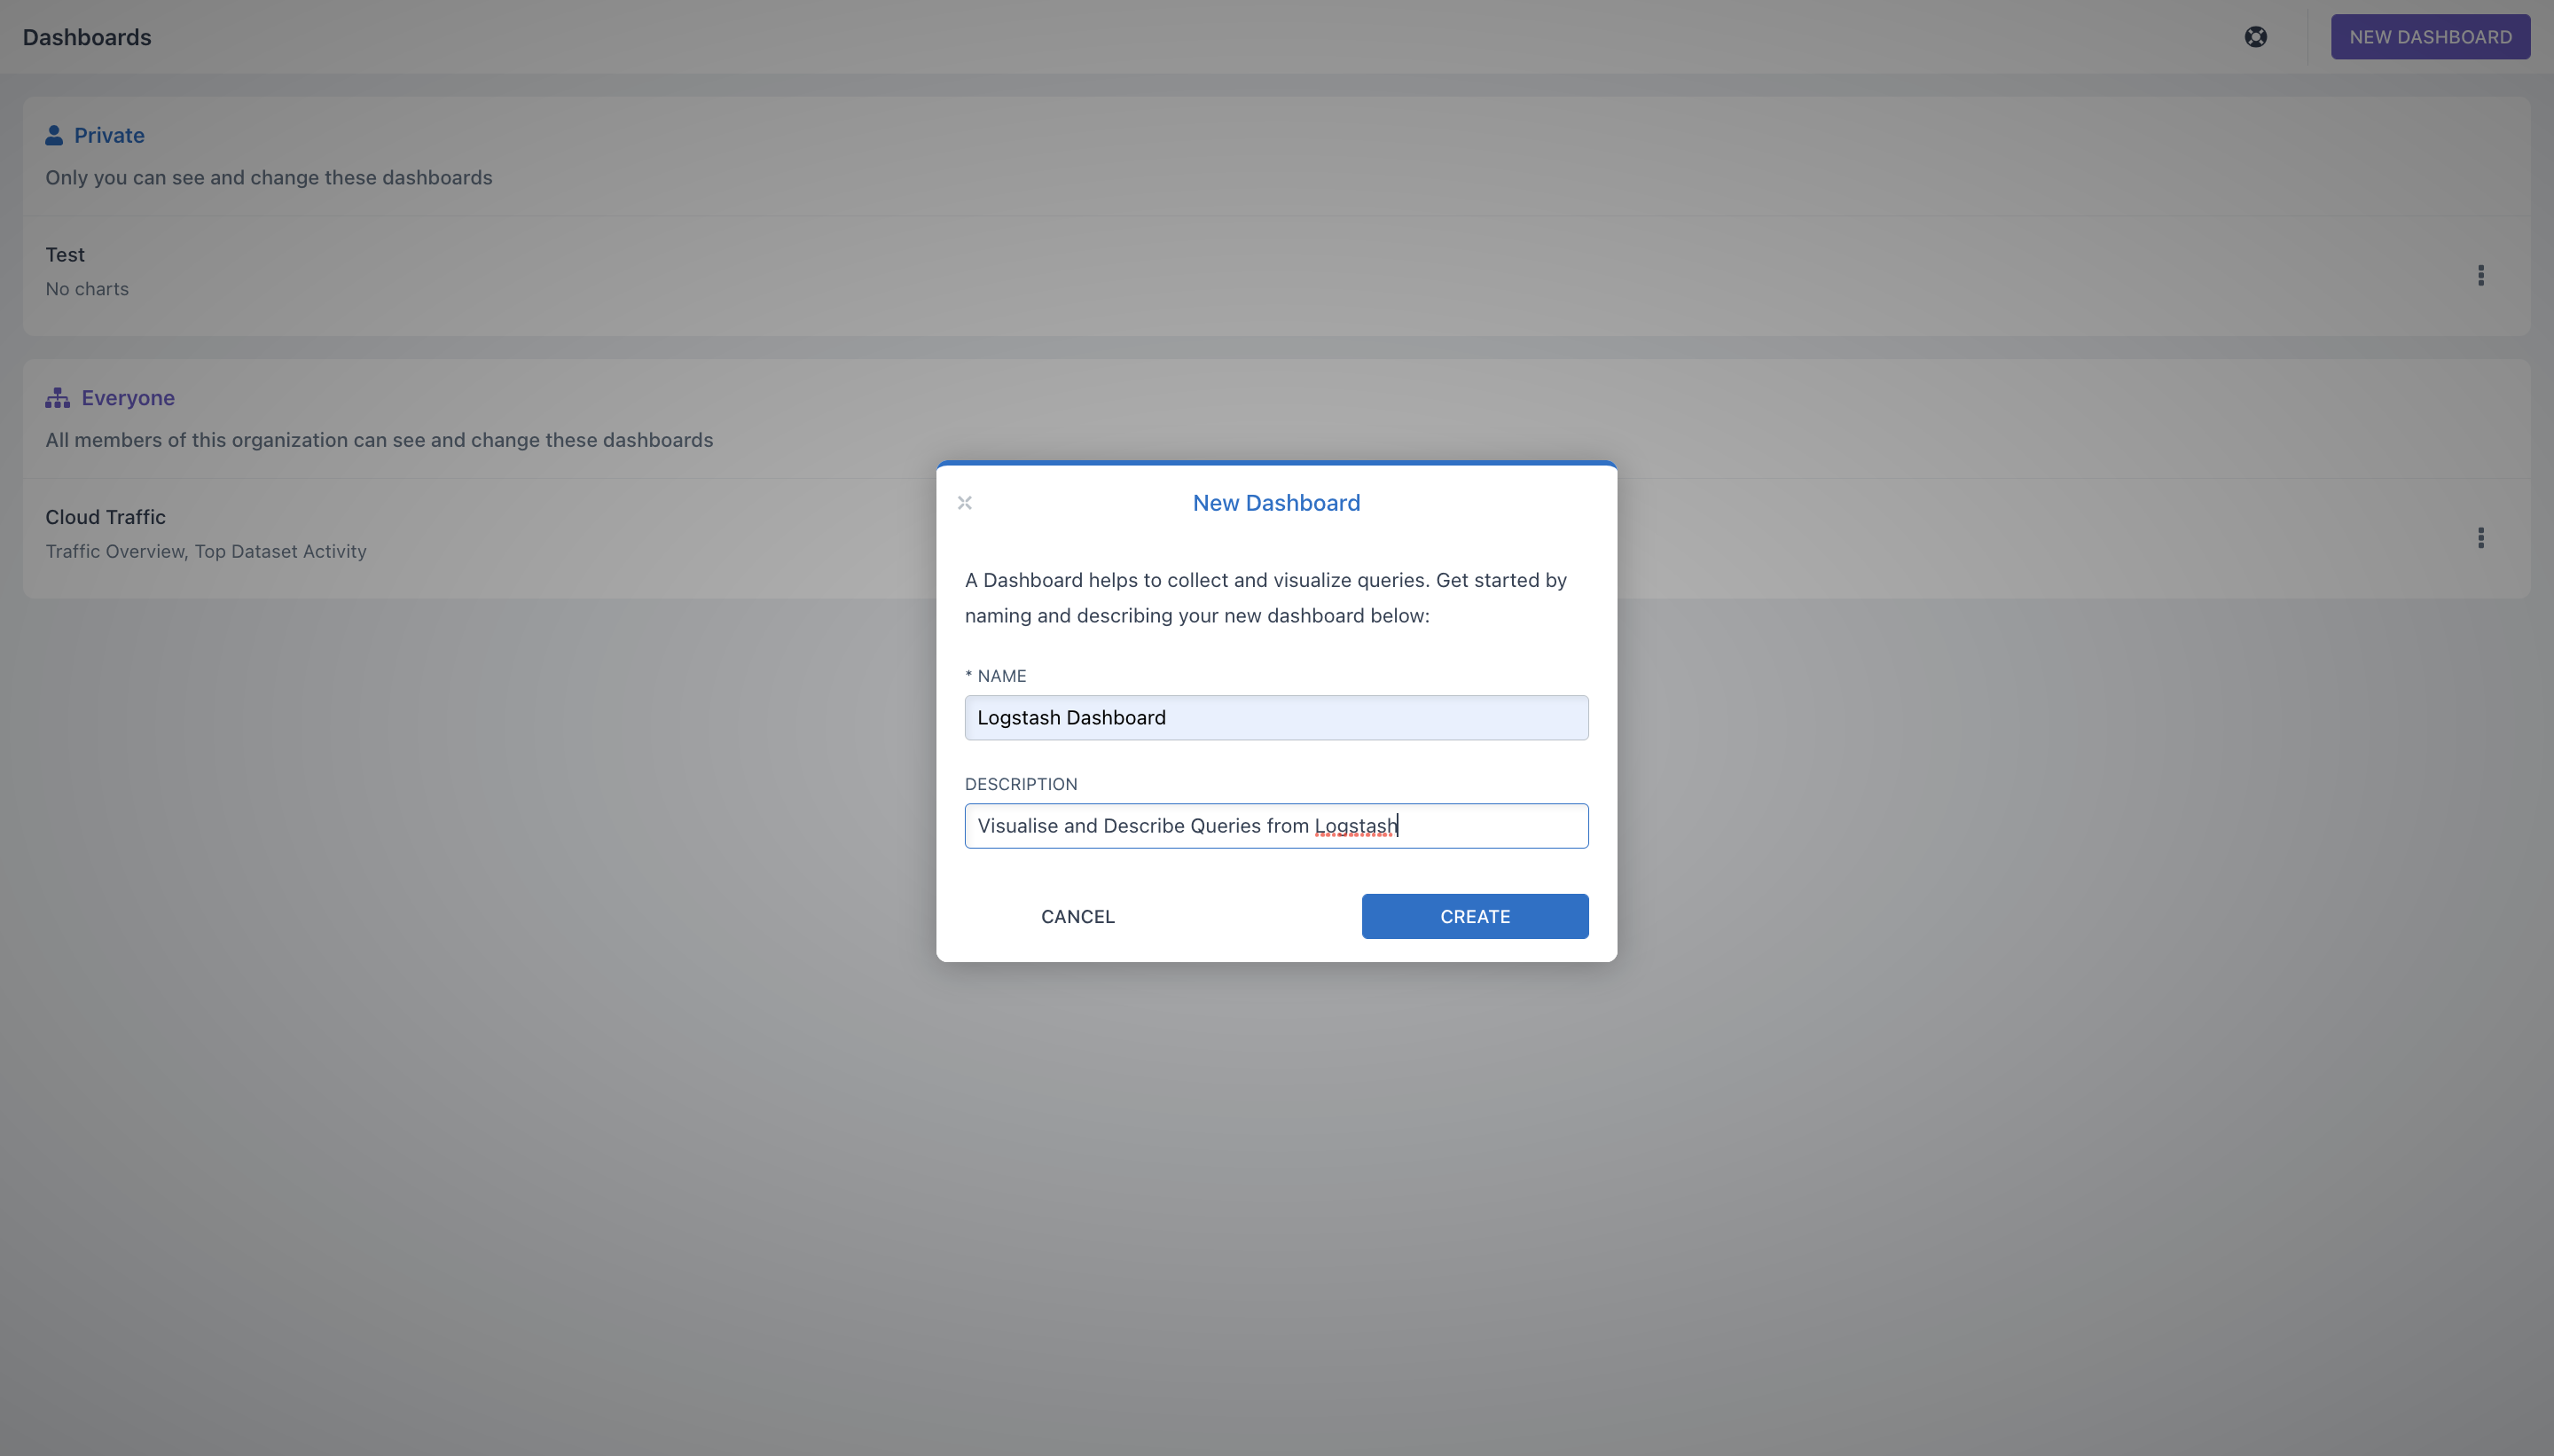
- Select NEW DASHBOARD - you’ll see a dialog that asks you for the name of your dashboard and the description.
- Enter the name and description you want to give your dashboard
- After creating your dashboard, you will see the (+) button, click on it to build your query. This will let you add your first kibana charts to your dashboard.
- You can select which kind of query you want to add. Currently we support Simple Query Builder and Advanced Query Language We will be starting with the Advanced Query Language.
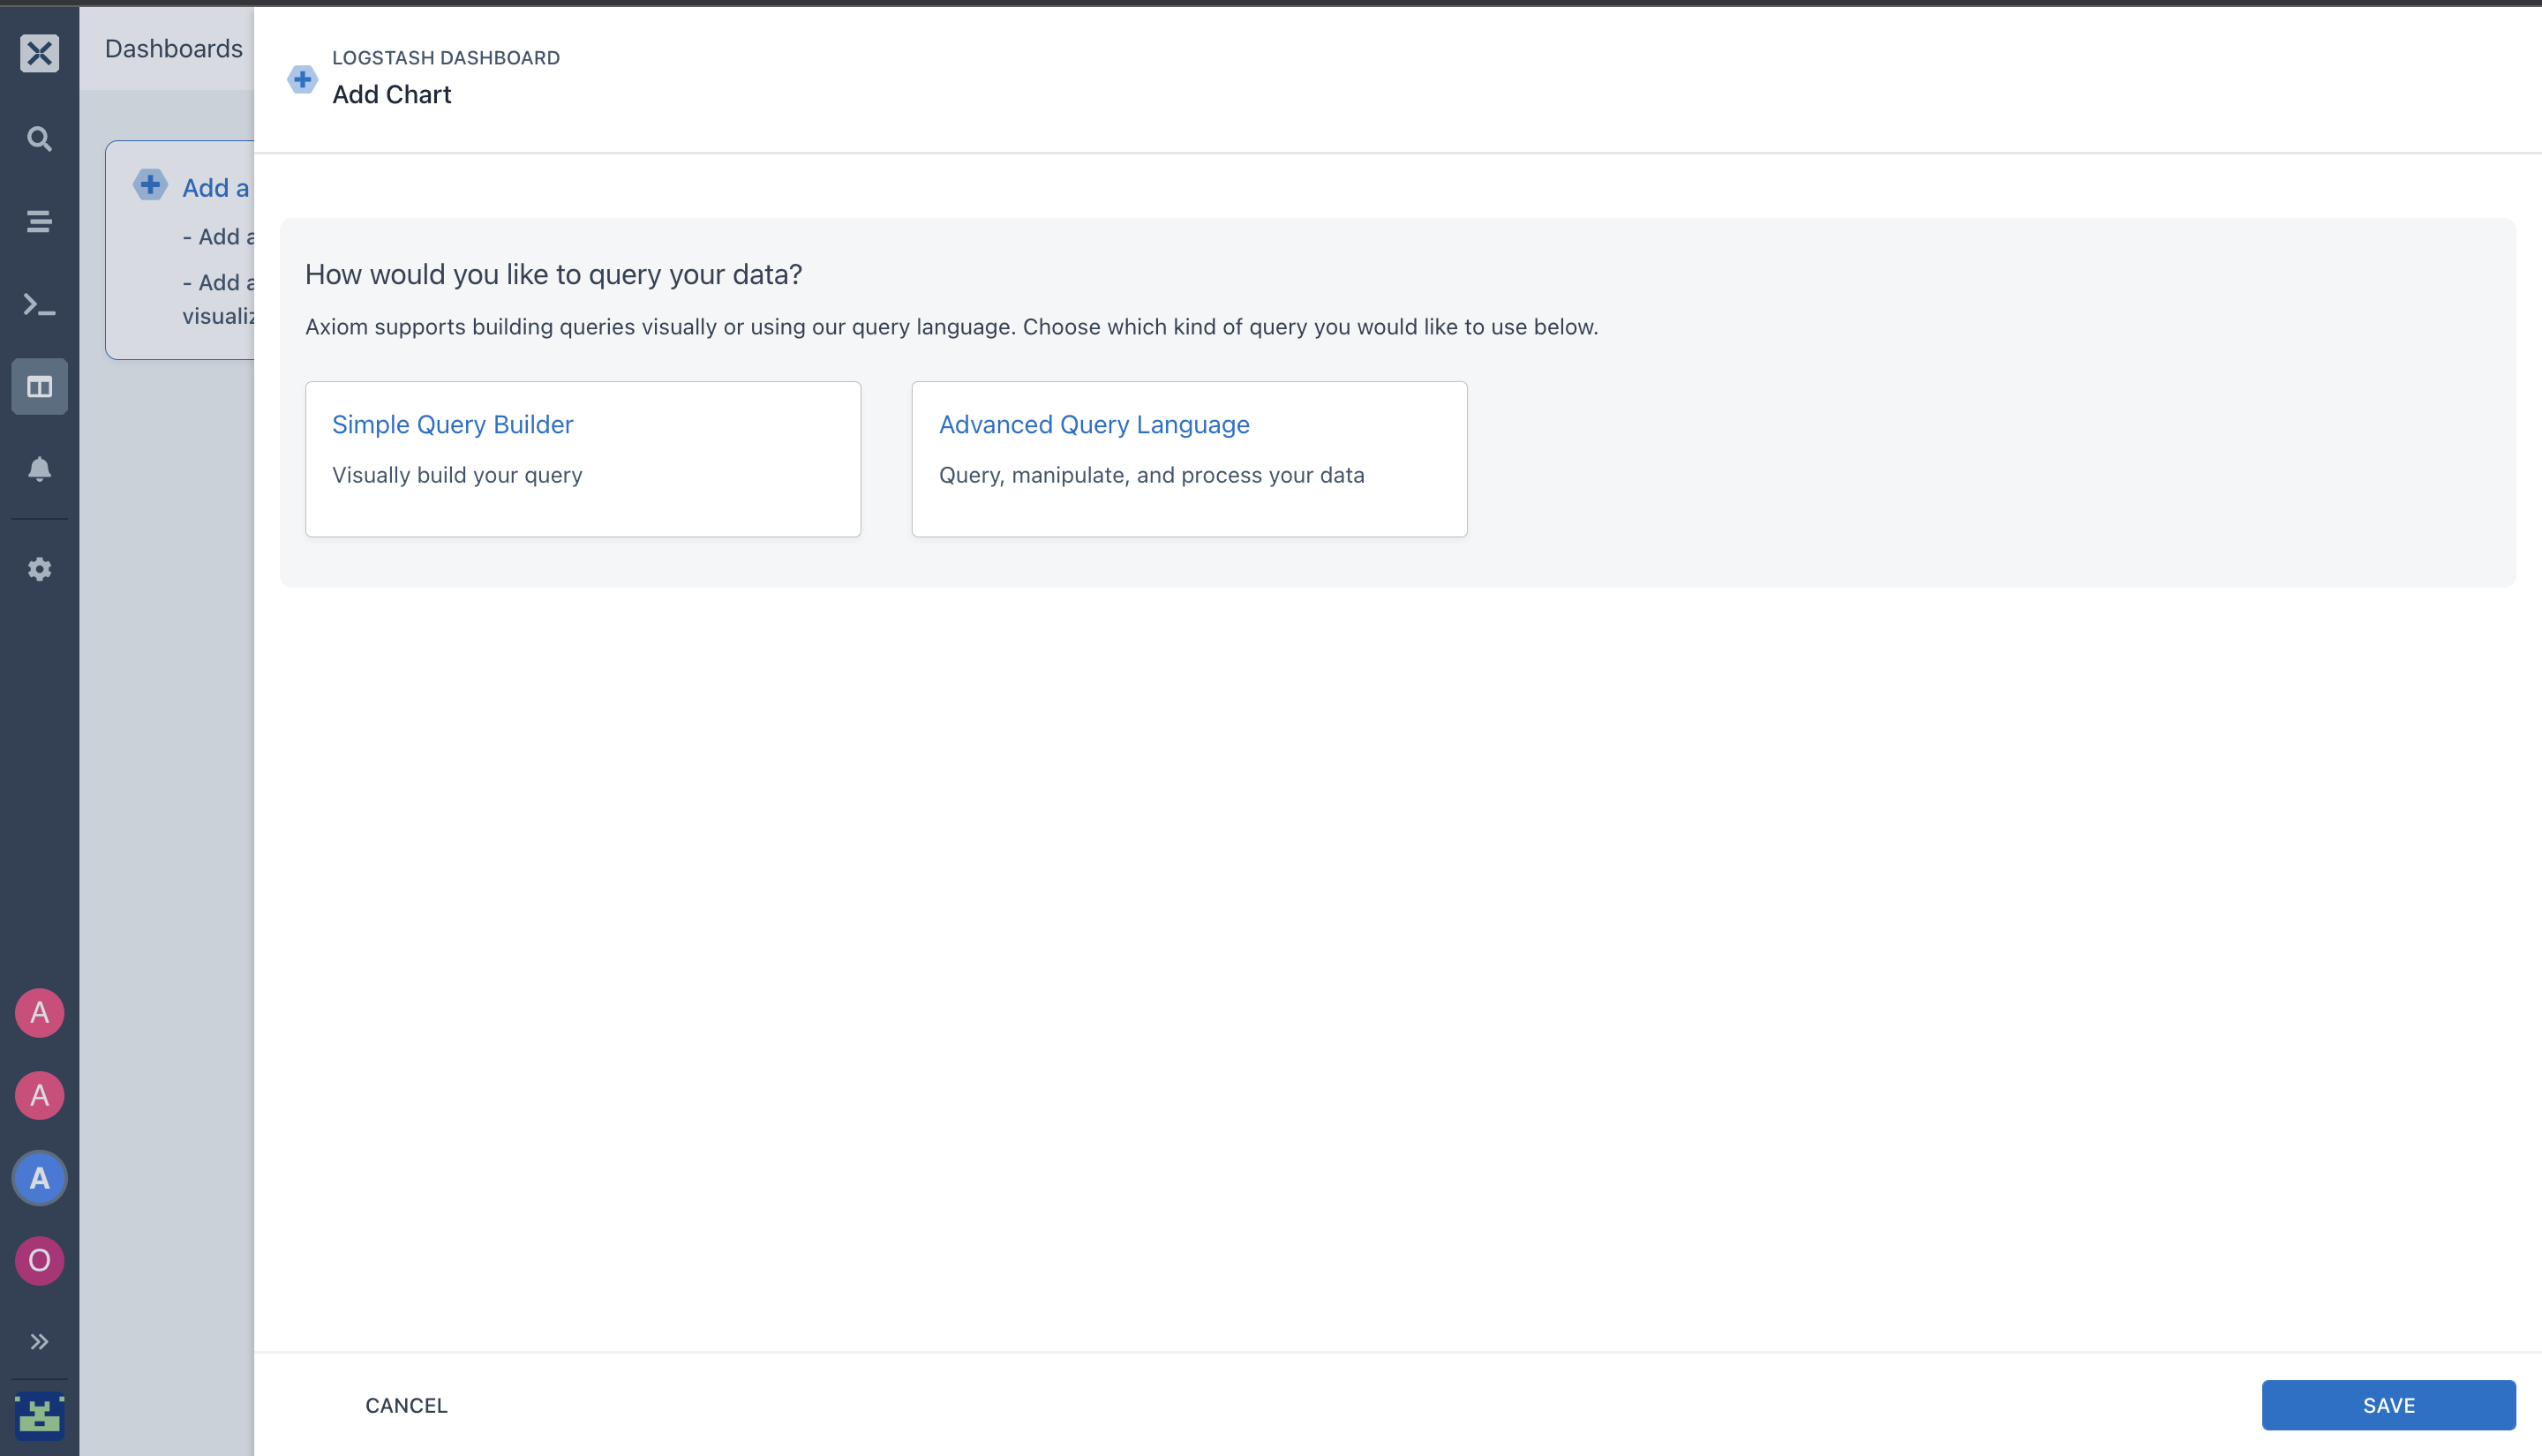
- Use the advanced query builder to query, manipulate and process data using APL.
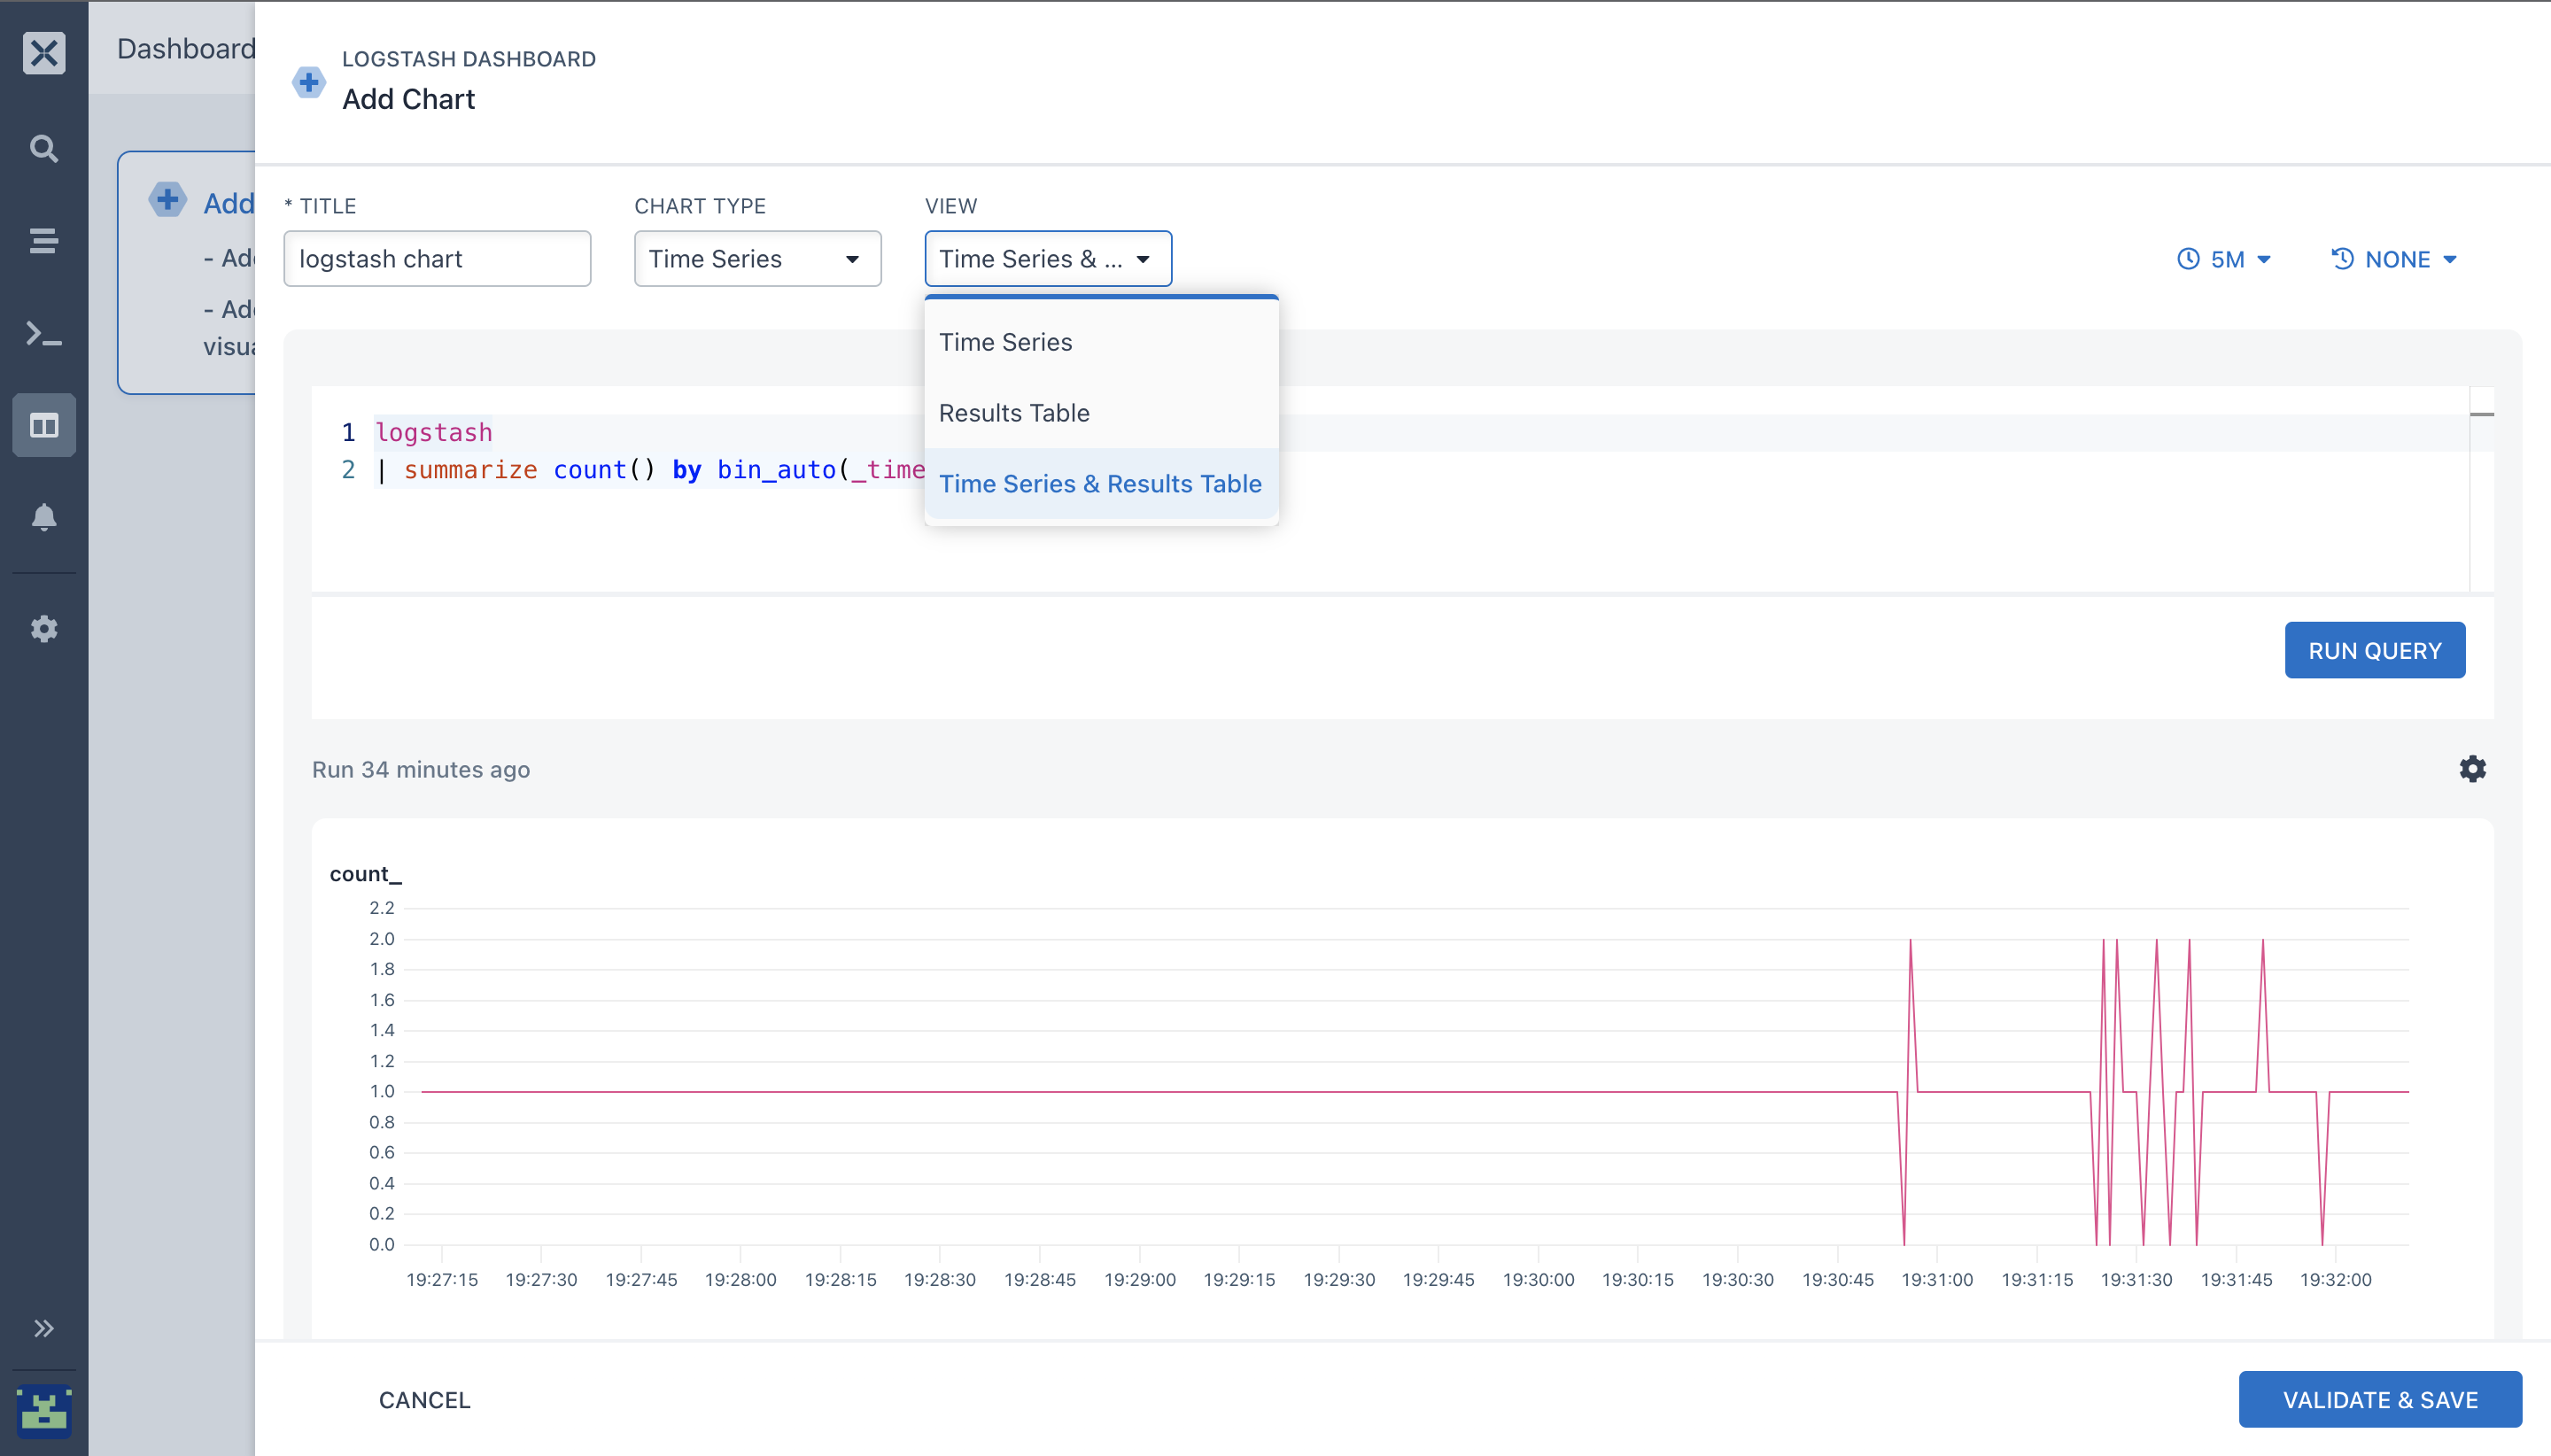
- Select your logstash dataset.
- The Chart type can be Time Series or Statistic
- Your dashboard view can be: Time Series, Results Table or Time Series & Results Table
- When you are done configuring your dashboard, click on VALIDATE & SAVE.
- You can add more queries. In my second chart, I will create a chart using the Simple Query Builder.
- In this chart, I’m visualizing the
top 10values of our@versionfield from our logstash dataset. When you are done, click on SAVE.
- You can combine and add many more charts to your dashboard using the Simple Query Builder or the Advanced query language
- When you are done, you can see your charts in a single view.
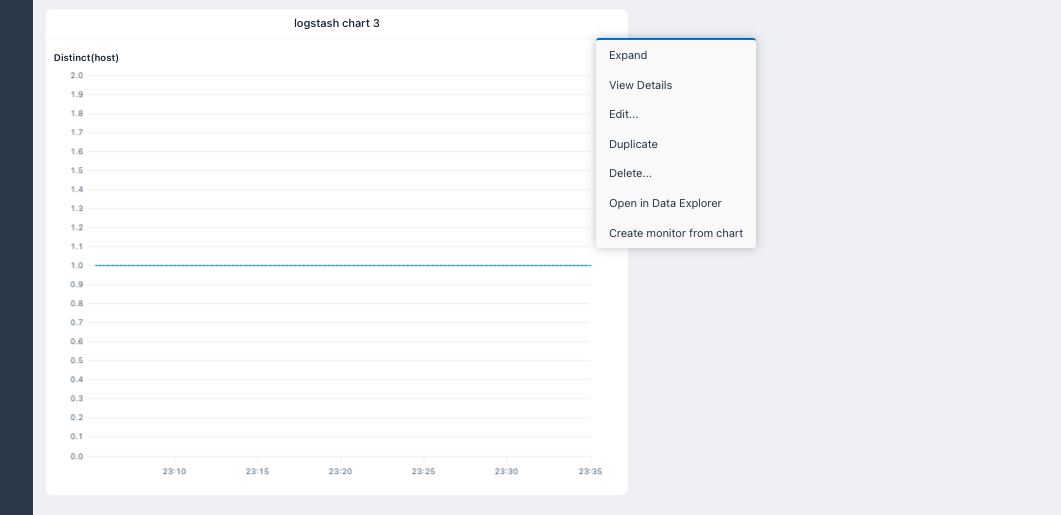
- You can also adjust the size of your charts, duplicate them, Open your charts in Data Explorer, or create a monitor from chart by selecting the icon at the top right of each chart.
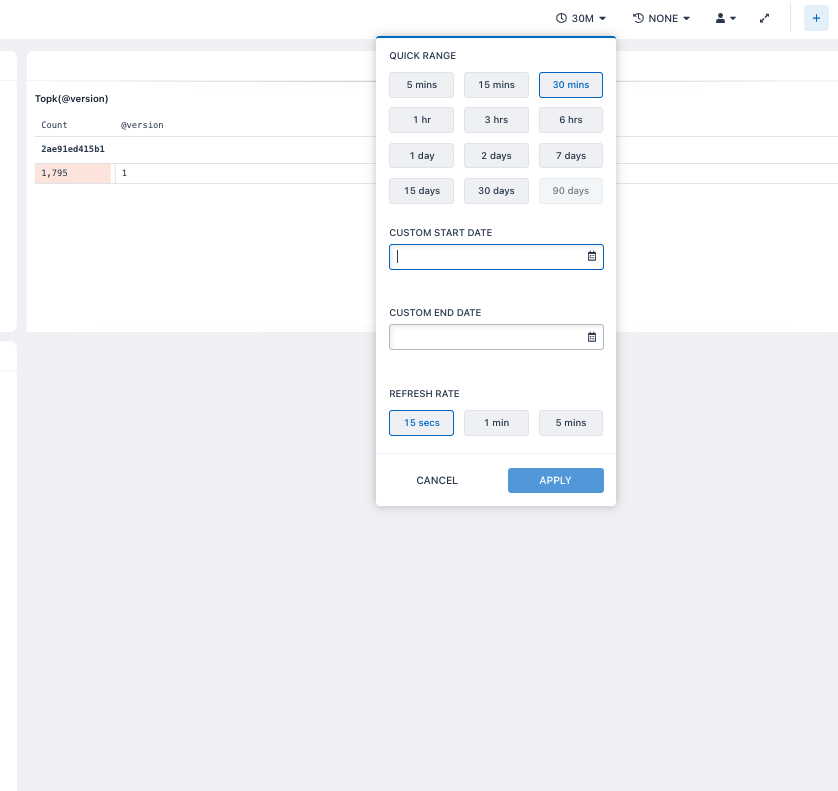
- To access the Dashboard settings, select the icons at the top right corner of the dashboard which let you:
- Share your dashboard views with everyone on the team.
- Choose your specific time rate and create a custom time range for a particular or all queries in an organized widget display.
- Compare against using a custom time.
- View your dashboard in full screen.
Happy querying!
We have our Sandbox environment for you to play with different datasets, run queries, stream events and analyze your datasets. Check out Axiom Playground.
Help 'n' tips 'n' fun
Whew! If you can do all that, you are all set to be off to the races to build your own Queries and run Aggregations from your logstash pipeline.
You can see how fast and easy for you to run queries using Axiom Data Explorer, create visualizations using aggregations, and build dashboards on your Logstash data.
If you have specific questions or issues configuring the file, I'd love to hear about them. Contact us here or ask a question in our Discord community!
For further reading, check out the official documentation on the power of Axiom Processing Language and if this article helped you out, let us know on Twitter!


