
Cloudflare Workers provide a serverless execution environment that you can use to rewrite HTML, perform A/B testing, cache requests and much more. Today we’re excited to announce that you can now log your HTTP requests directly to Axiom via a Cloudflare Worker.
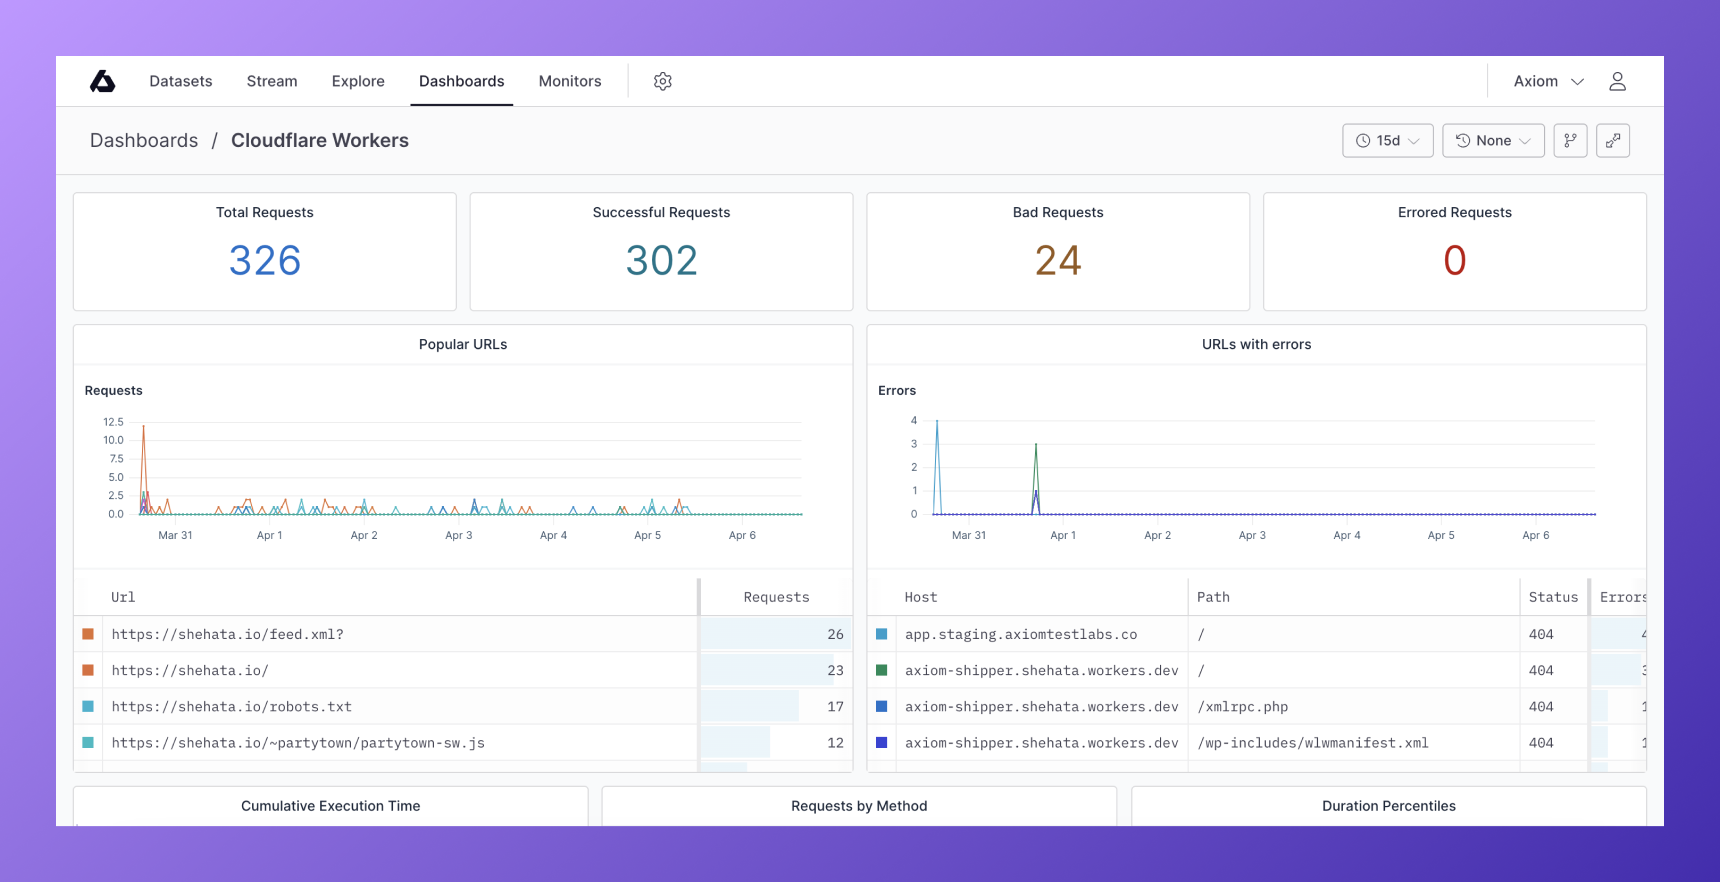
The automatic dashboard gives you granular insights into your monitored Cloudflare sites, answering these questions and more:
- How many requests were made in total?
- How many were successful and how many failed?
- Which routes fail the most?
- What’s the P50, P90, P95, and P99 execution time?
- Where do requests come from?
This helps you to optimize your site and quickly react to any changes or issues. Dive into the log stream to see patterns emerge and set up a monitor to get notified on error rate spikes.
Get Insights into URLs with Errors
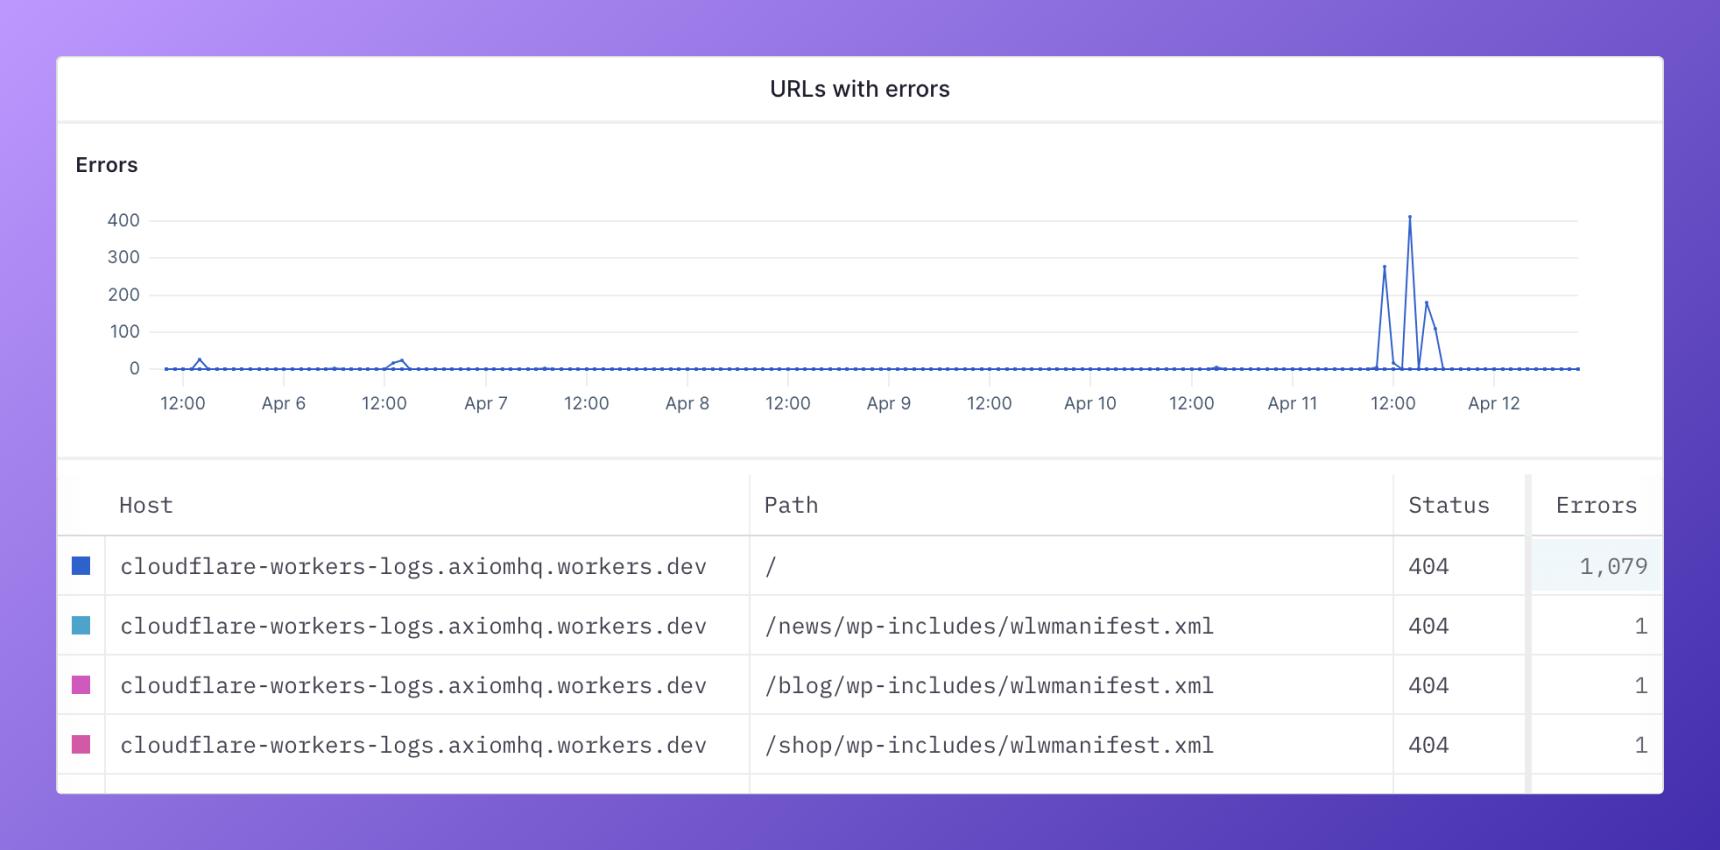
This chart shows you the URLs that most often return an error. In the chart above we can see that the root path of our test site returns 404. This can be super useful when routes suddenly start to return errors, for example, because of a missing asset.
Find Slow Routes
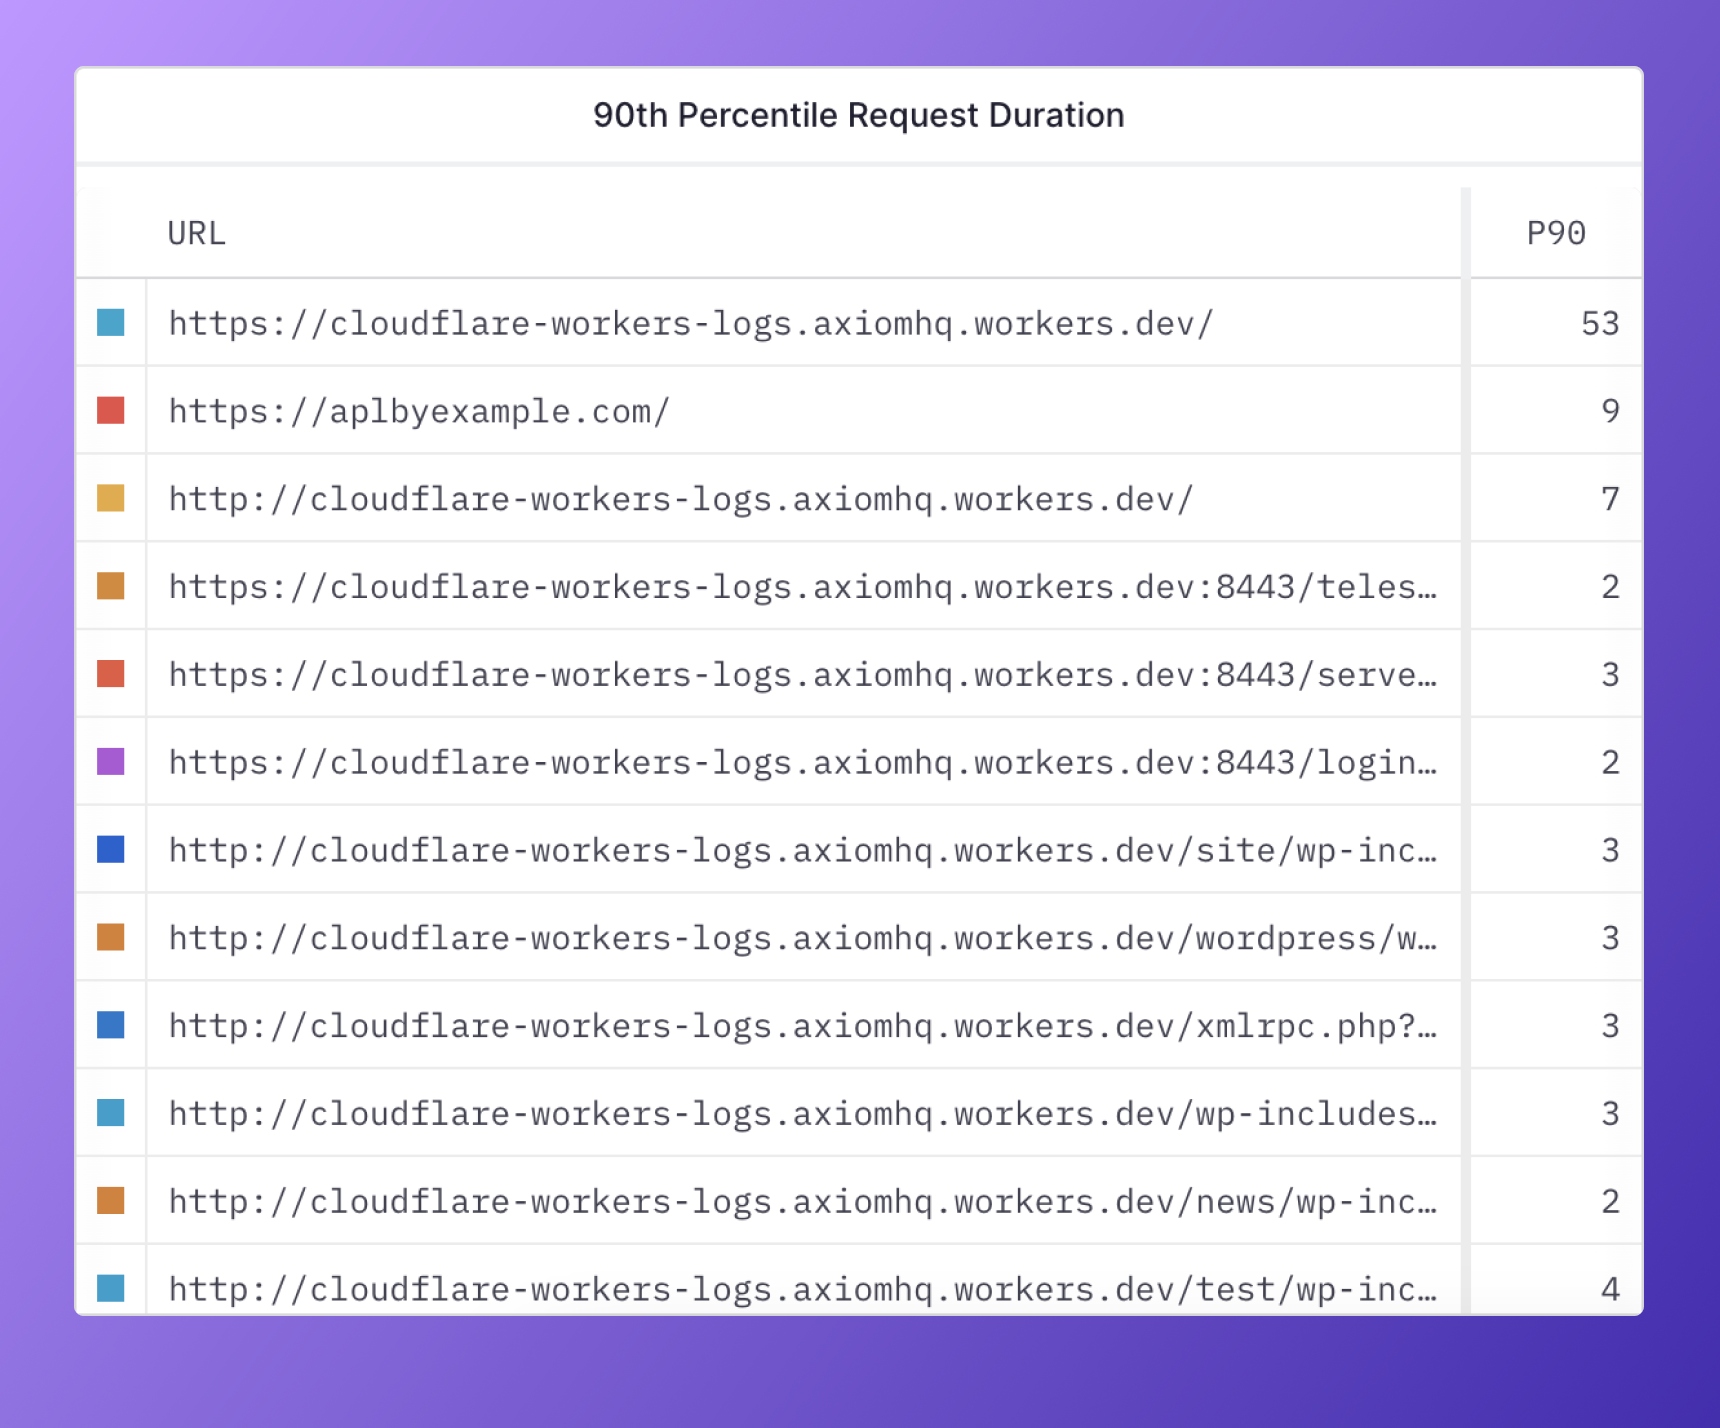
This chart shows you the 90th percentile request duration of your slowest routes so you can start optimizing.
Get Notified on a High Error Rate
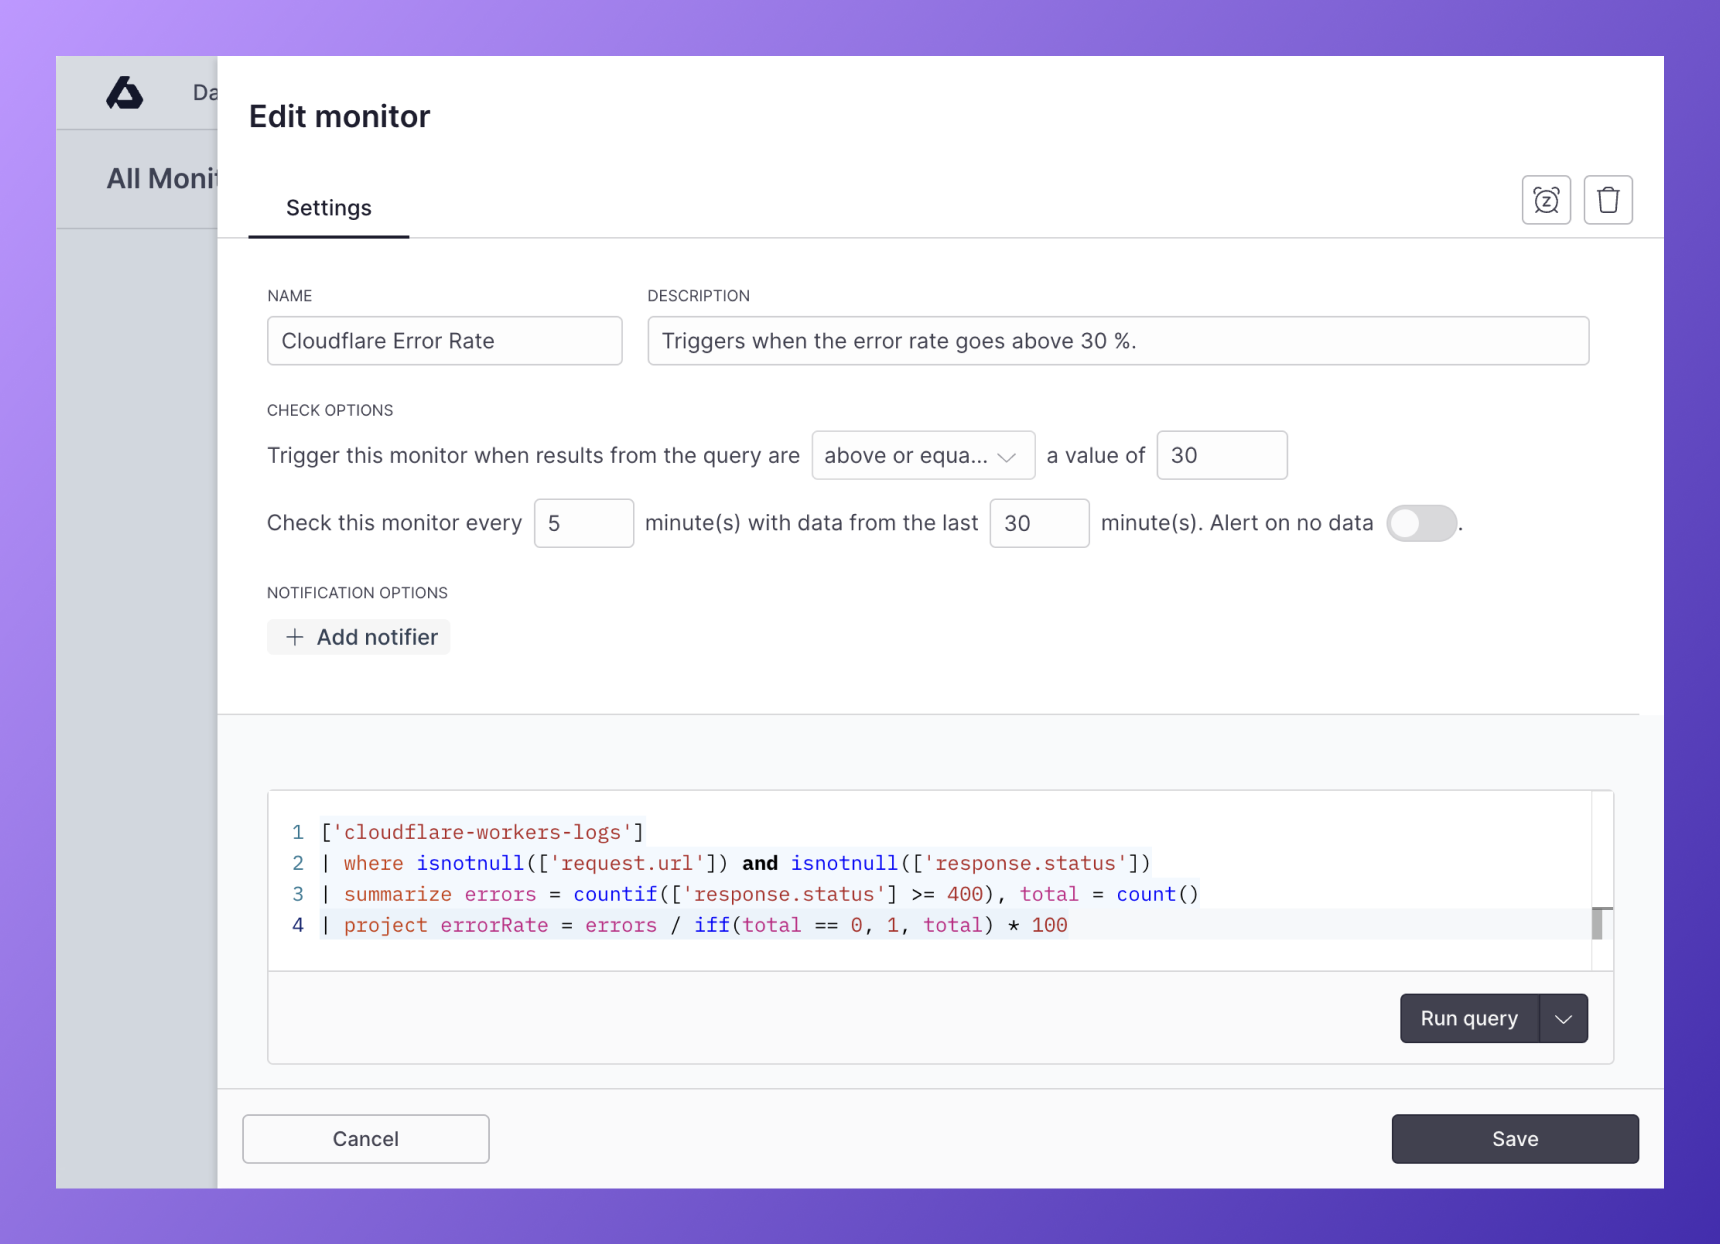
Get notified of elevated error rates to be able to act in a timely manner on a channel of your choice (we support Slack, Email, Discord, PagerDuty, and many more).
Start Logging Cloudflare requests with Cloudflare Workers and Axiom
Head to the Axiom Cloudflare Workers documentation today and set up the advanced monitoring on your Cloudflare sites, measure request duration, error rate, popular regions, popular URLs, and more.
- Find out more about Cloudflare Workers in GitHub.
We’re also working on an integration for Cloudflare Logpush, stay tuned!
- Come share ideas and feedback with us on our Discord Community.


