
As the transforming power of big data expands across business environments, the volume of your data streams also grows to new magnitudes, performance and identifying problems and failures also grow on a very large scale. To discover valuable business insights and answer critical questions and make data-driven decisions on the go, a massive amount of your data needs to be stored, analyzed, and monitored in seconds.
Axiom Data Explorer is a high-performance analytics platform that brings every business the power to explore and monitor that ocean of data featuring the intuitive Axiom Processing Language and powerful ingestion and storage capabilities. Axiom Data Explorer is the perfect service to analyze, and monitor high volumes of fresh and historical structured data, get insights into the way your backend and applications are performing, and run super-fast queries in seconds.
In this tutorial, I will show you how to monitor your applications using Data Explorer.
Prerequisites
- Dataset & Token created on the Axiom dashboard.
- Access to Axiom Cloud
- Ingested data into your dataset.
Let’s roll 😤
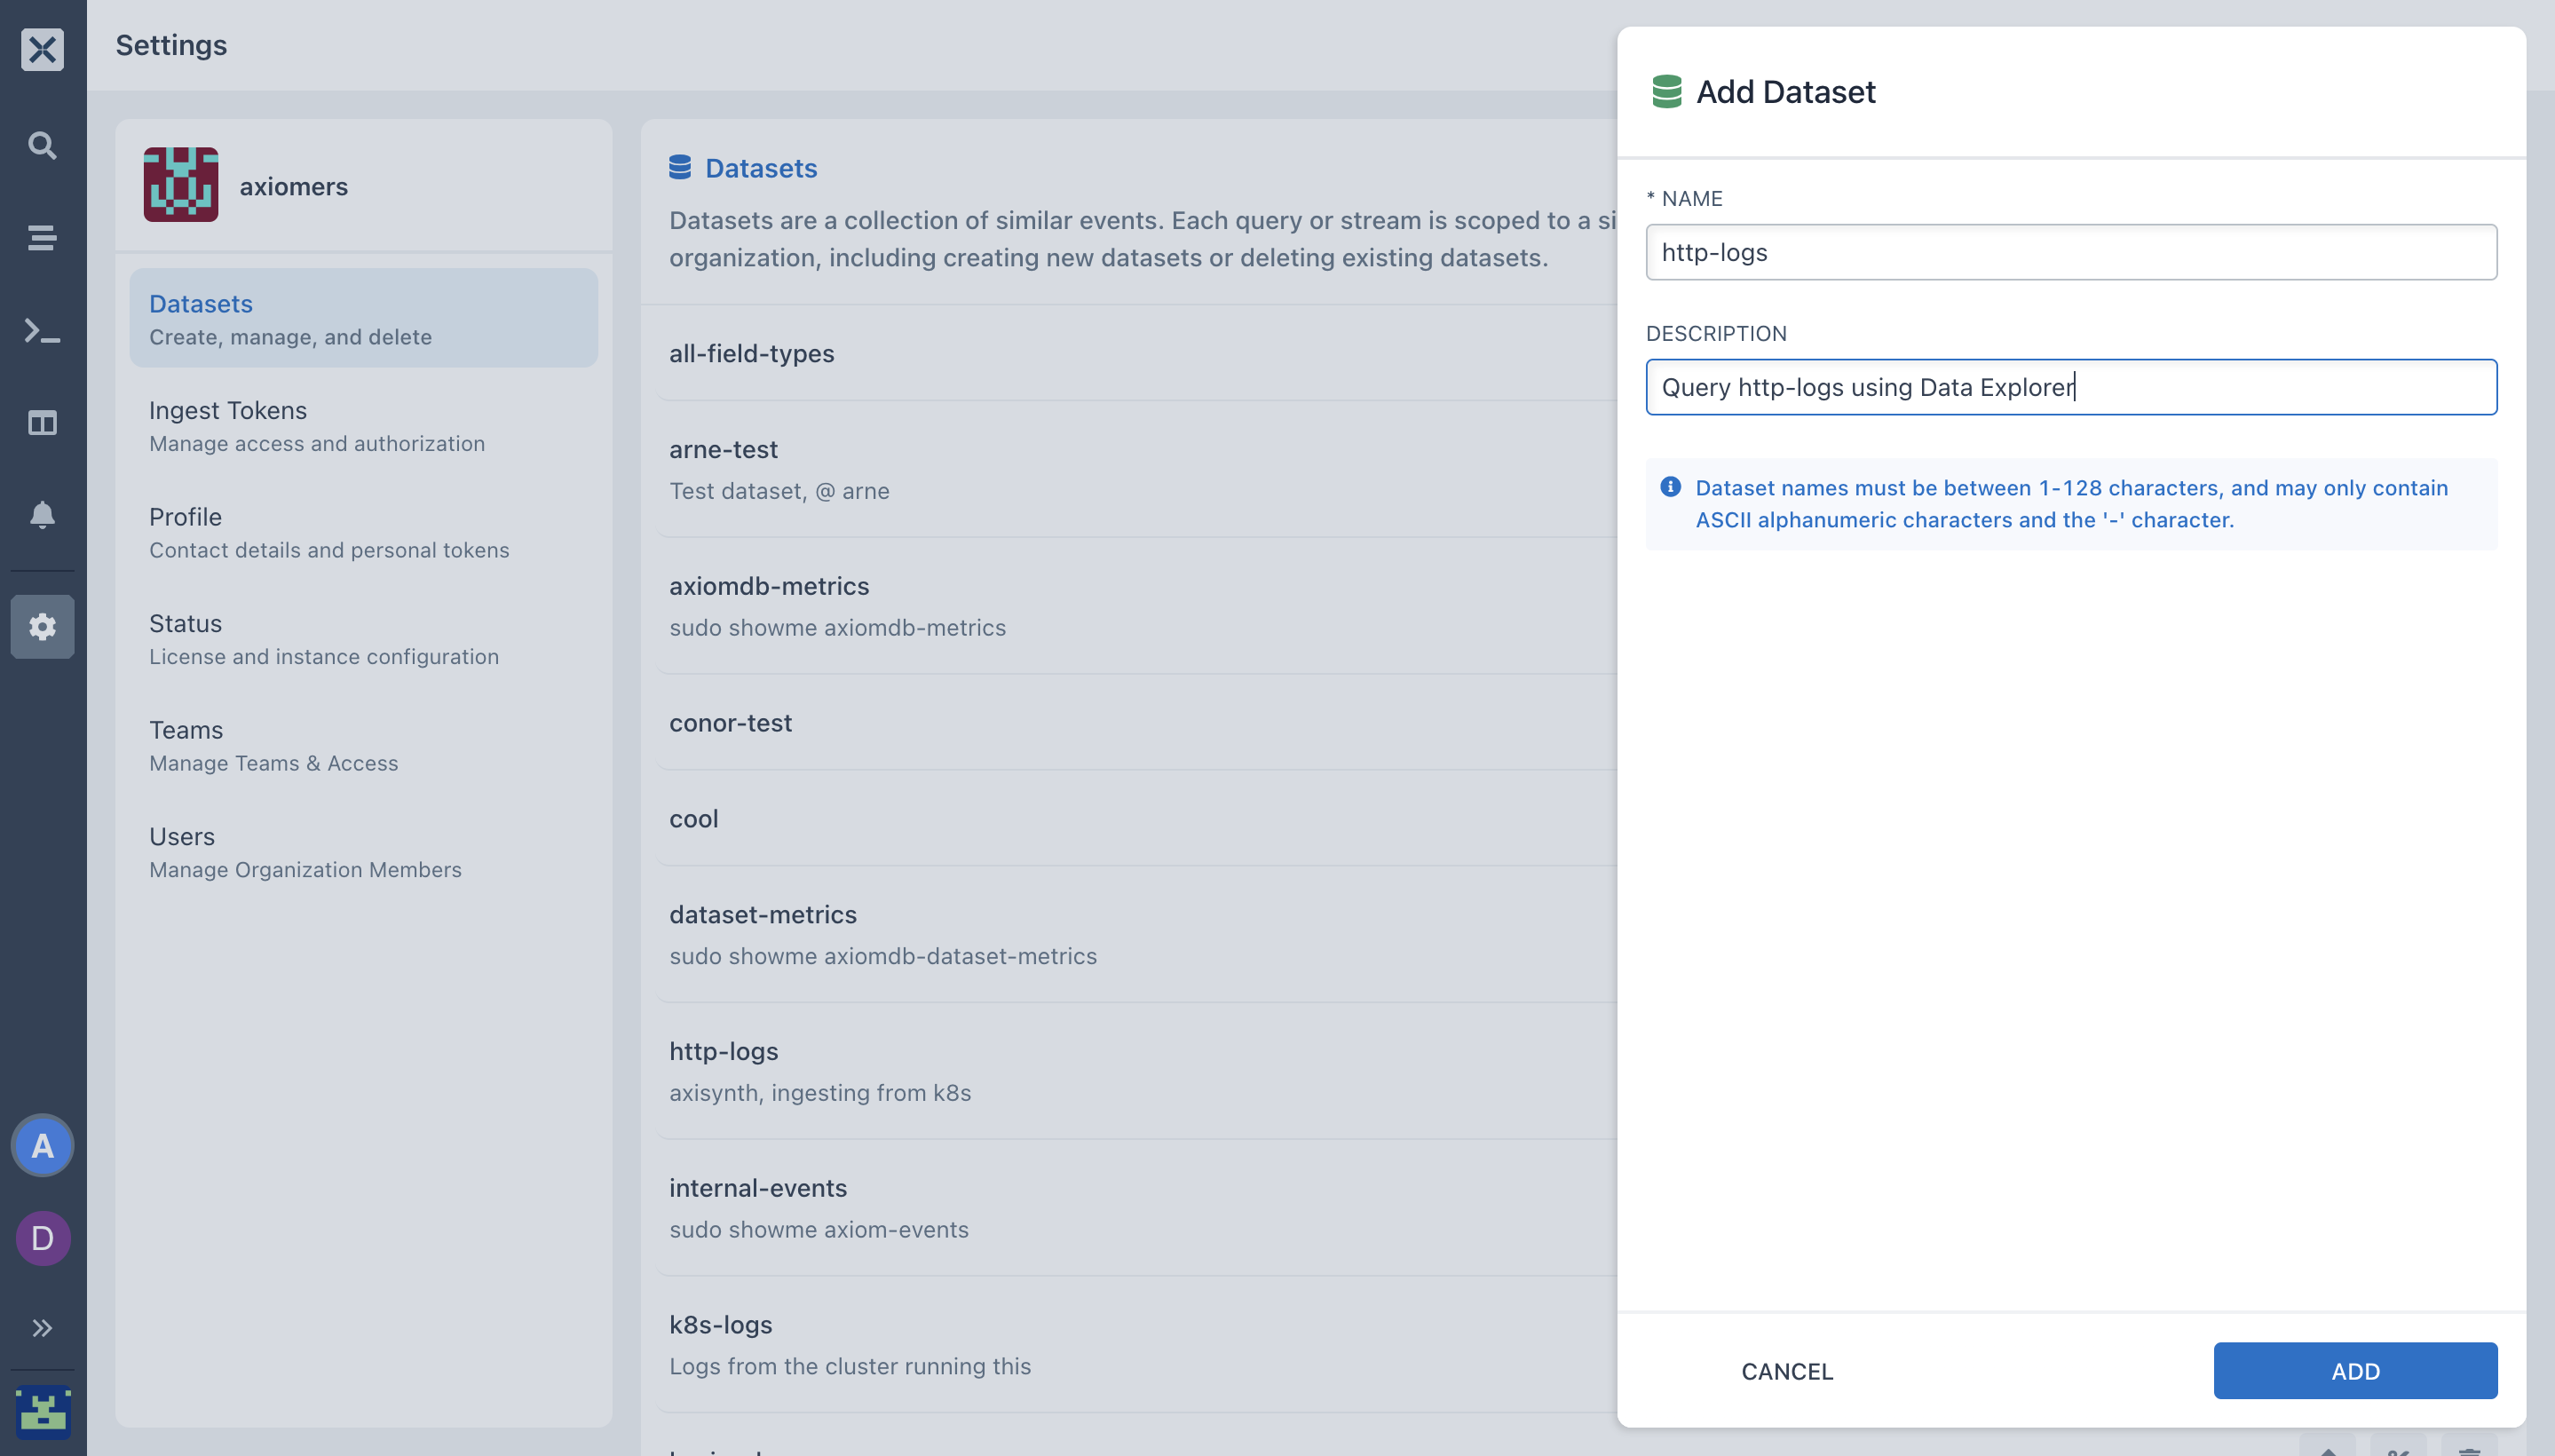
- Create your dataset by selecting Settings → Datasets.
- Ingest data into your dataset by using any of the data shippers we support.
- Generate your ingest token,
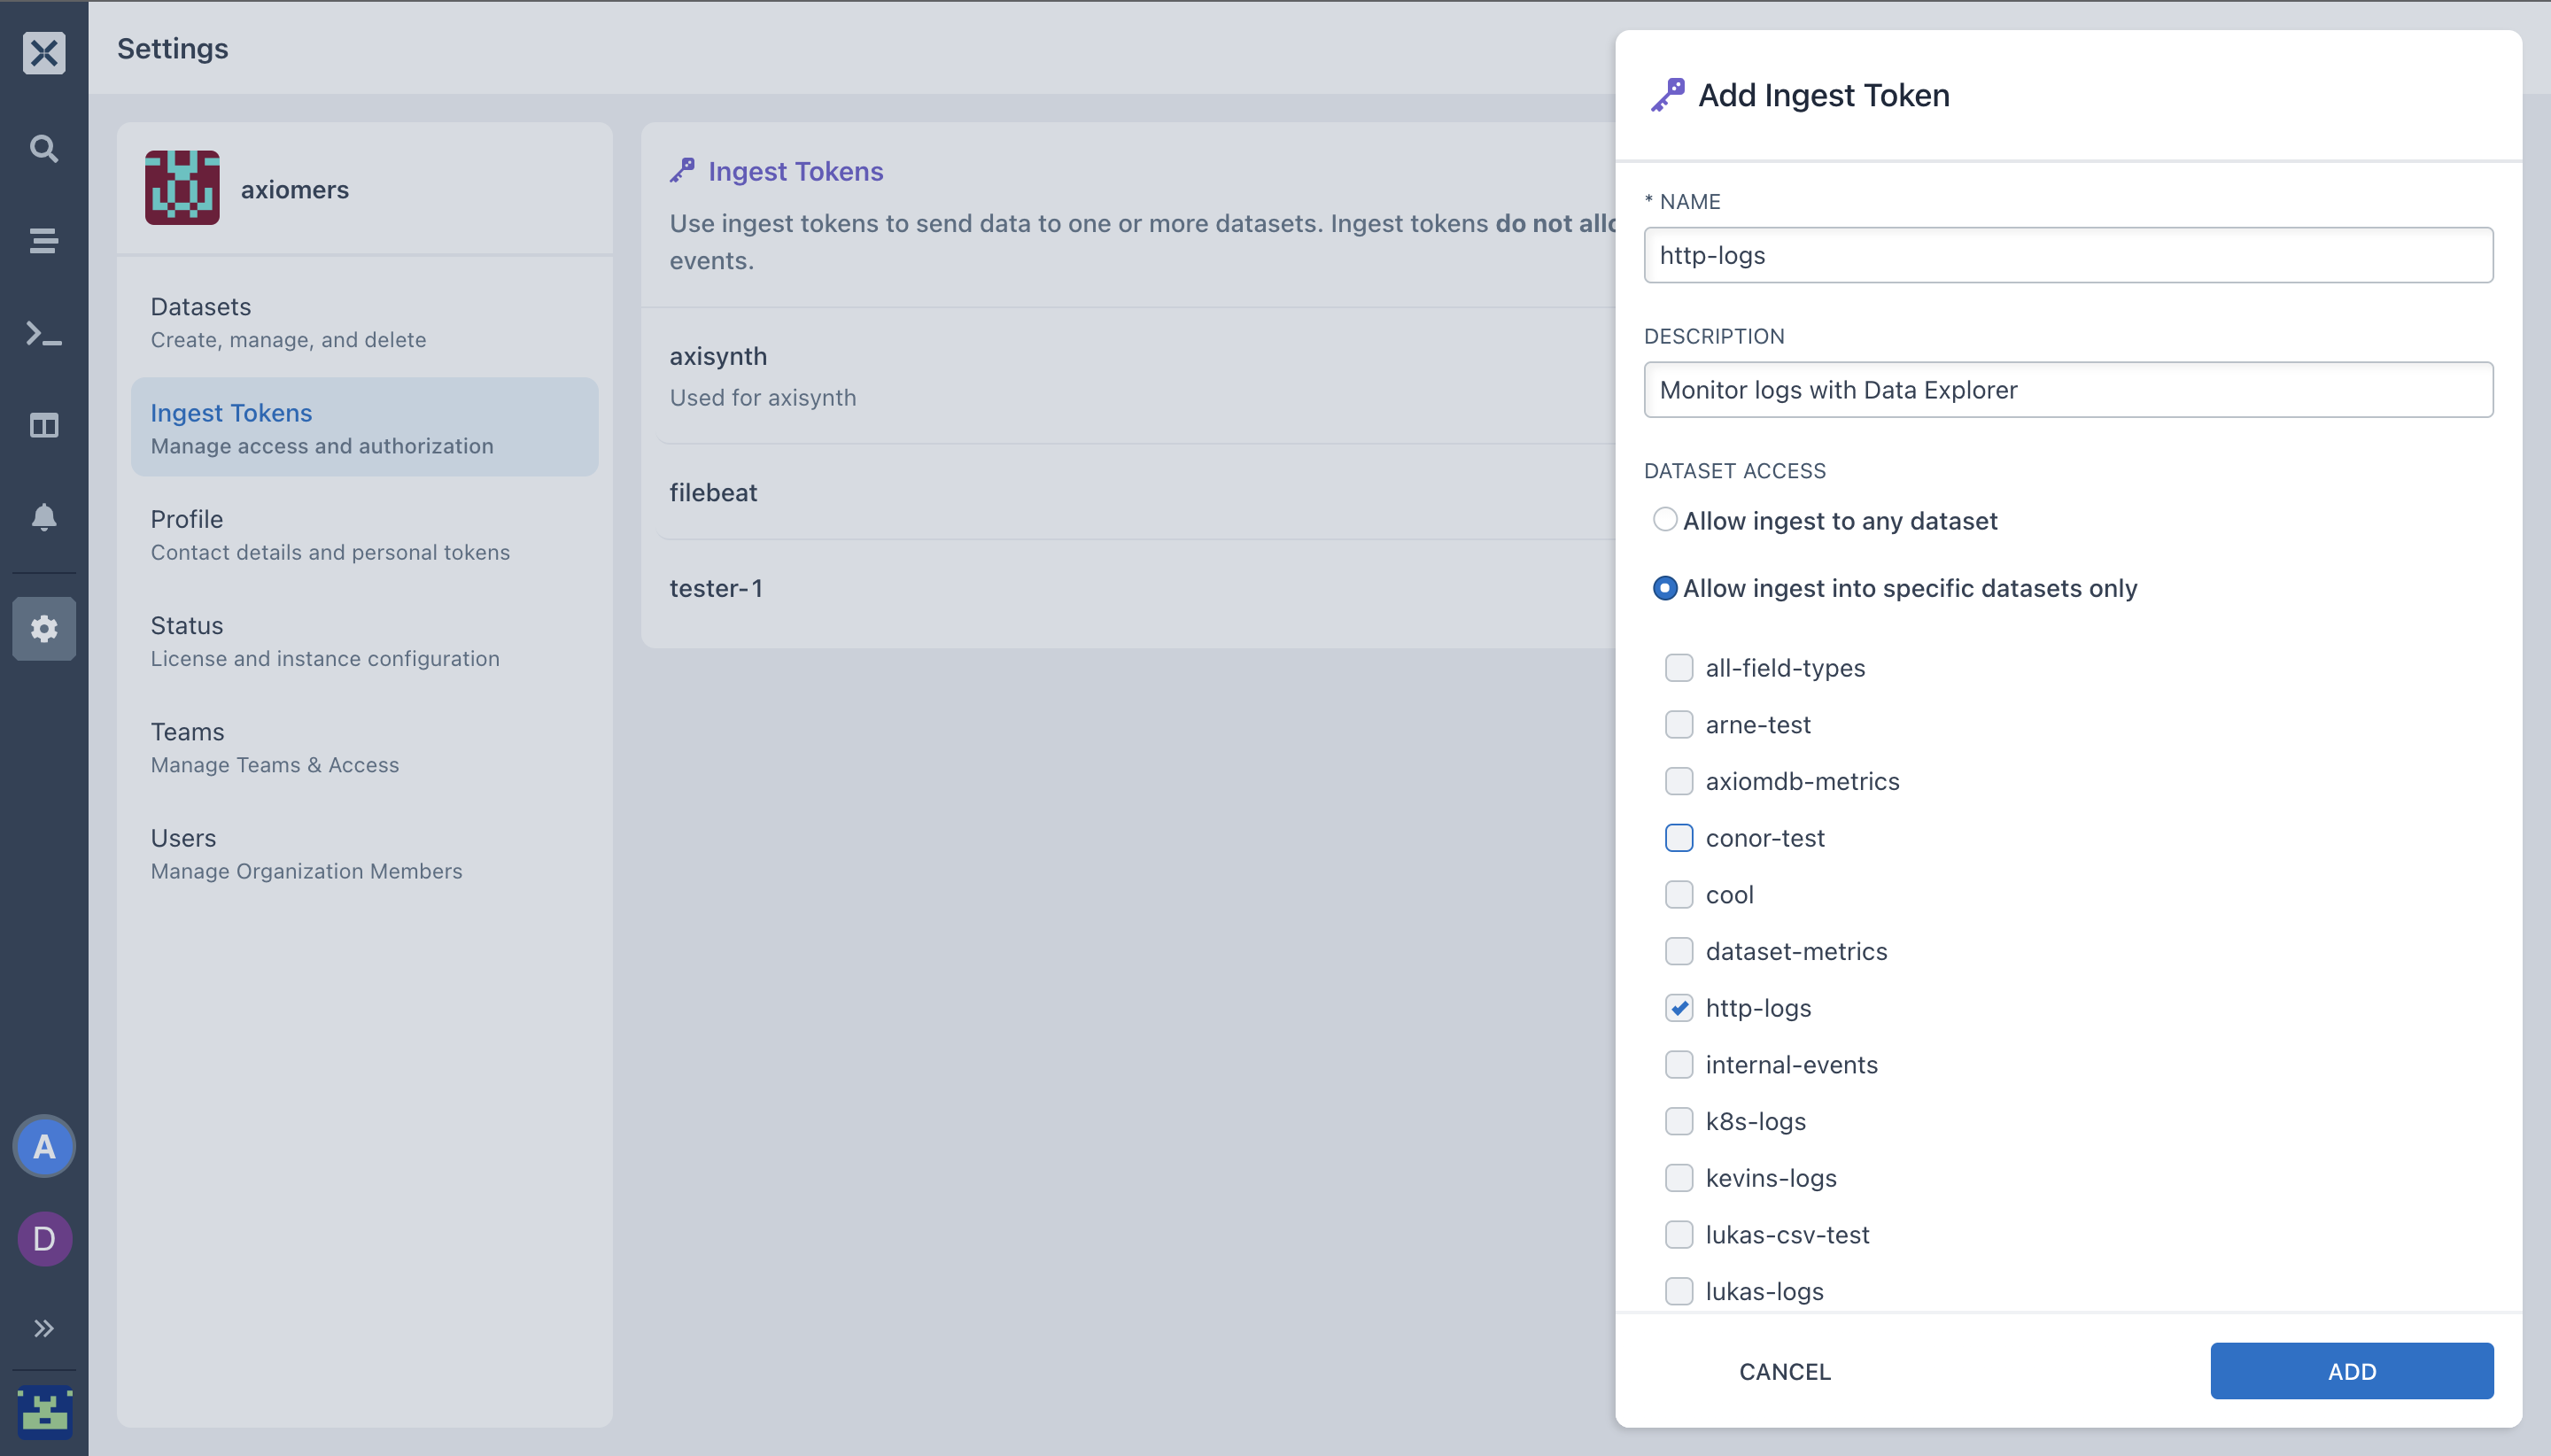
- In the Axiom UI, click on settings, select ingest token.
- Select Add ingest token.
- Enter a name and description and select ADD.
- Copy the generated token to your clipboard. Once you navigate from the page, the token can be seen again by selecting Ingest Tokens.
You can also run queries on Data Explorer using our Sandbox
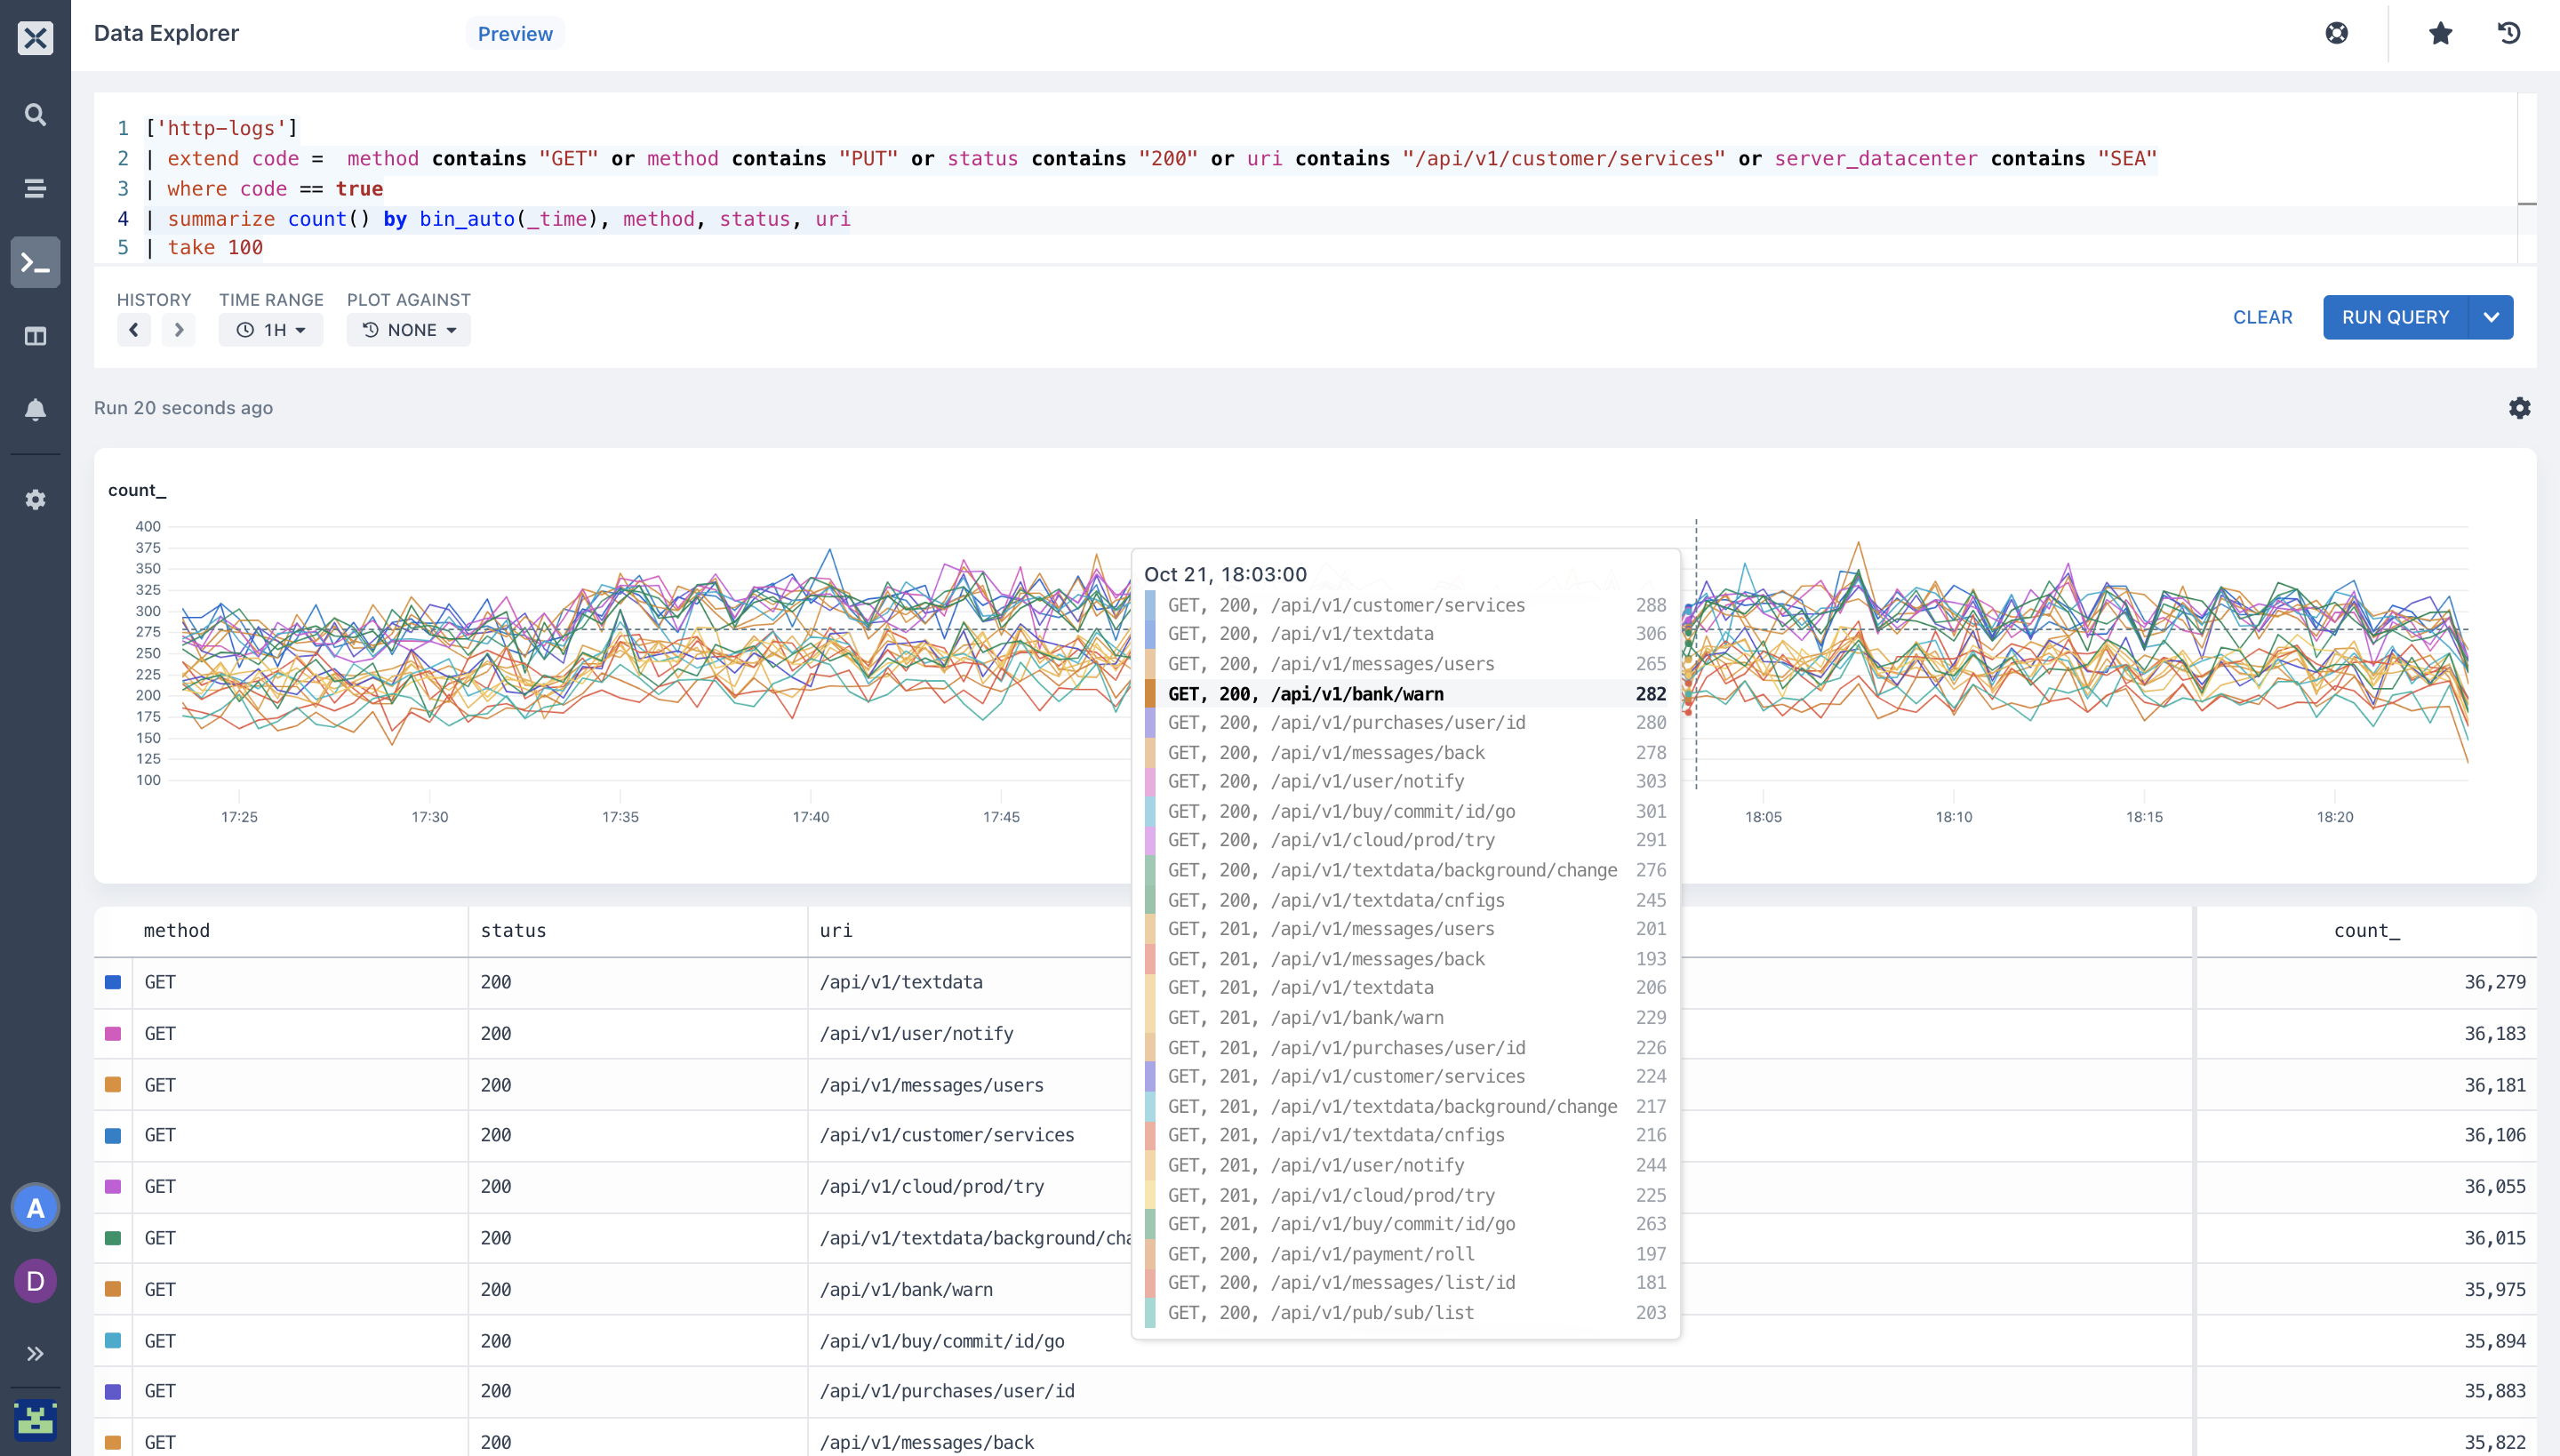
- On the Axiom dashboard, select the fourth (4th) icon on the pane, which is the Data Explorer dashboard.
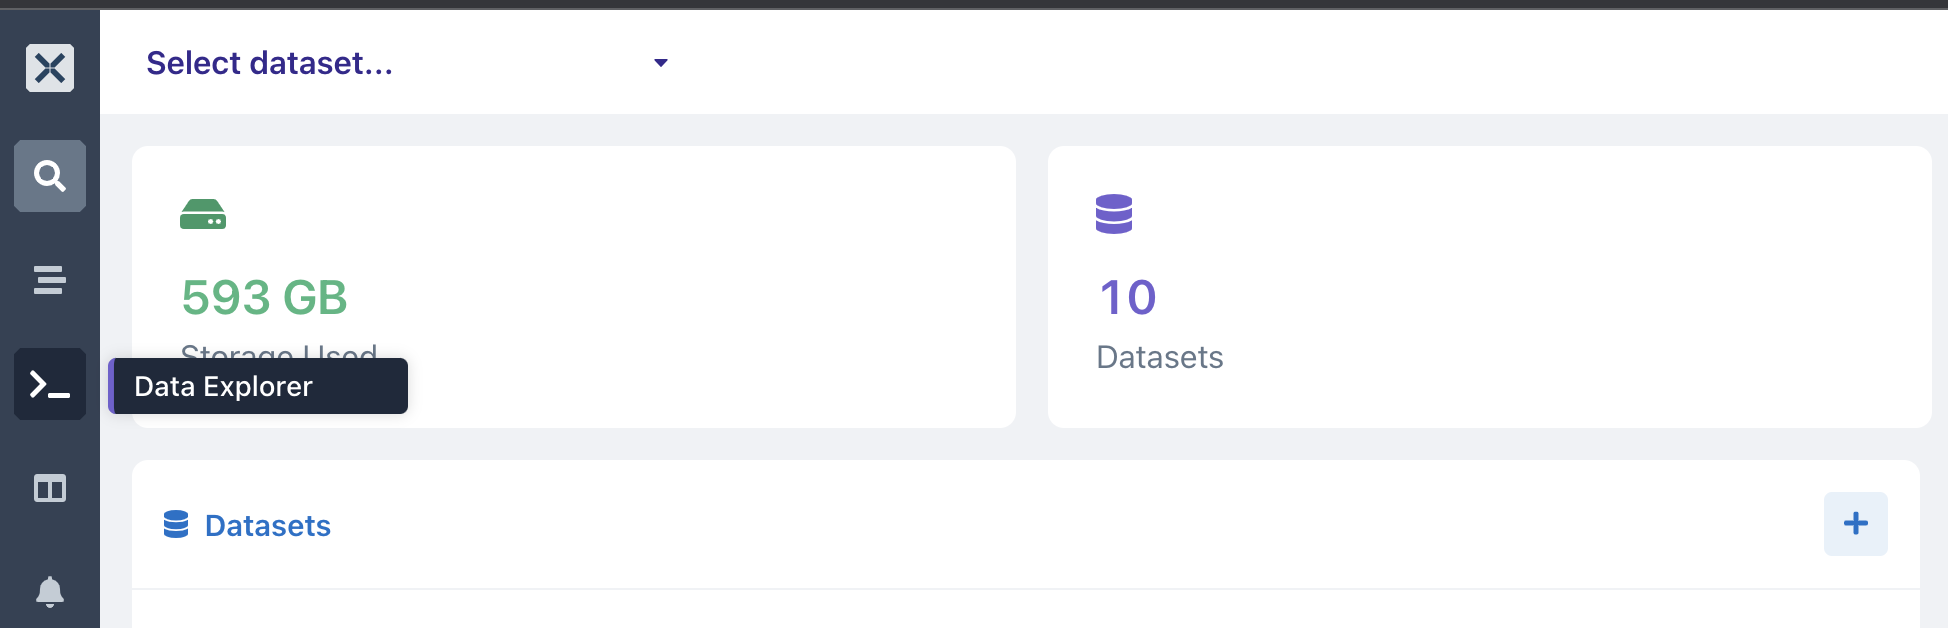
- You can start running queries, monitor your datasets, and get insights into your resources.
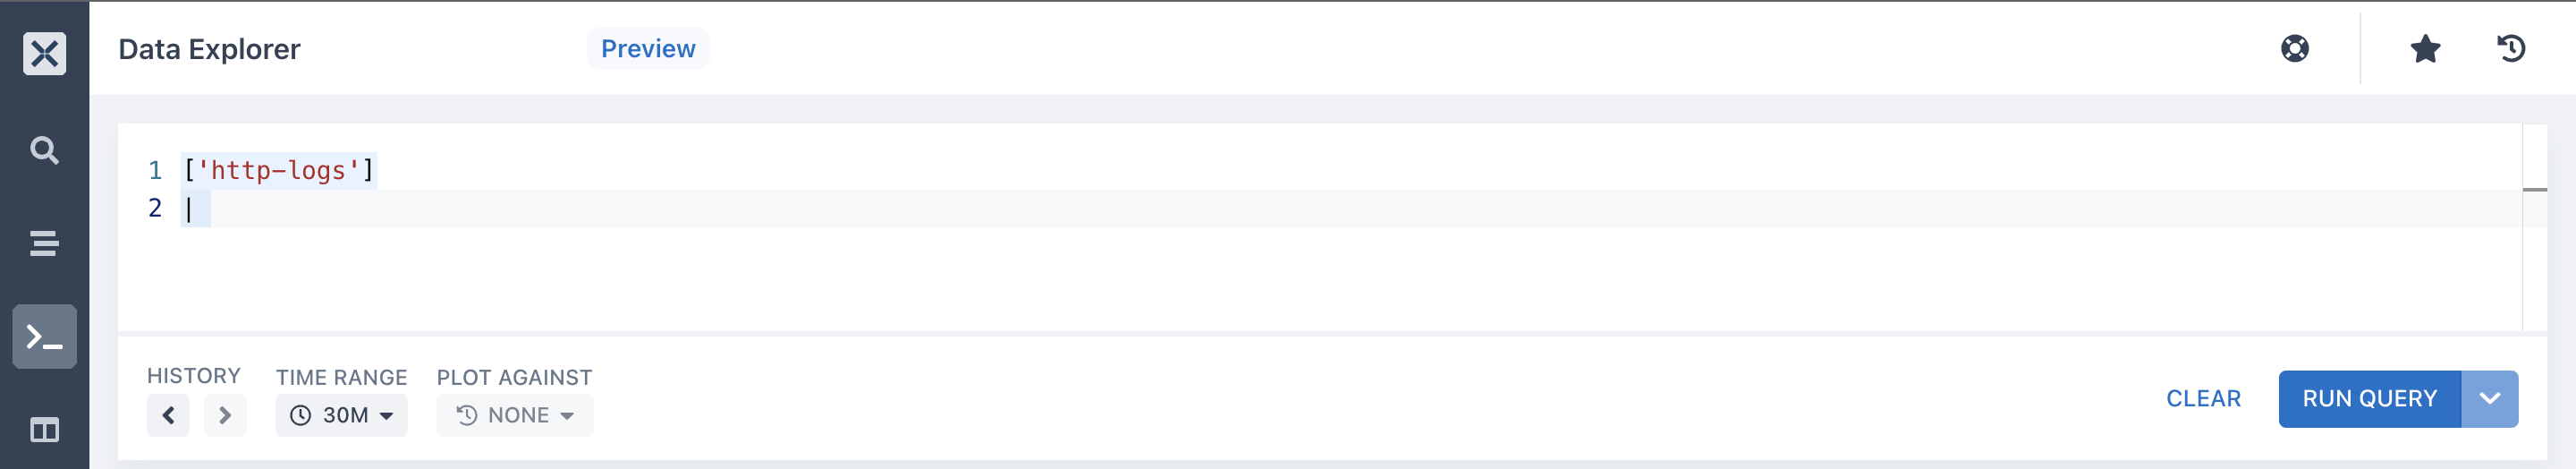
- Start by typing a dataset name, followed by your query.
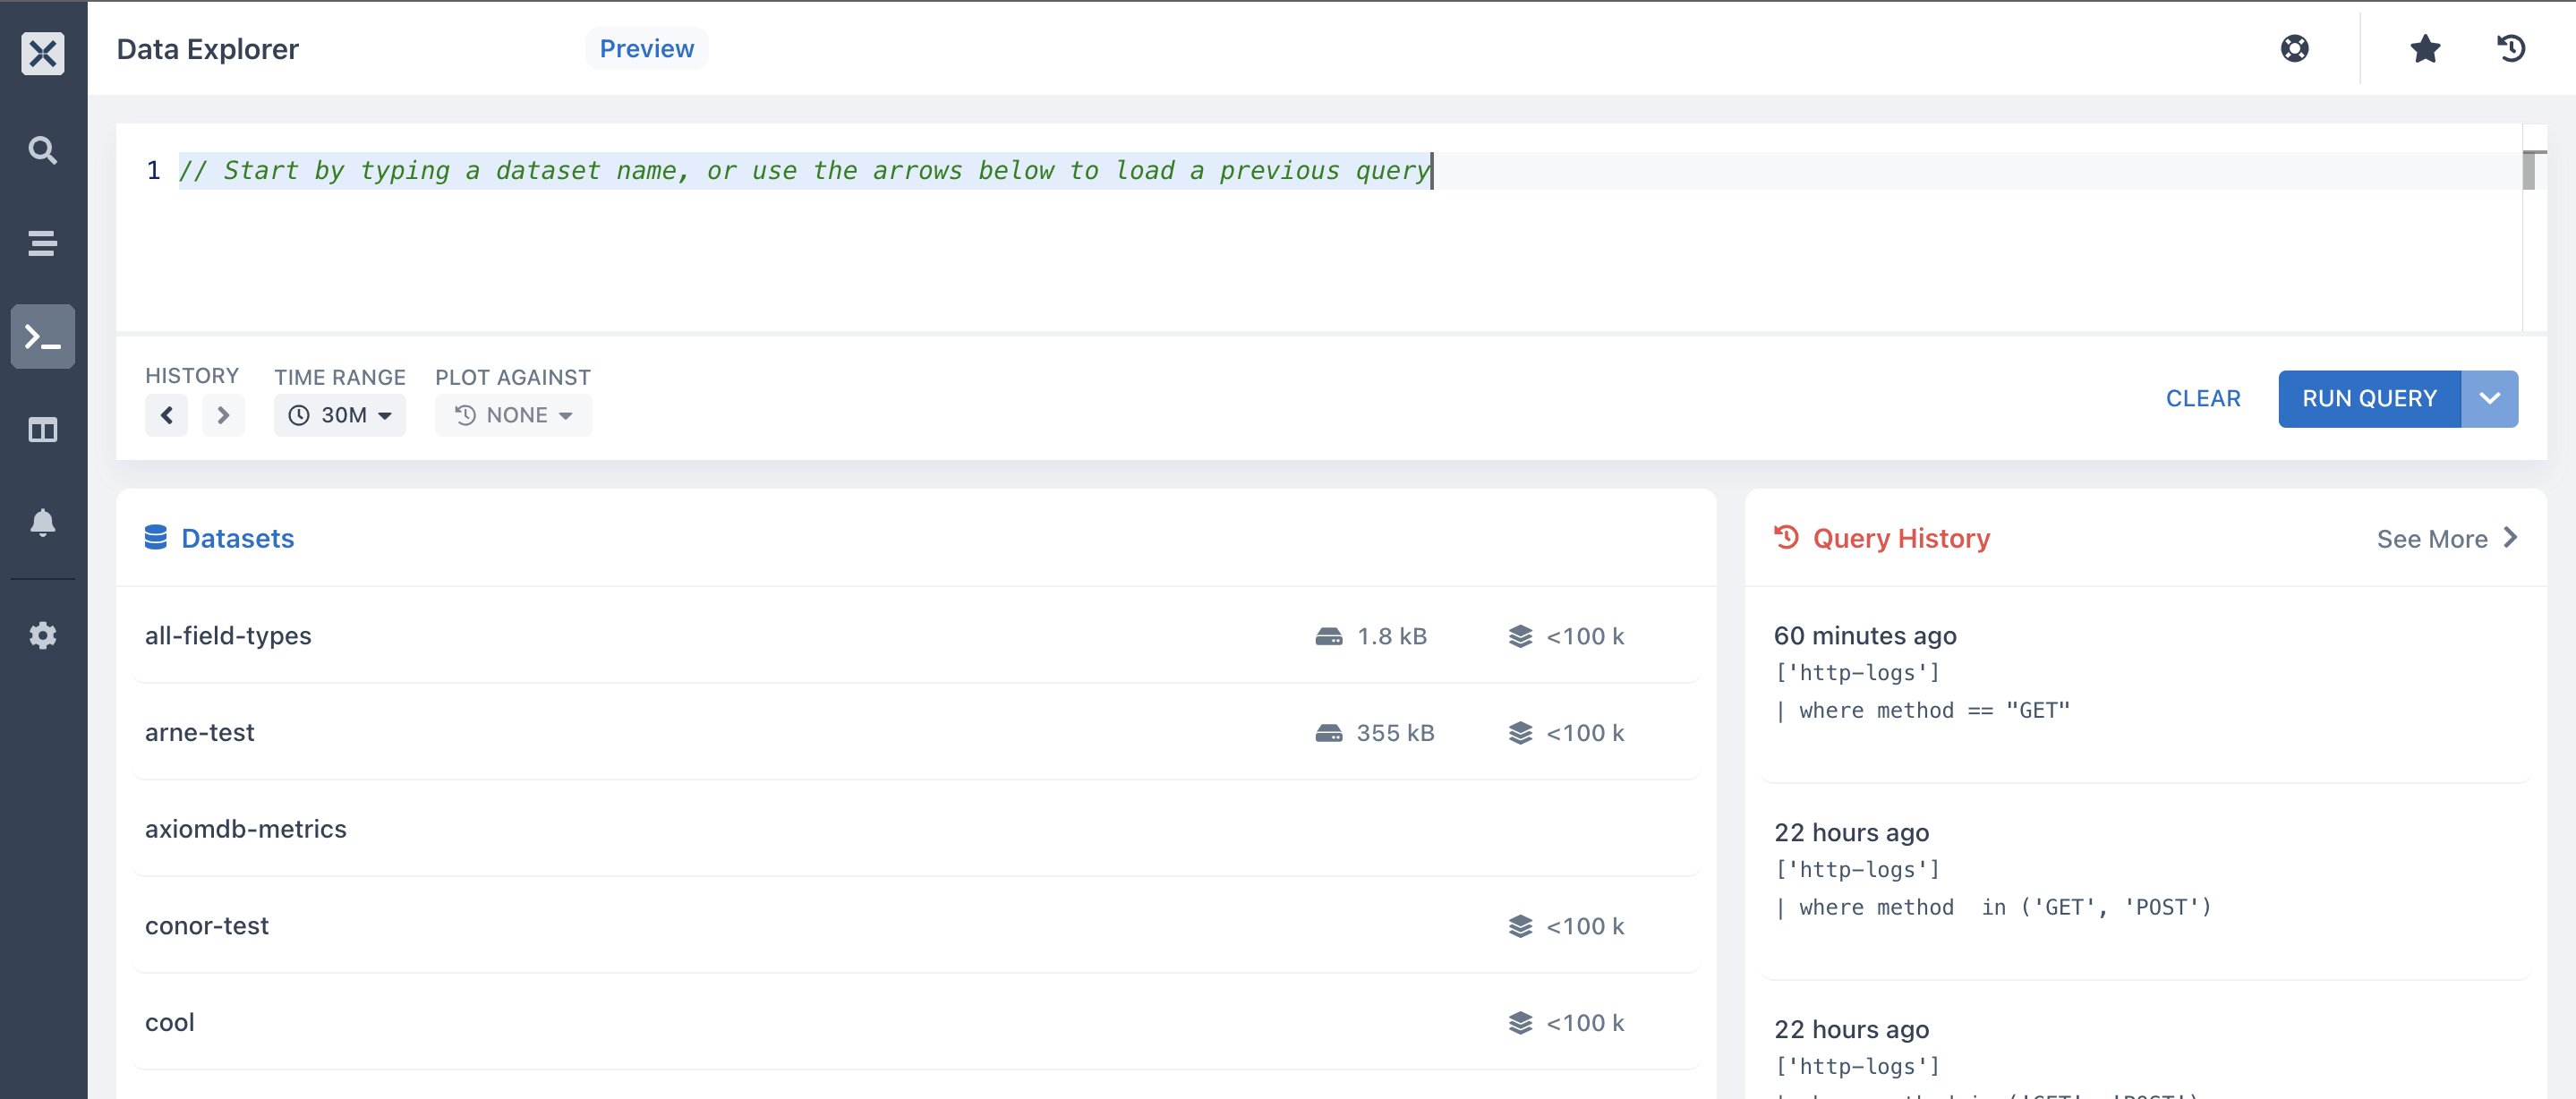
- Enter the dataset you created in step one it will autocomplete it for you. The dataset I created in step one was
http-logsso I will type that into the Data Explorer.
- Start typing and running your queries. You can run queries using our Tabular operators, Scalar functions, Scalar Operators, and Aggregation Functions.
-
A query consists of a sequence of query statements, with at least one statement being a tabular expression statement. The query’s tabular expression statements produce the result of the query.
-
The syntax of the tabular expression tabular flow from one query operator to another, starting with your datasets name and then flow through a set of data operators and functions that are bound together through the use of the pipe
|delimiter -
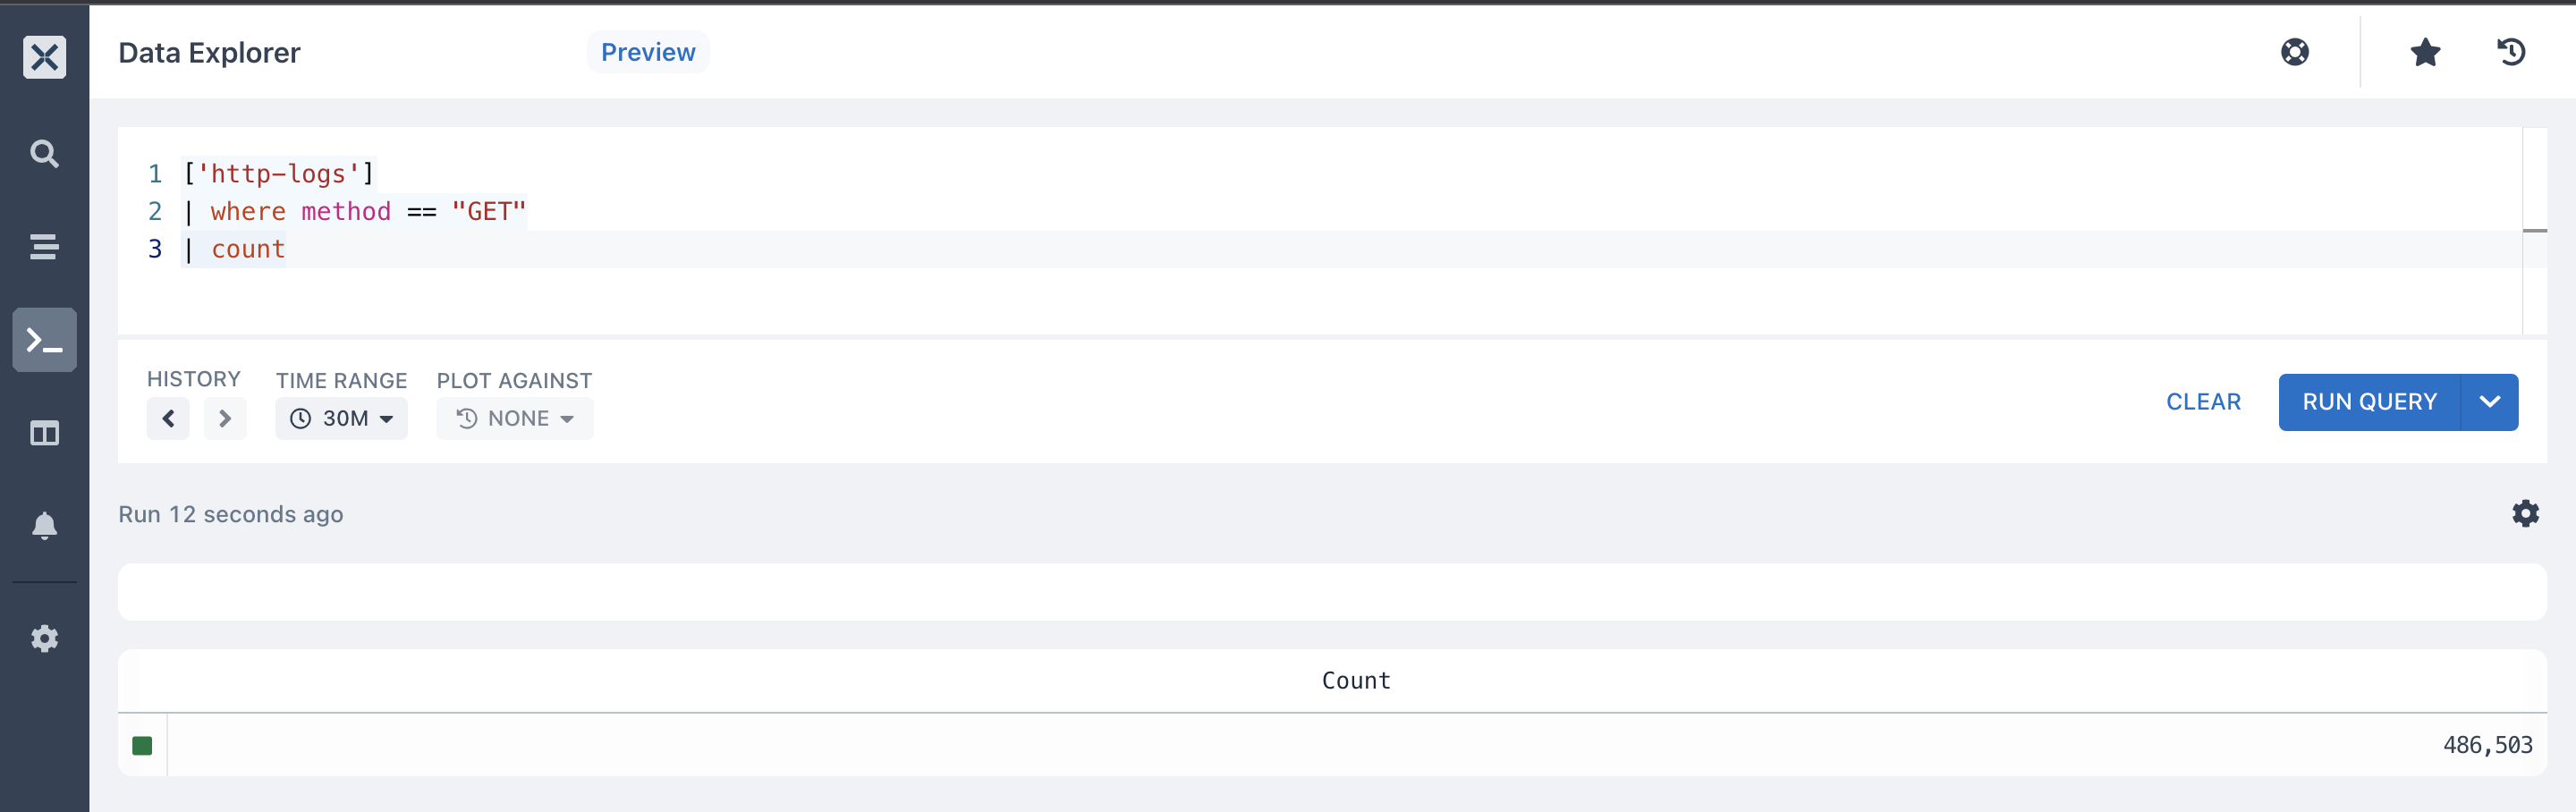
For example, the following query has a single statement, which is a tabular expression statement. The statement starts with a reference to your datasets called
http-logs. The data (rows) for the dataset are then filtered by the value ofmethodfield. The query then returns the count of rows.
-
On your dataset, you can start running queries using our operators and functions. With these queries, you can monitor, explore and analyse your data across all events in your dataset and visualize the output and also gain direct insights into your database and backend to know how they are performing and behaving.
-
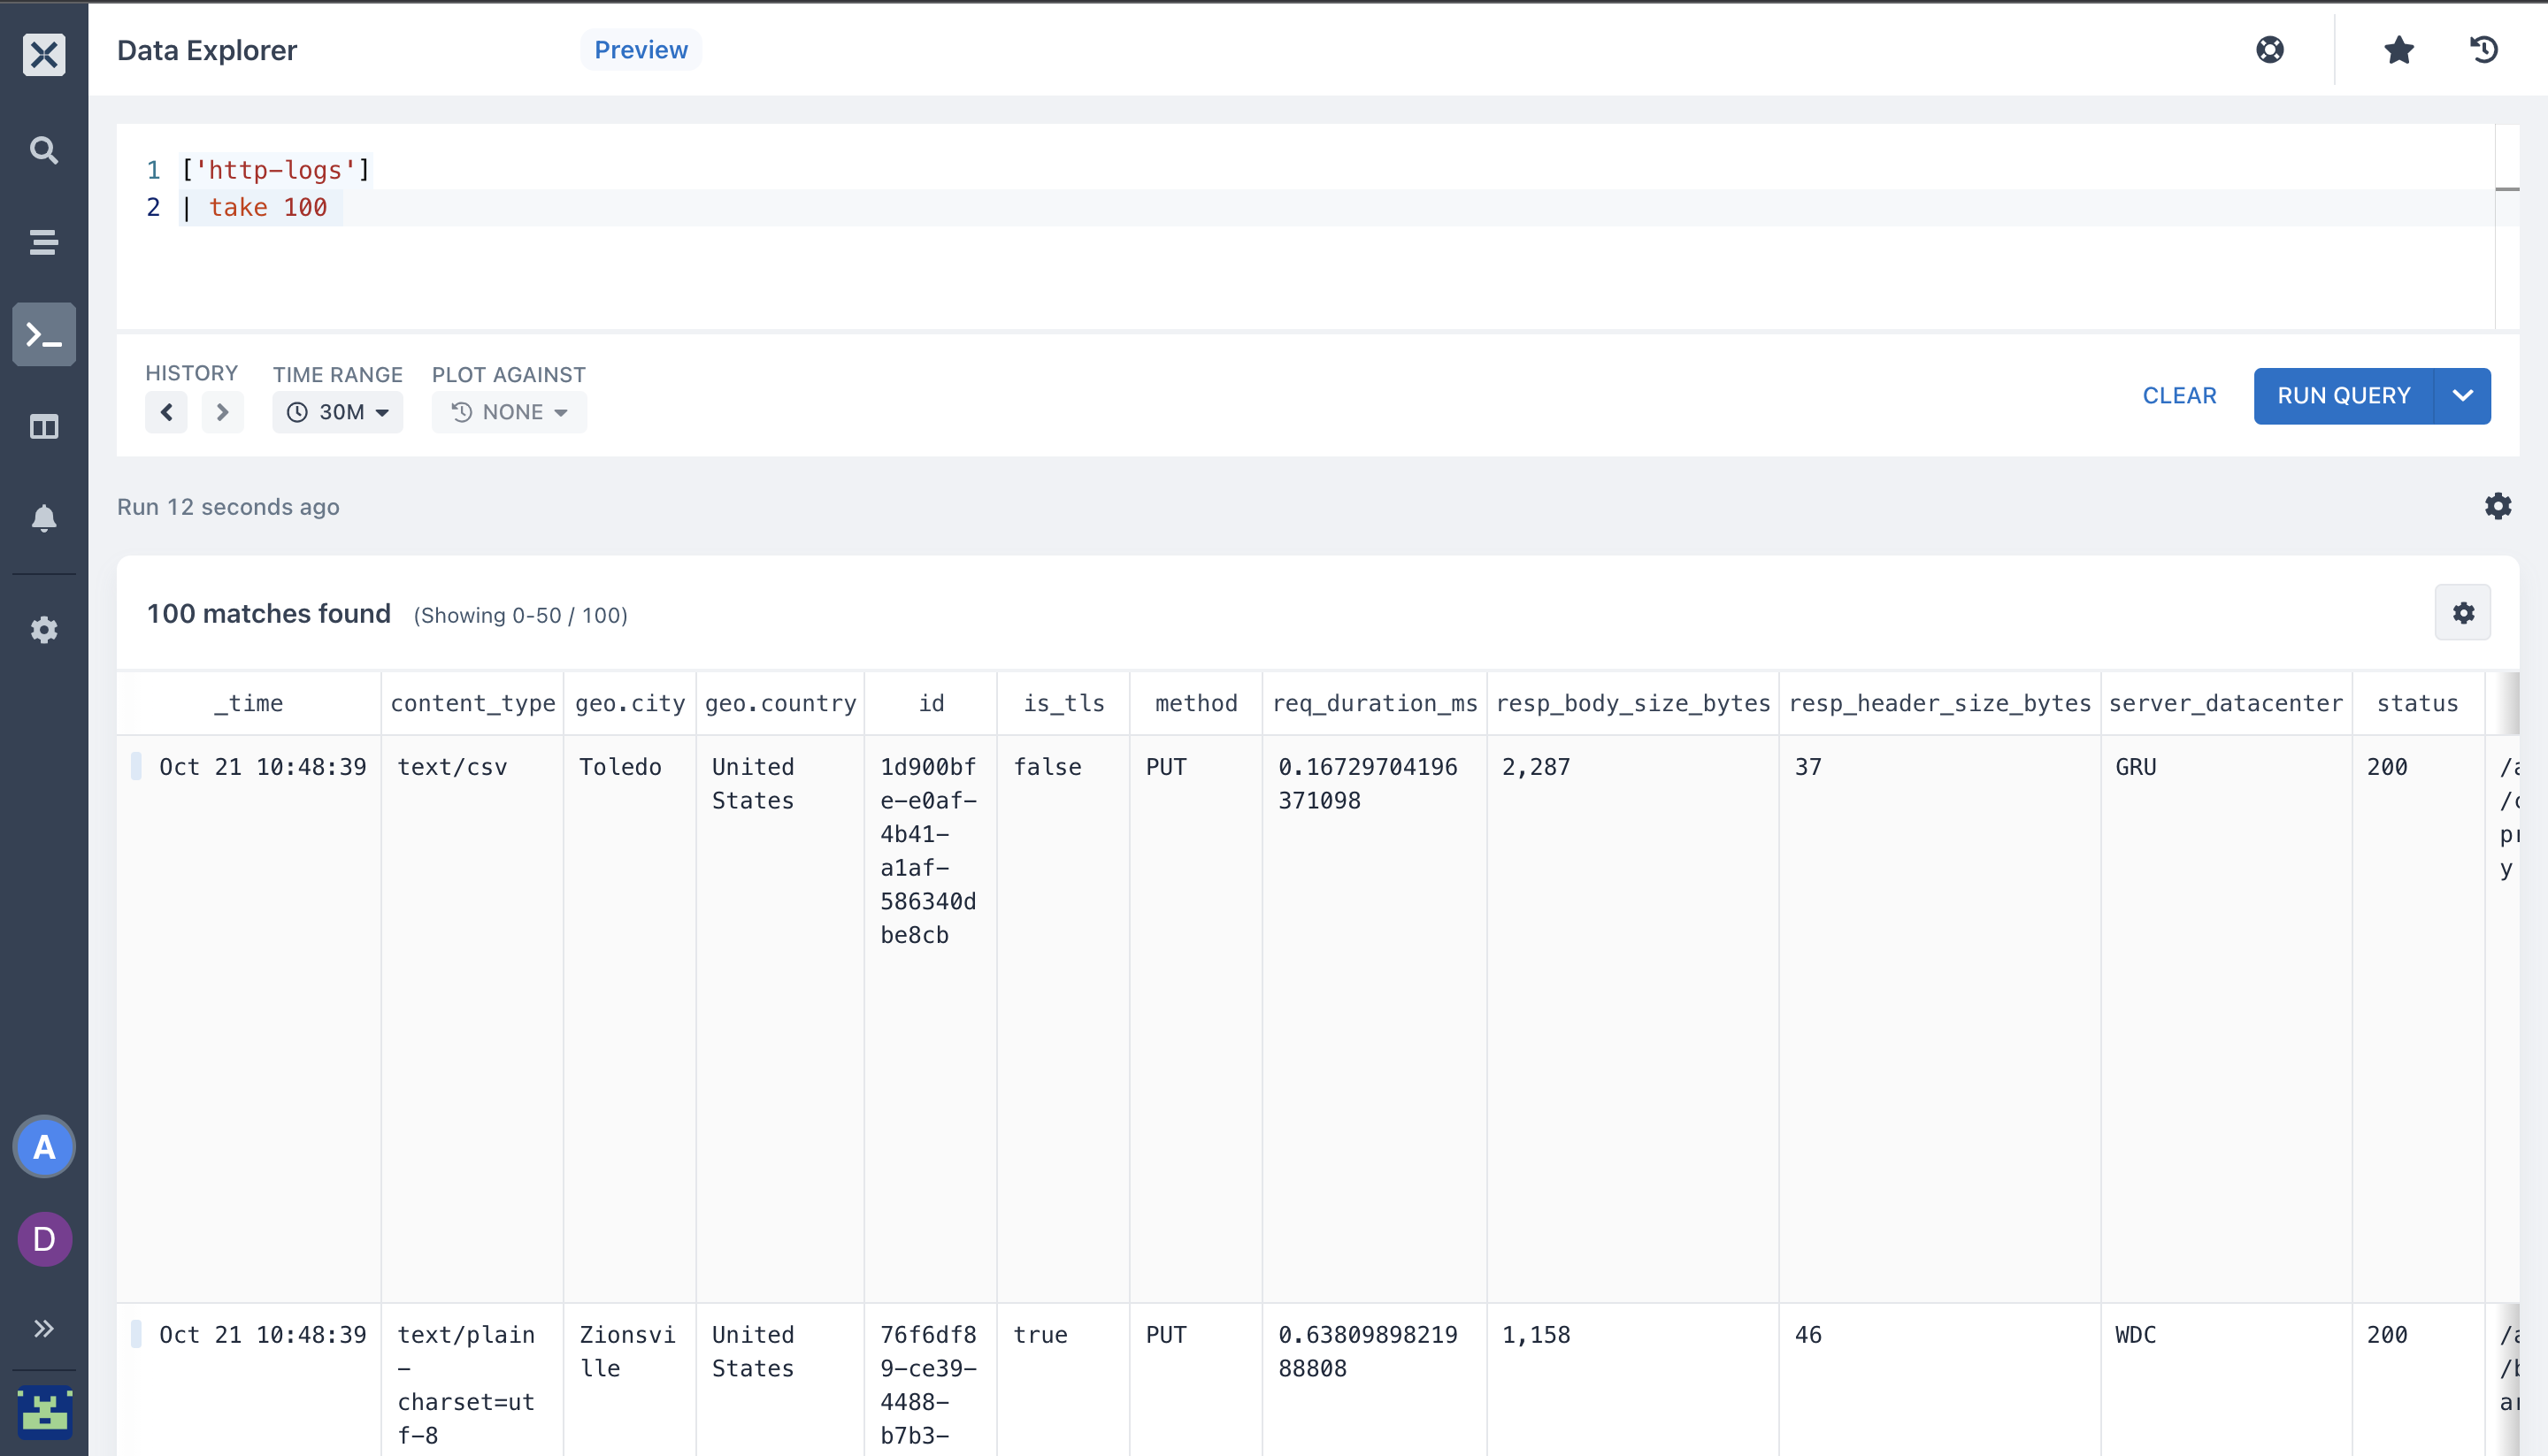
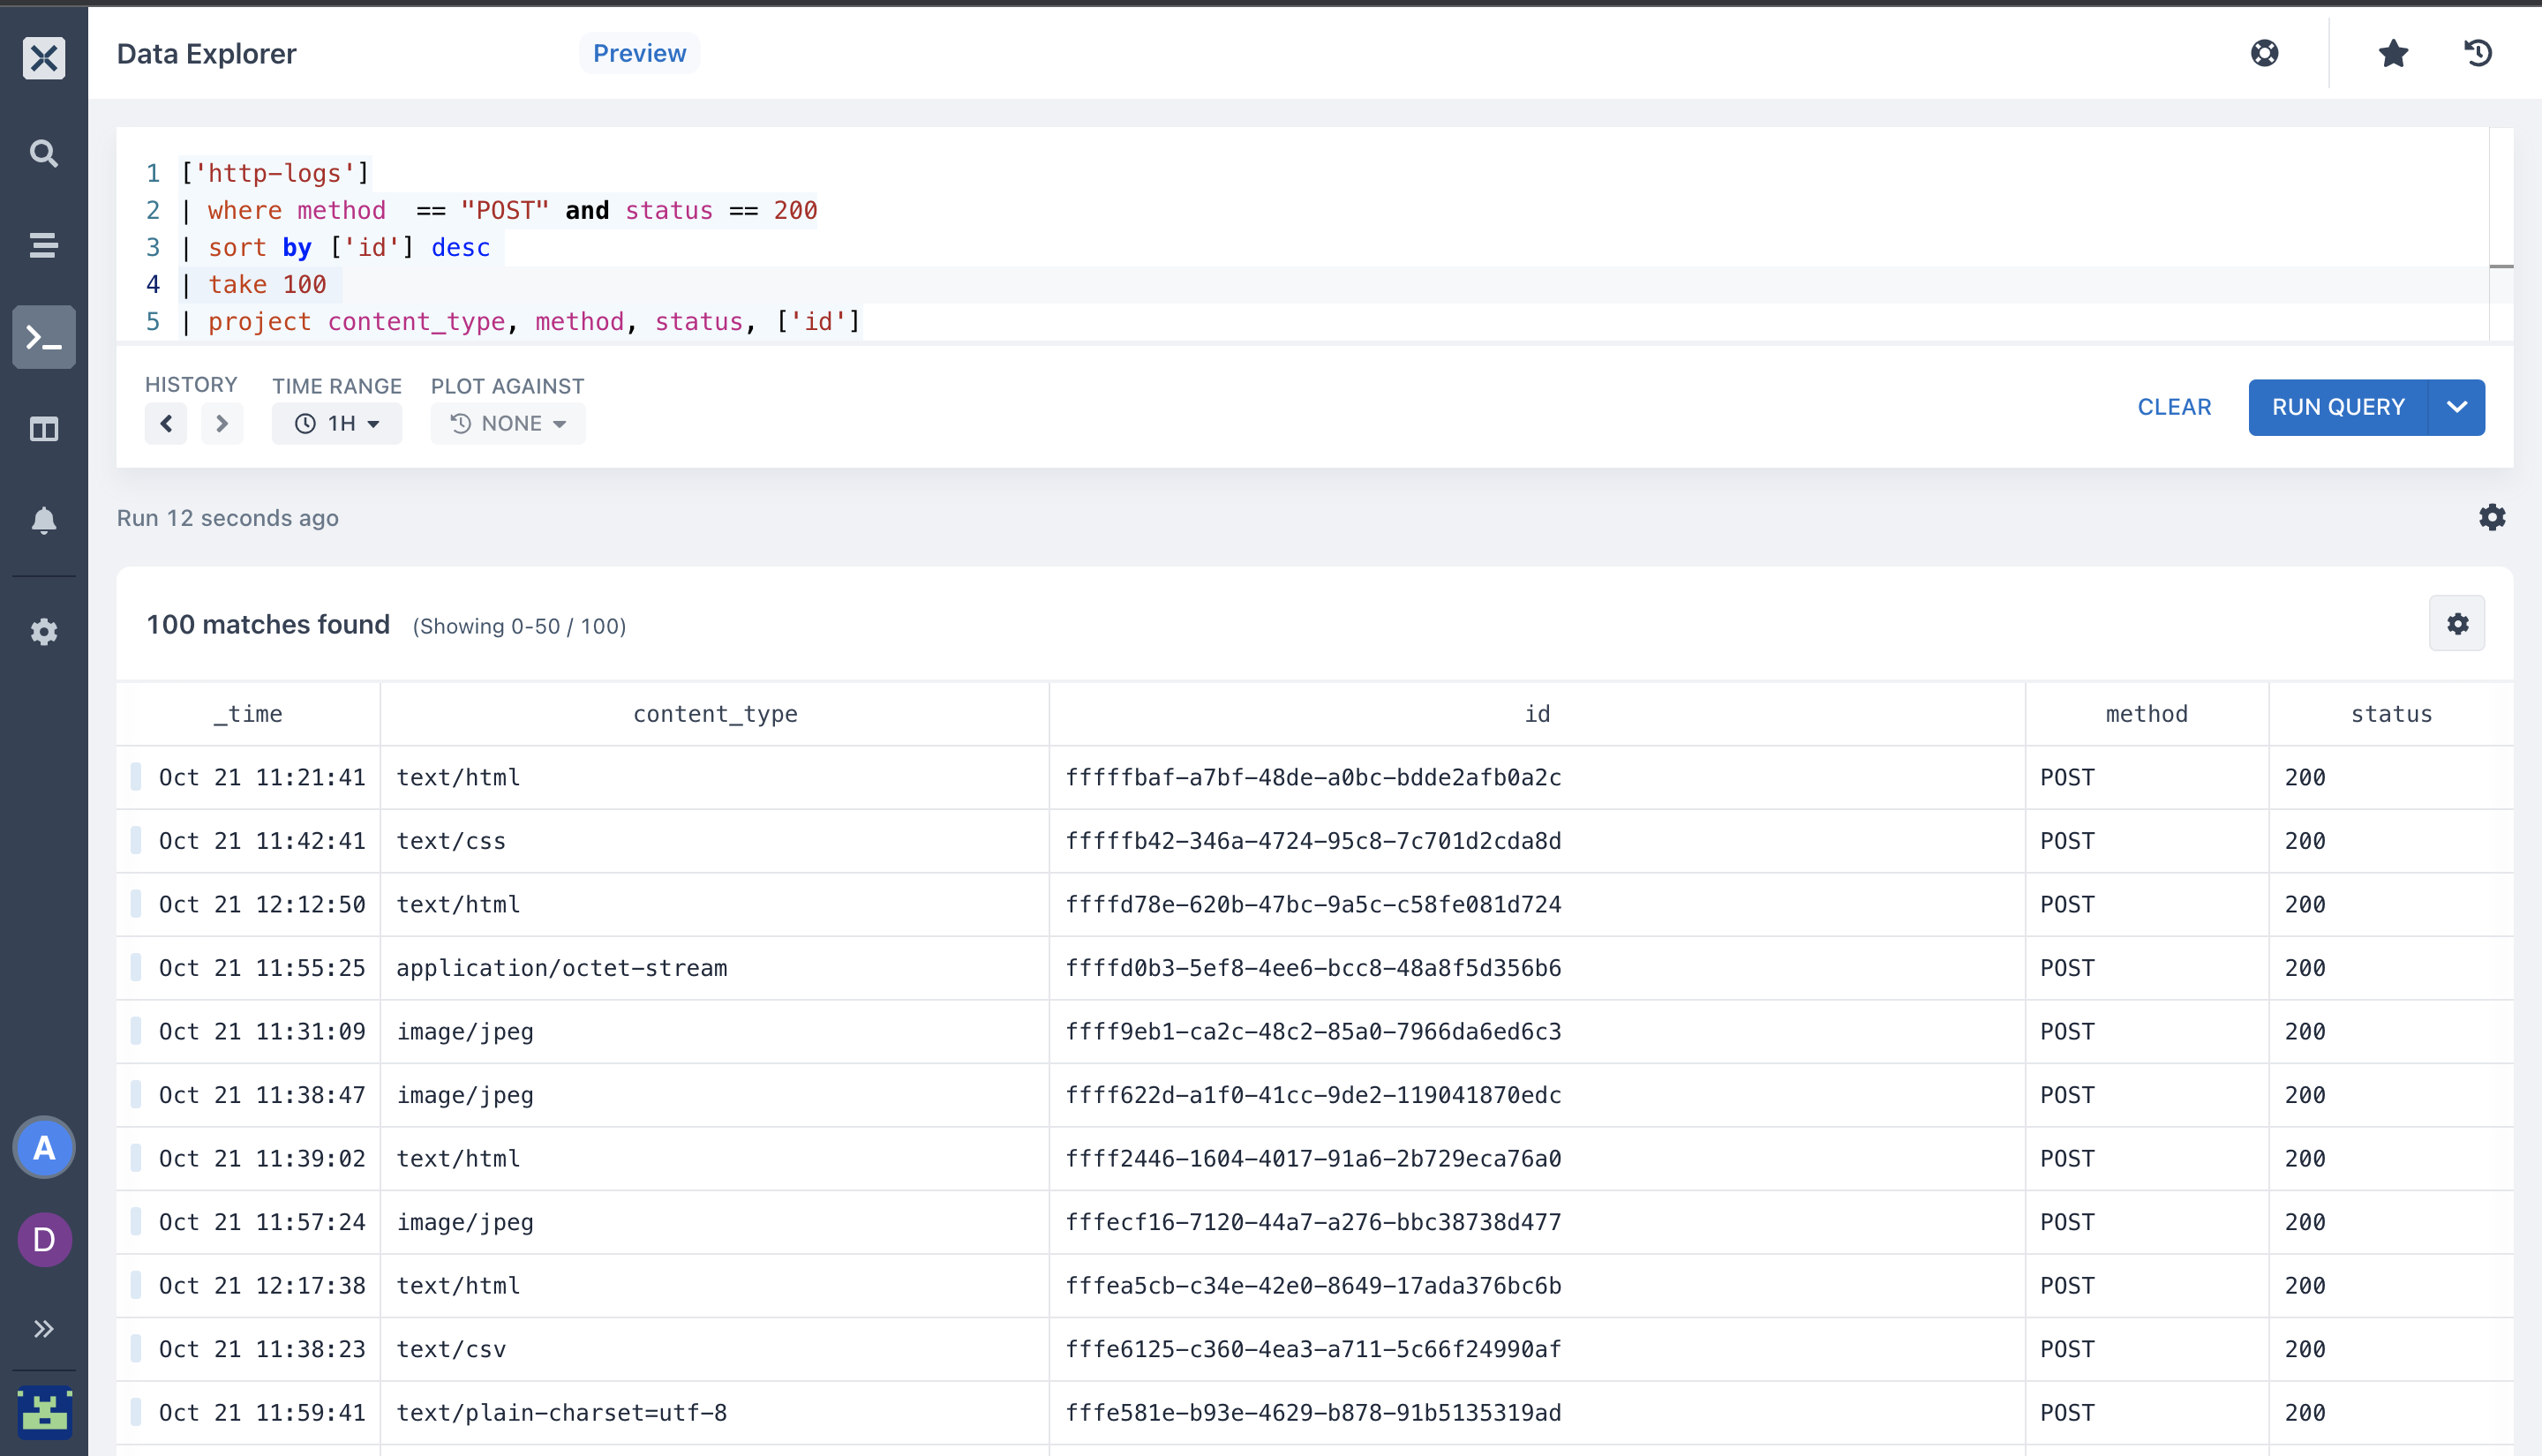
Take Operator: The
takeoperator returns up to the specified number of rows of data. The following query returns 100 rows from thehttp-logstable.
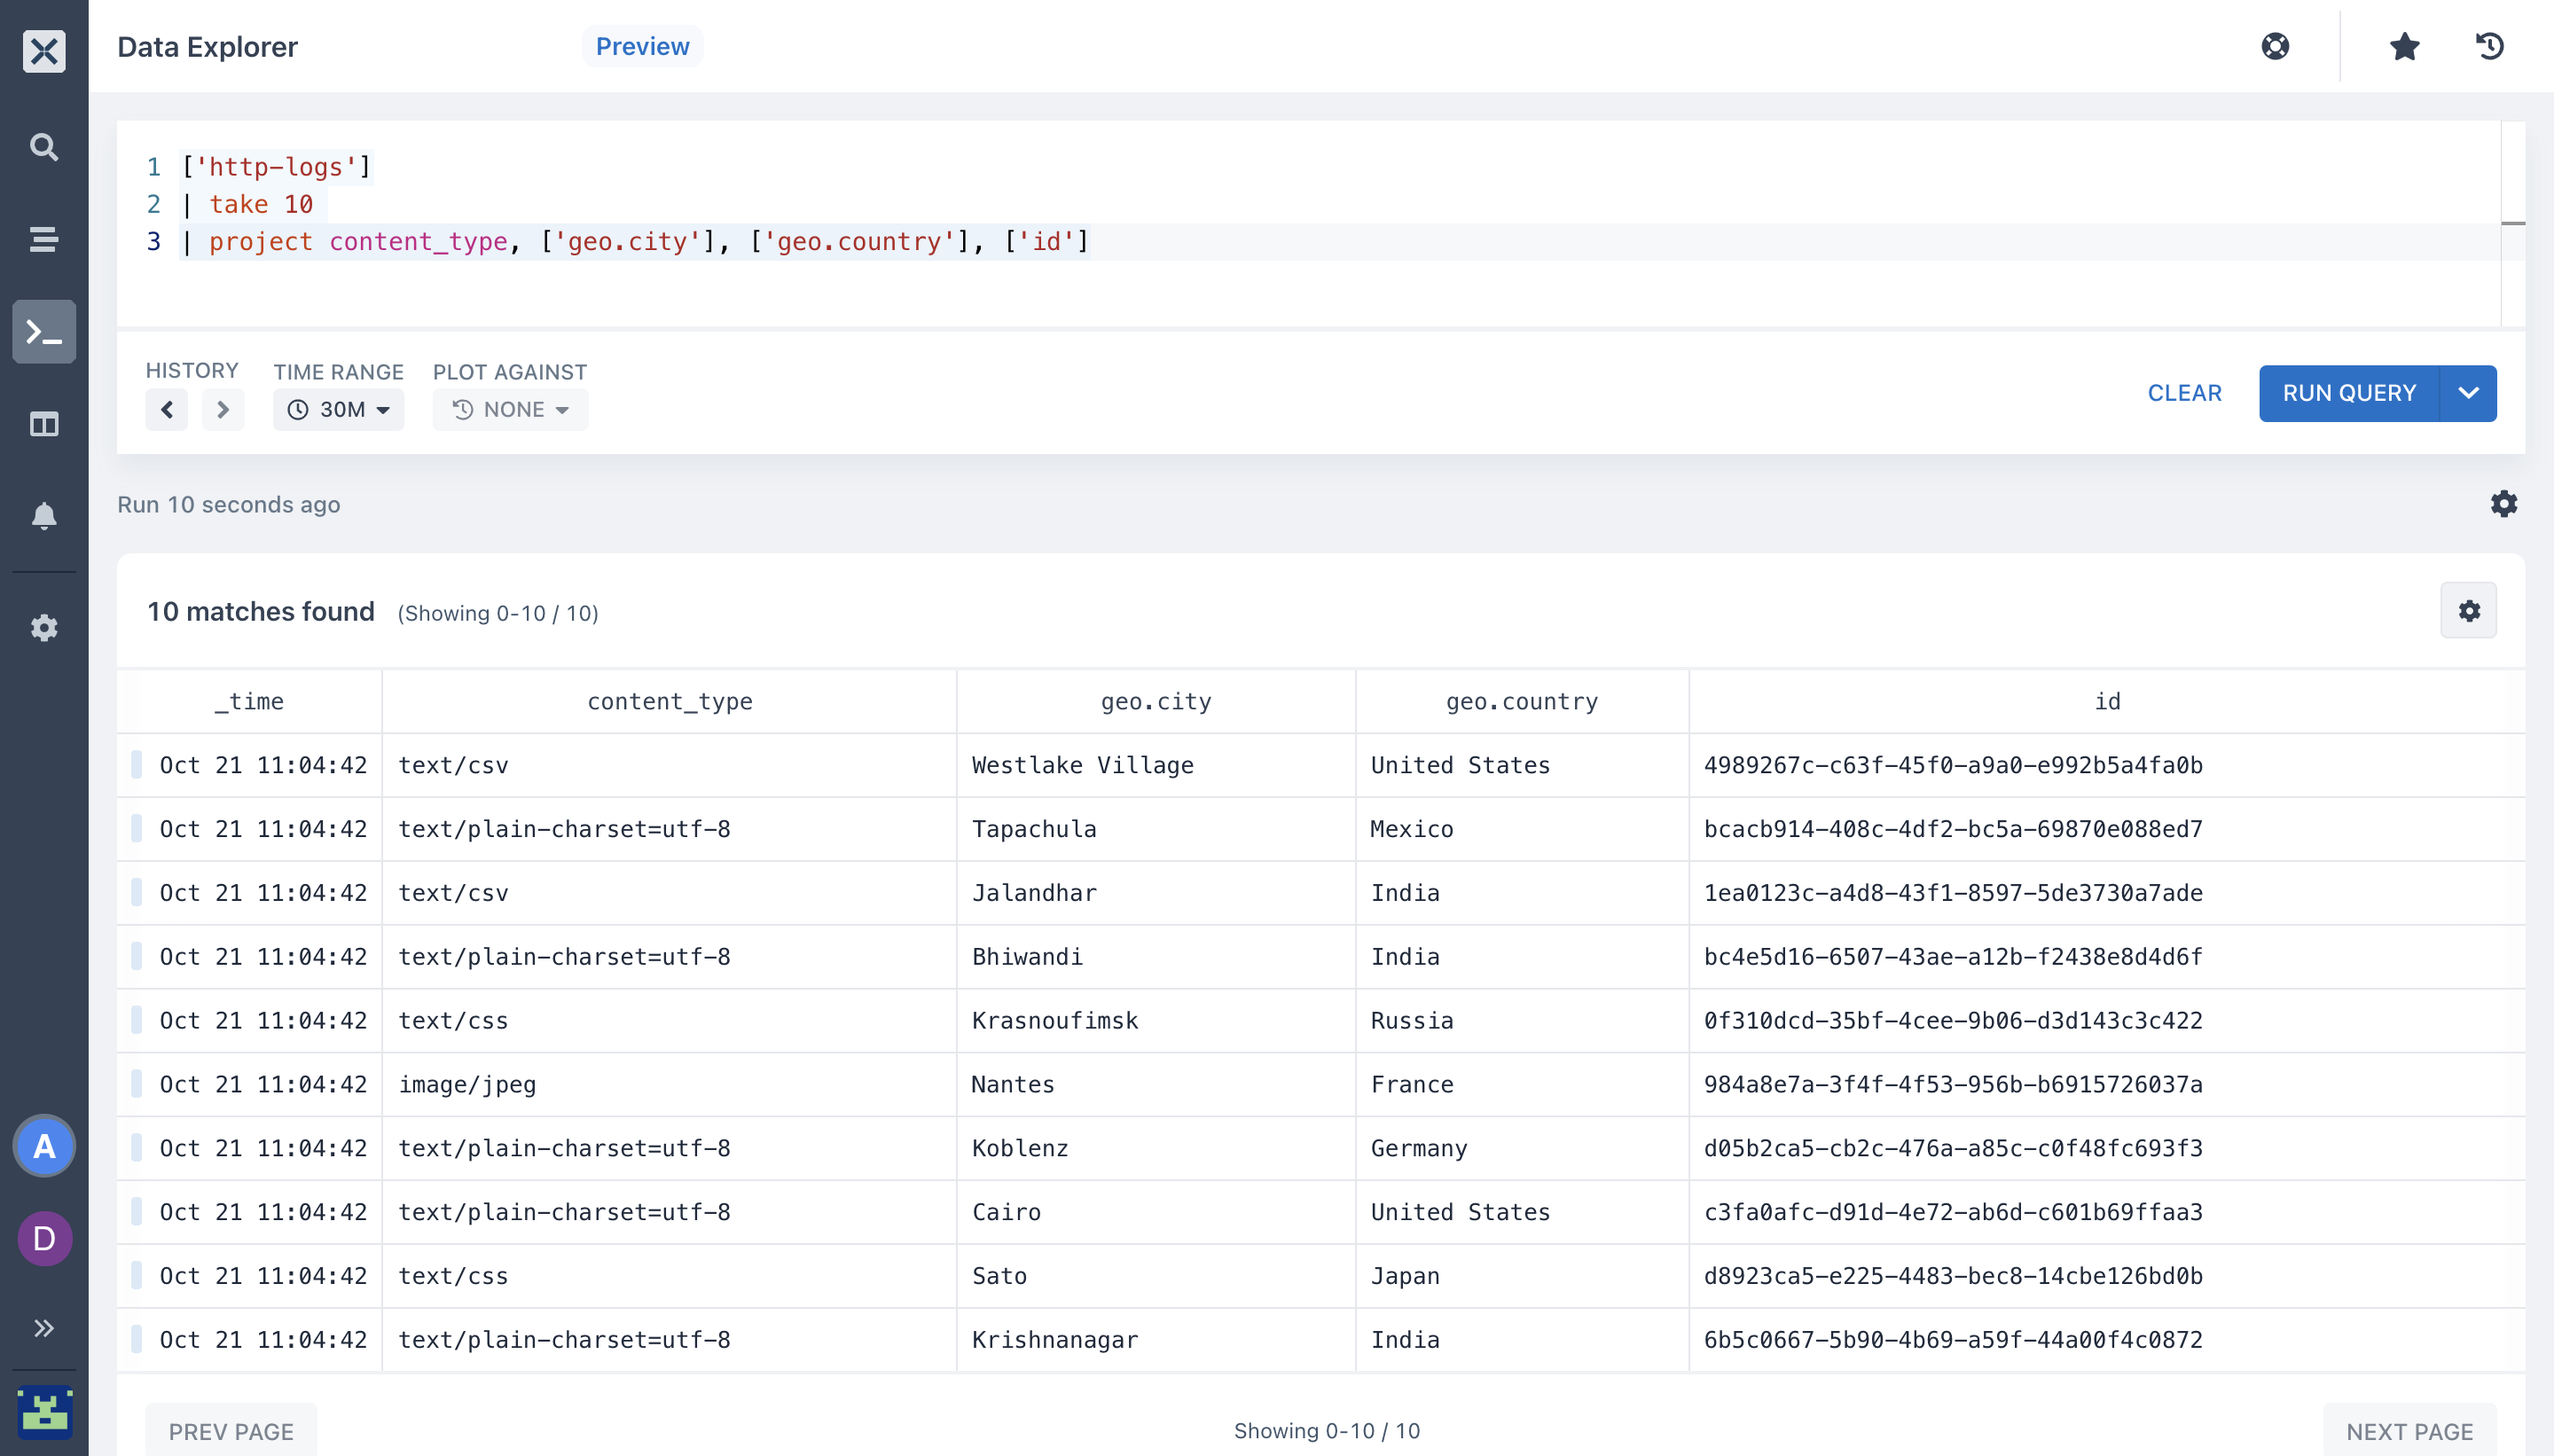
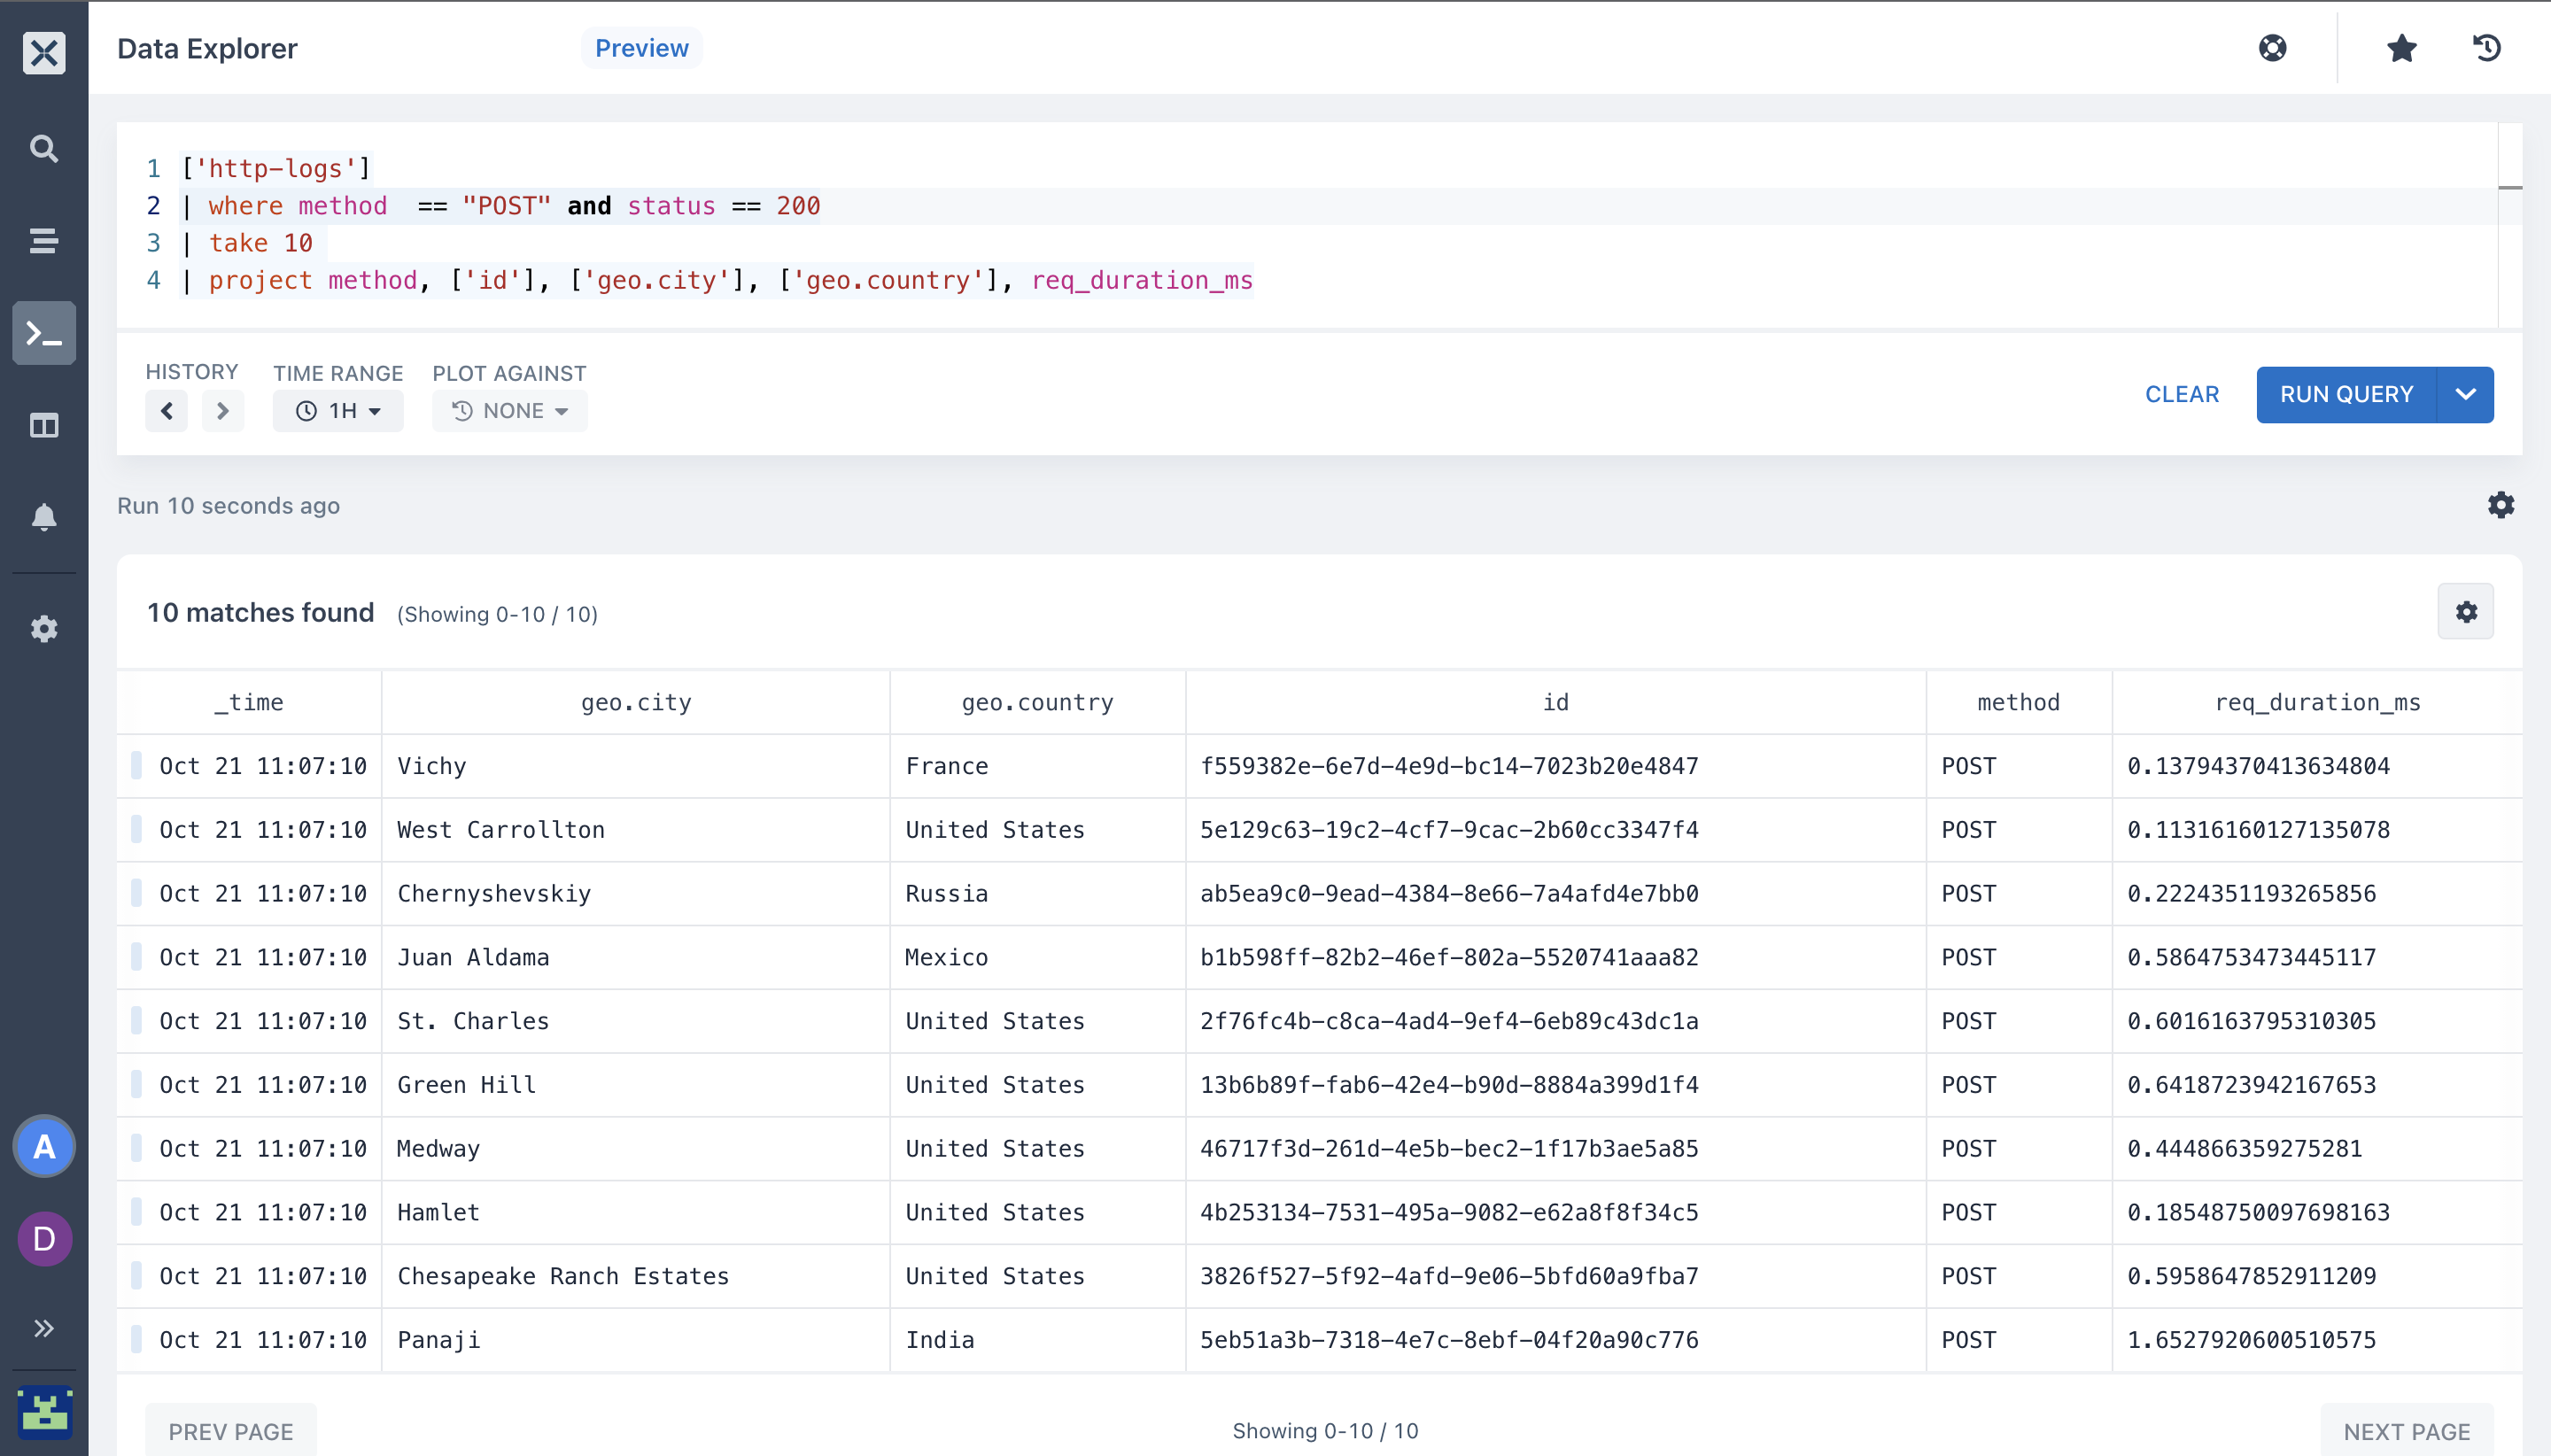
- Project Operator: Use the
projectoperator to select fields to insert and embed new columns. The following query returns a specific set of fields as columns.
- Where: Filters a dataset to the subset of rows that satisfy a predicate.
The following filters the data by method and status
- sort: Sort the rows of the input dataset into order by one or more columns.
The following query sorts the data in descending order by ['id']
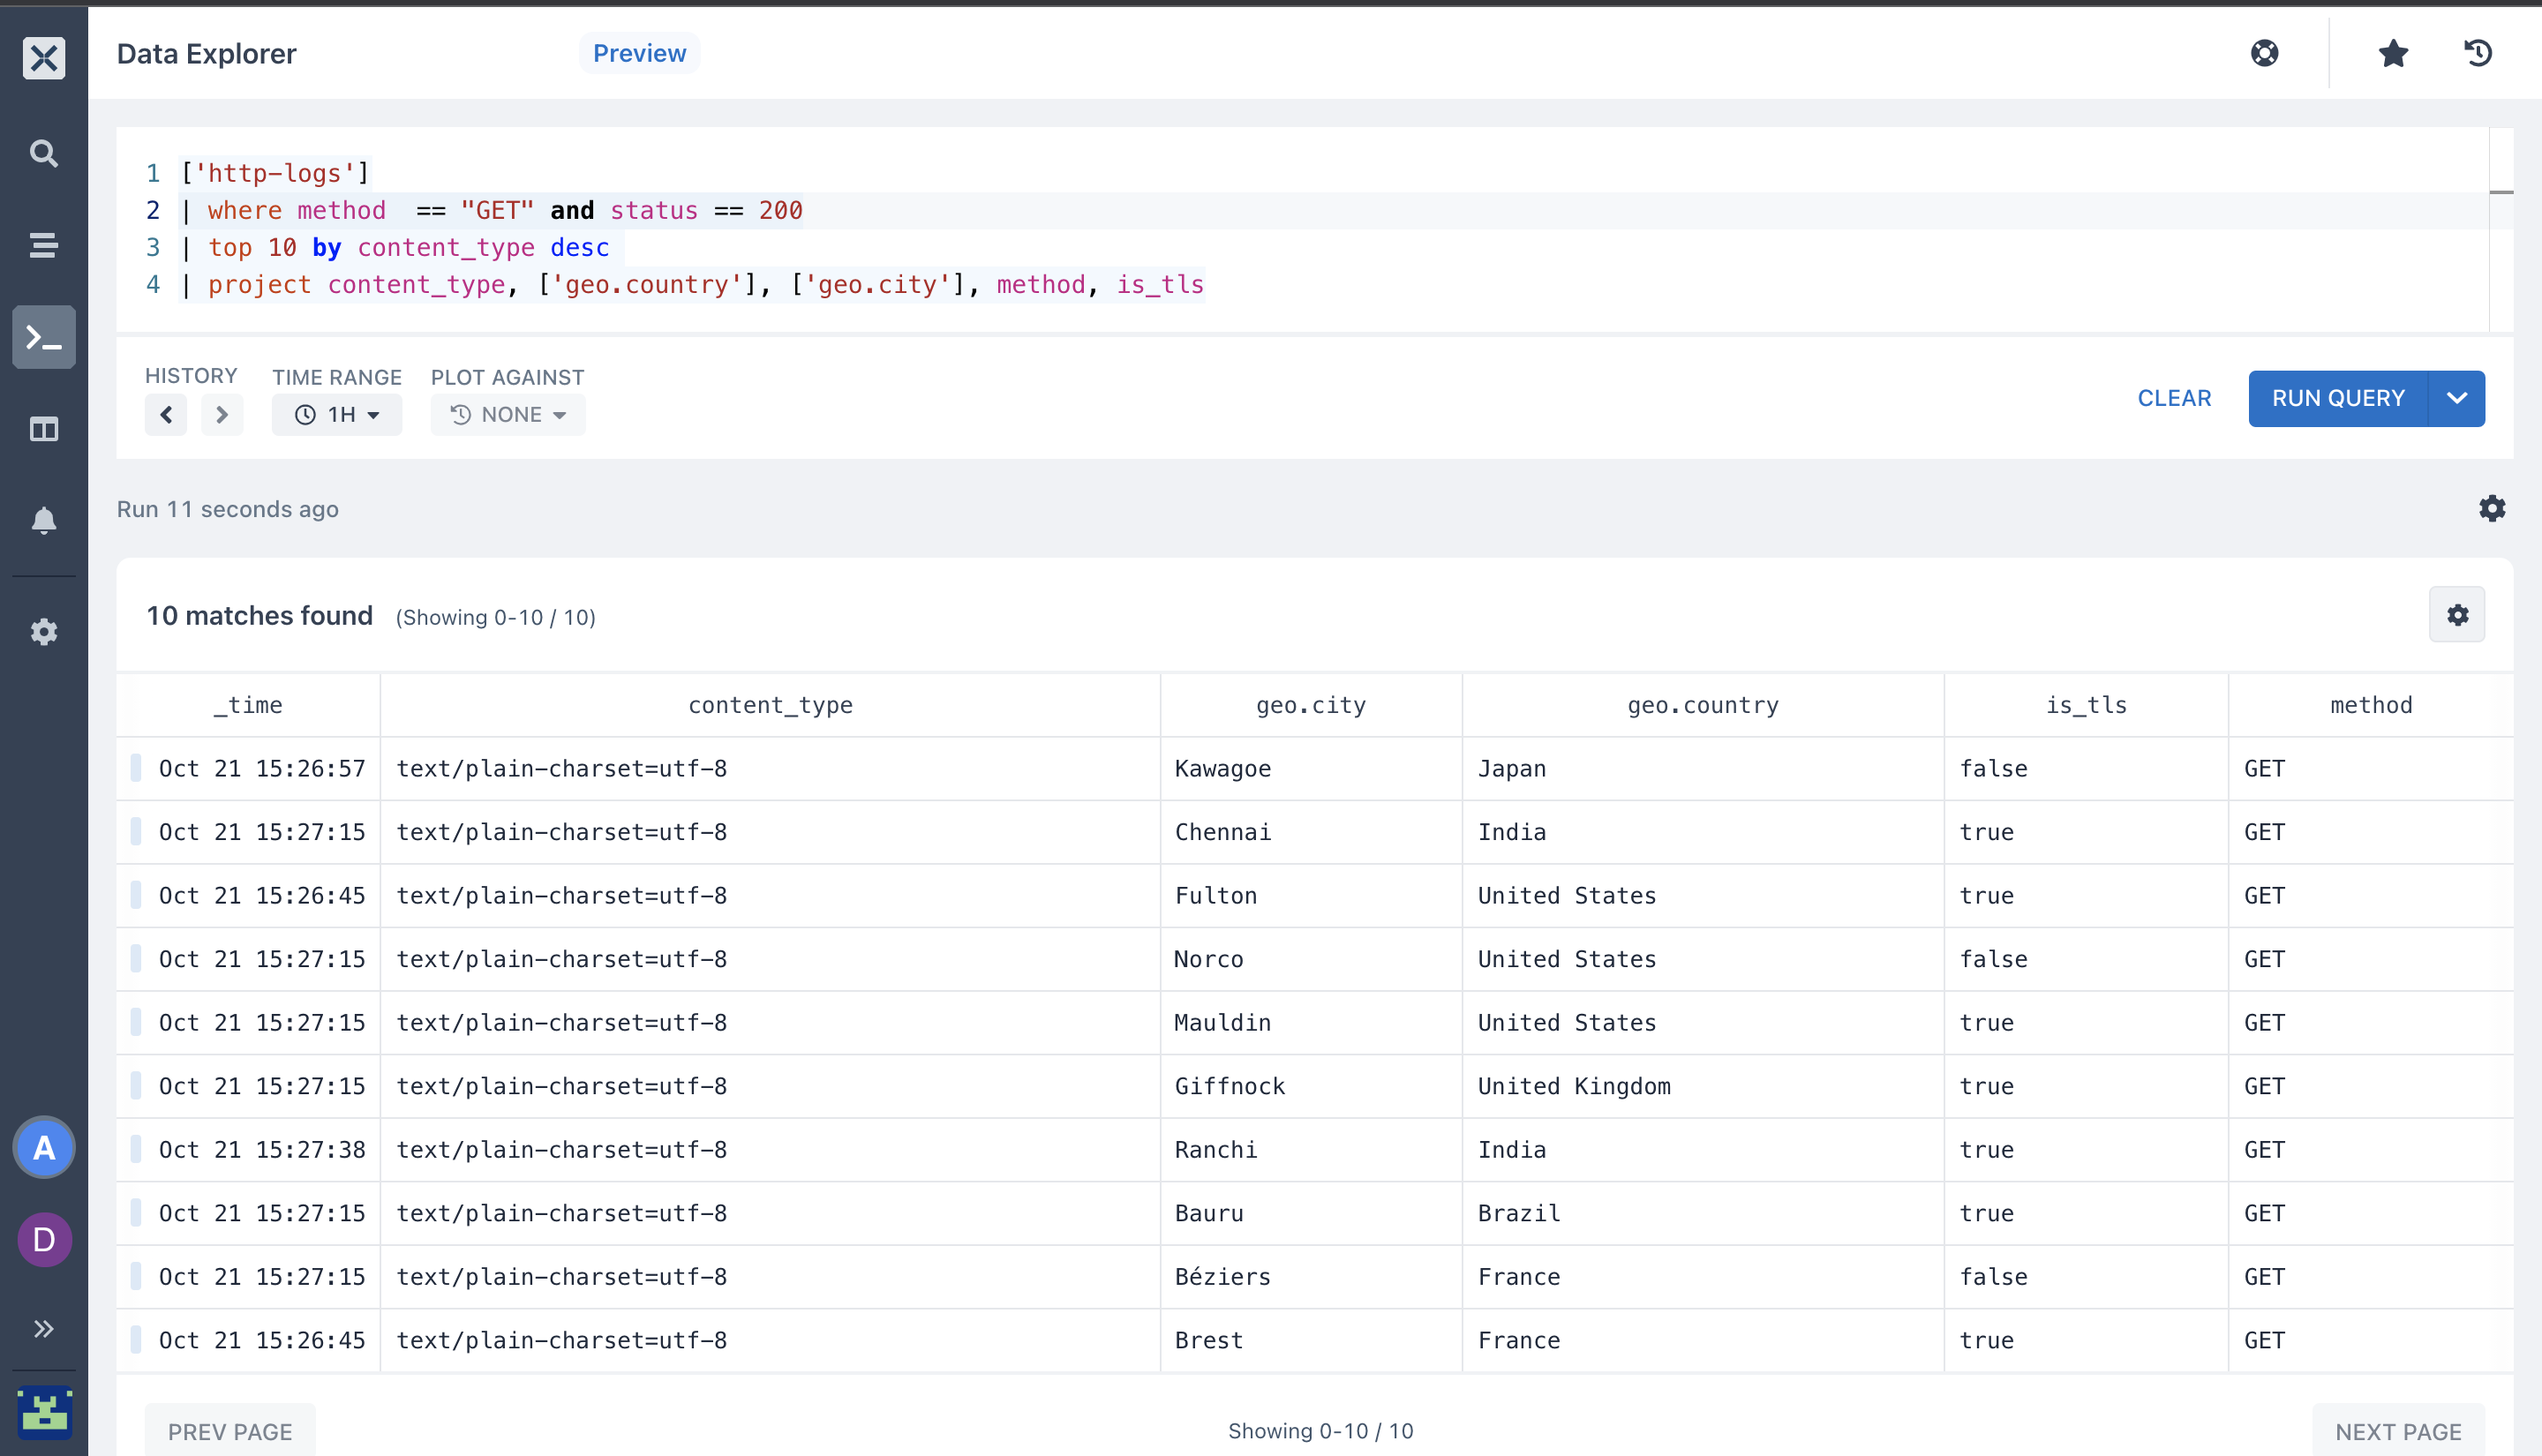
- top: Returns the first N Records sorted by the specified columns.
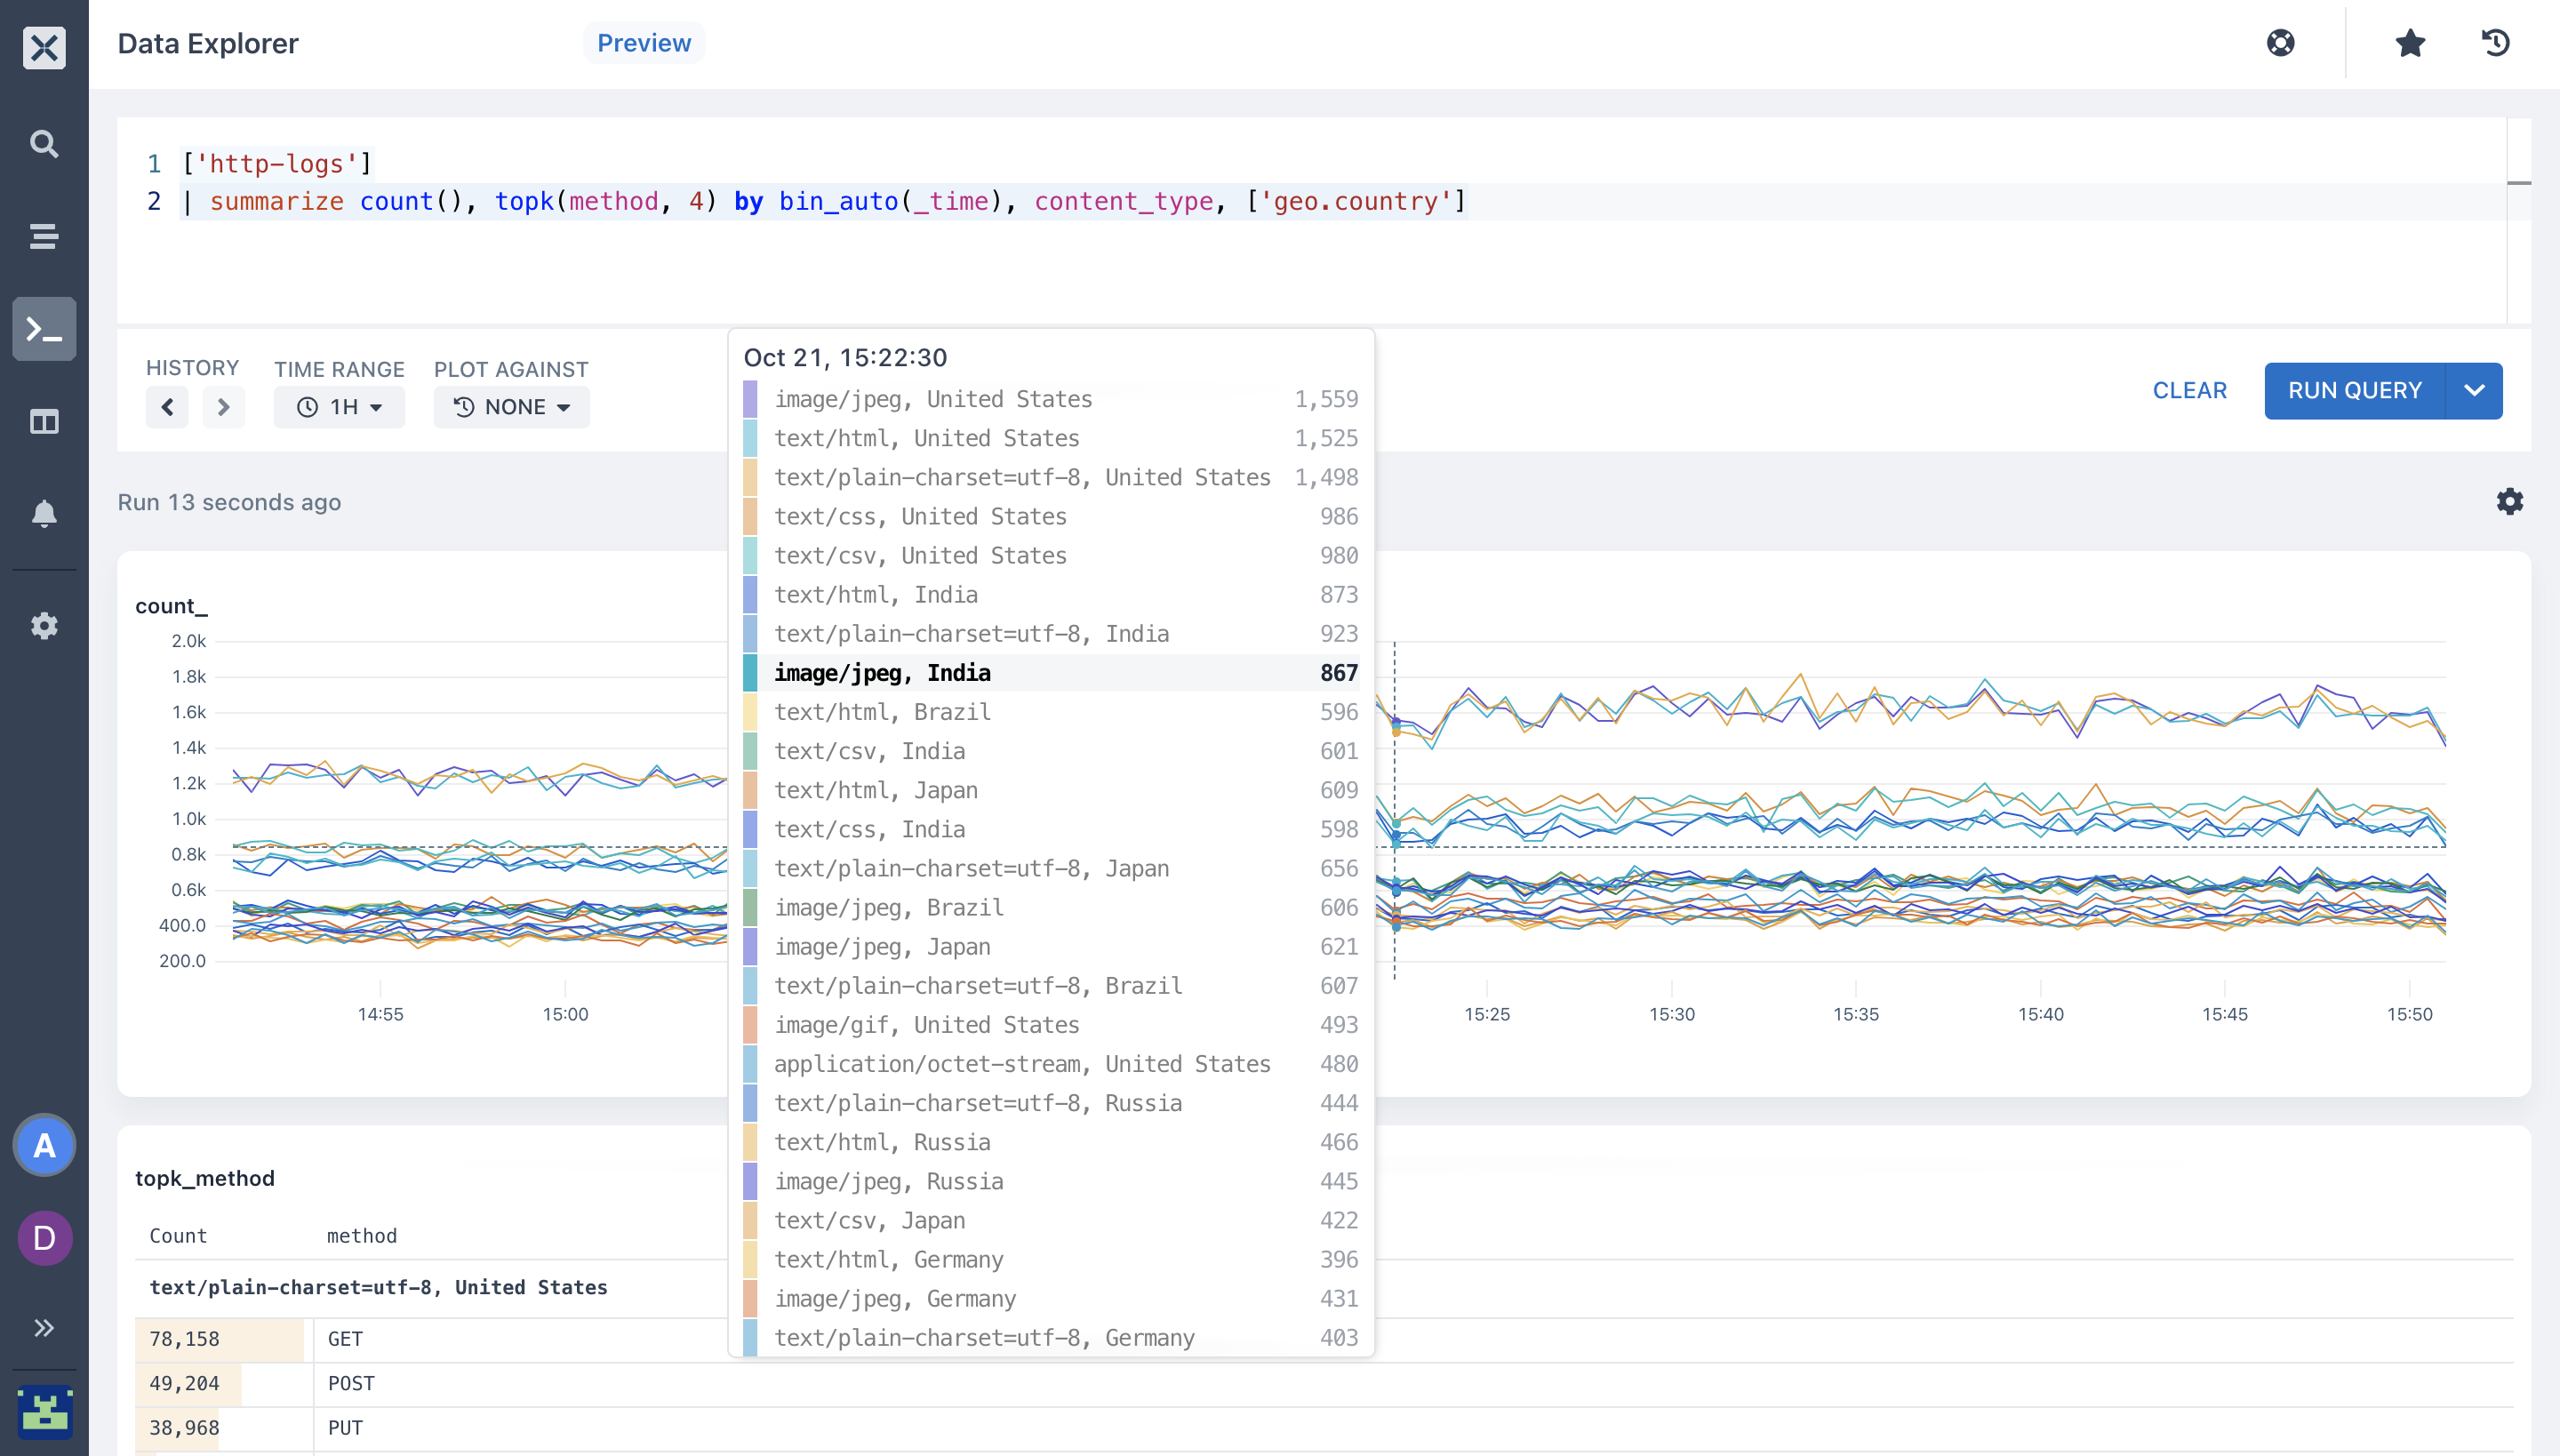
- summarize operator: Produces a table that aggregates the content of the dataset.
The summarize operator groups together rows that have the same values in the by clause. In the query below, the aggregation functions (count and topk) combine each group into four (4) rows. In this case there is a row for content_type and [geo.country](http://geo.country) and a column for each aggregation in the operator.
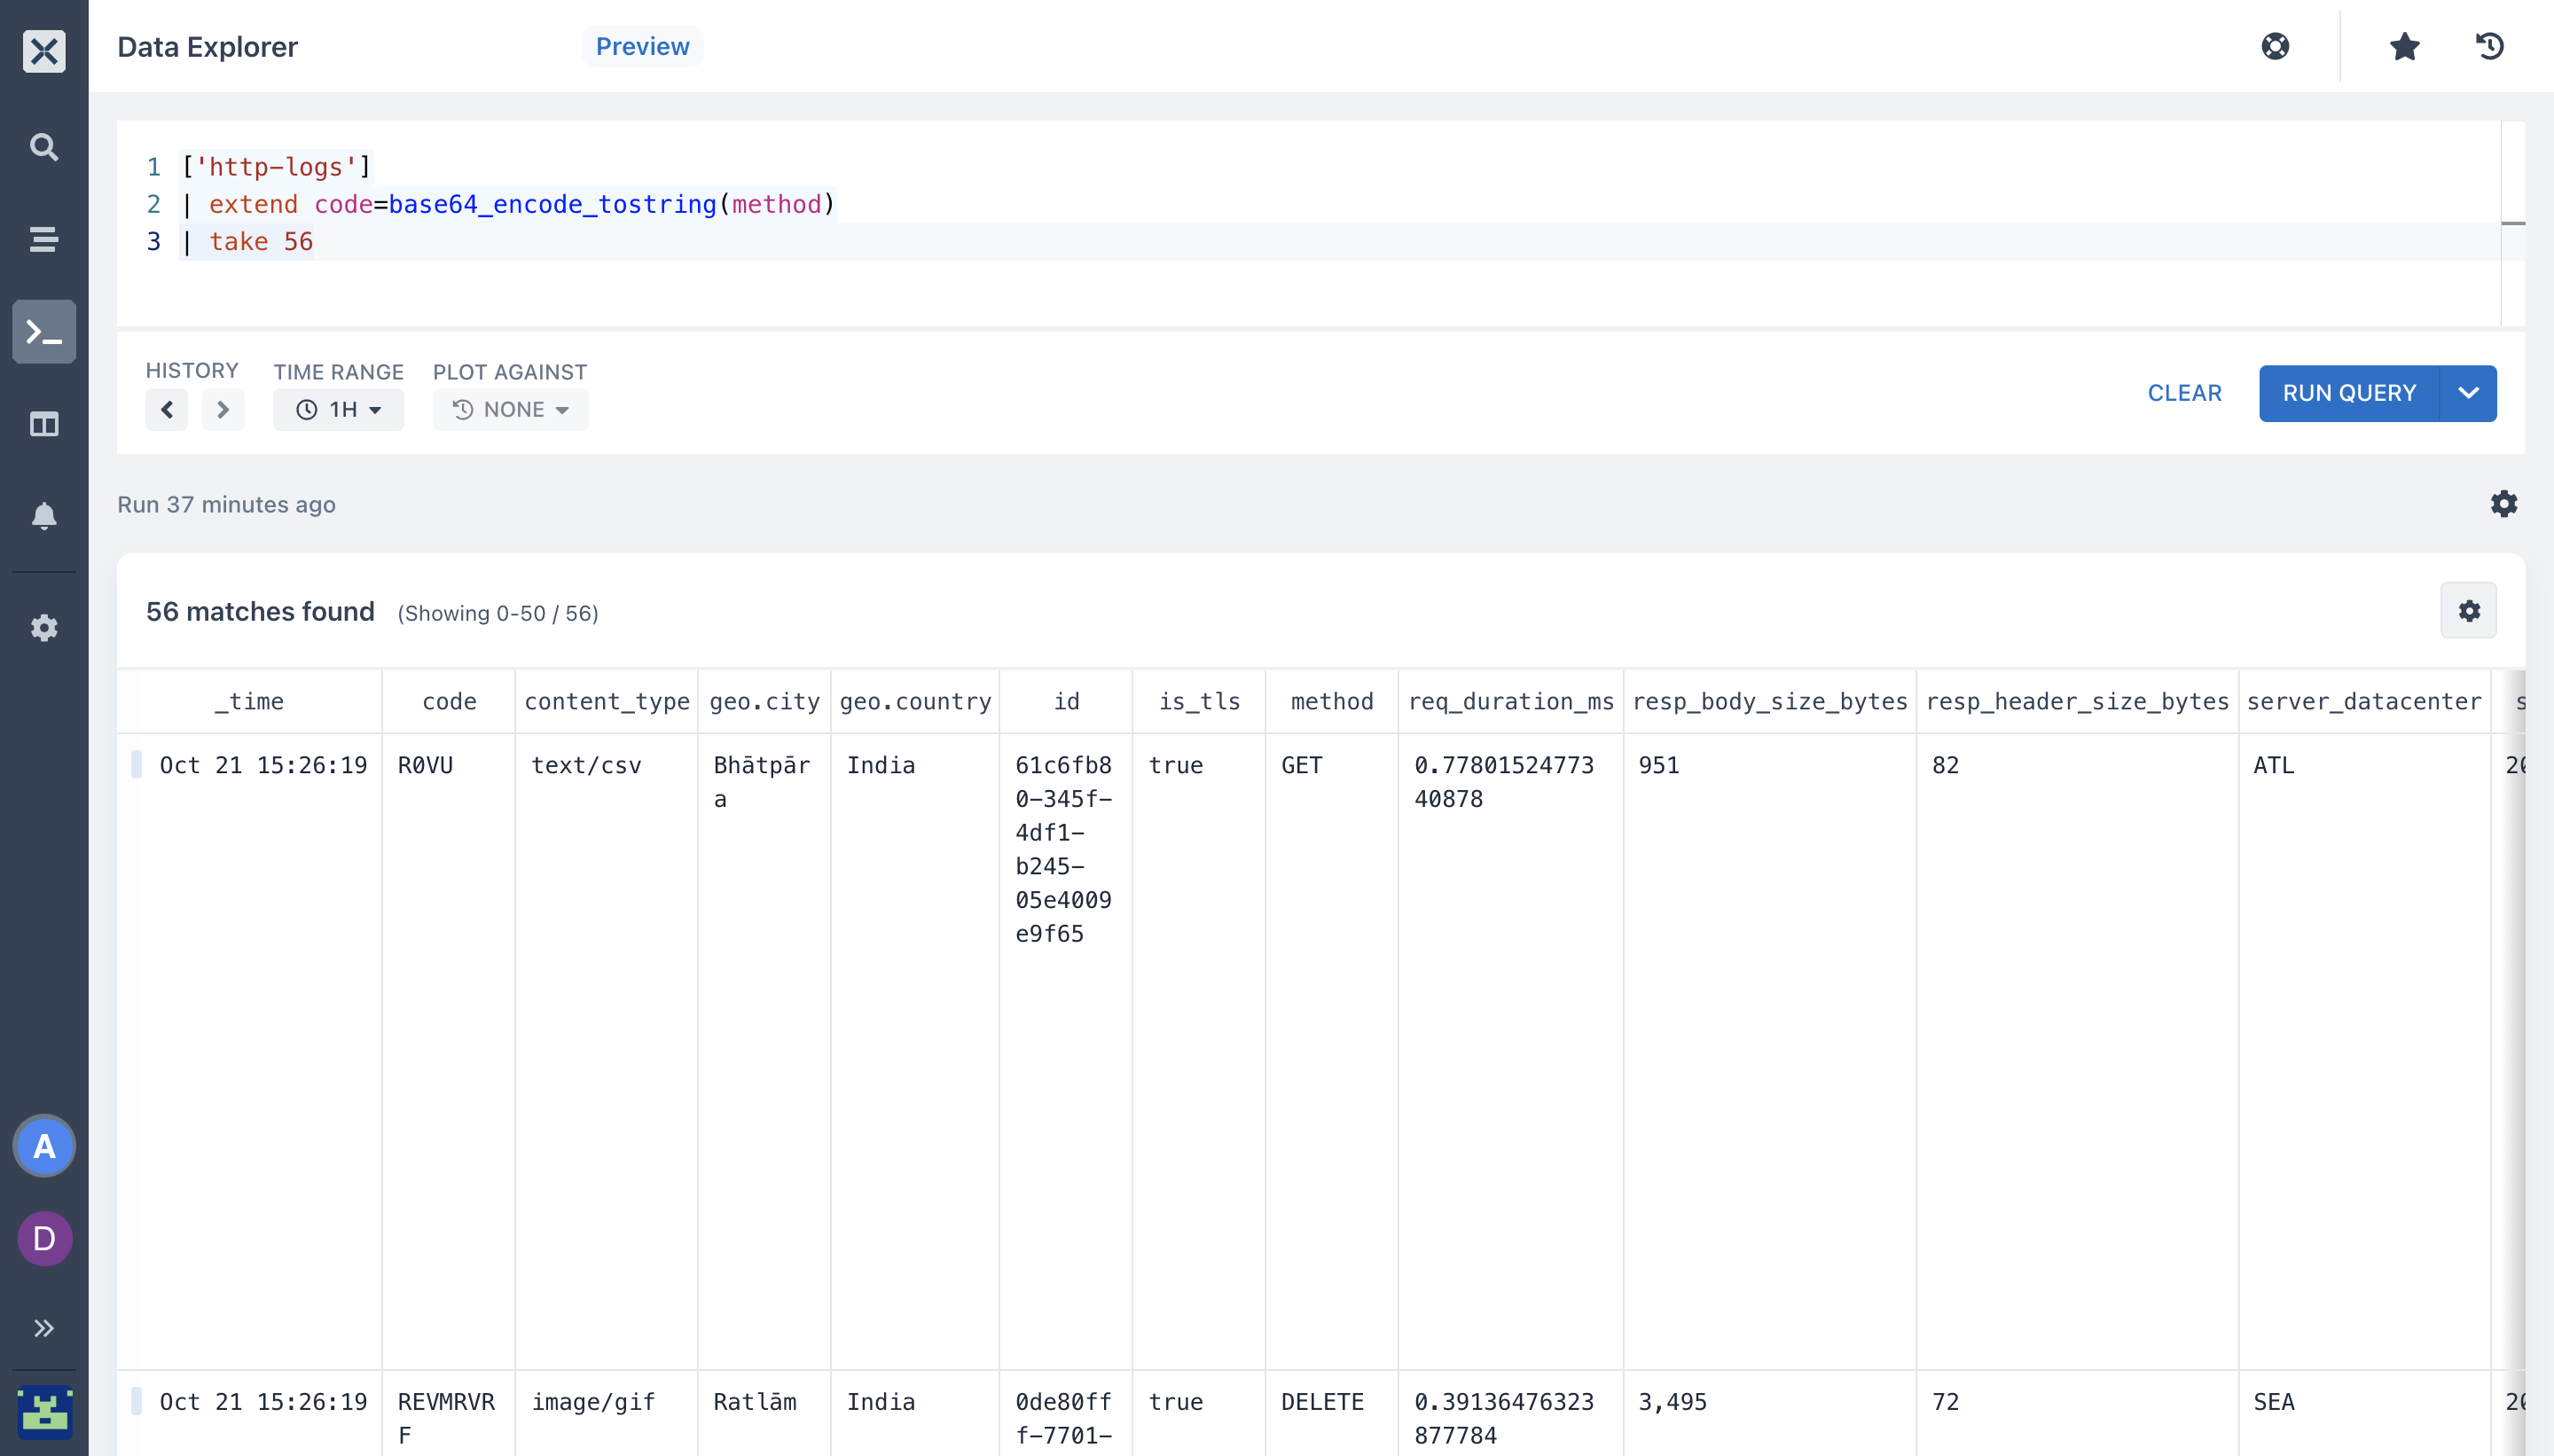
- You can run queries using our String Functions. Here, I want to encode a string field as a base64 string.
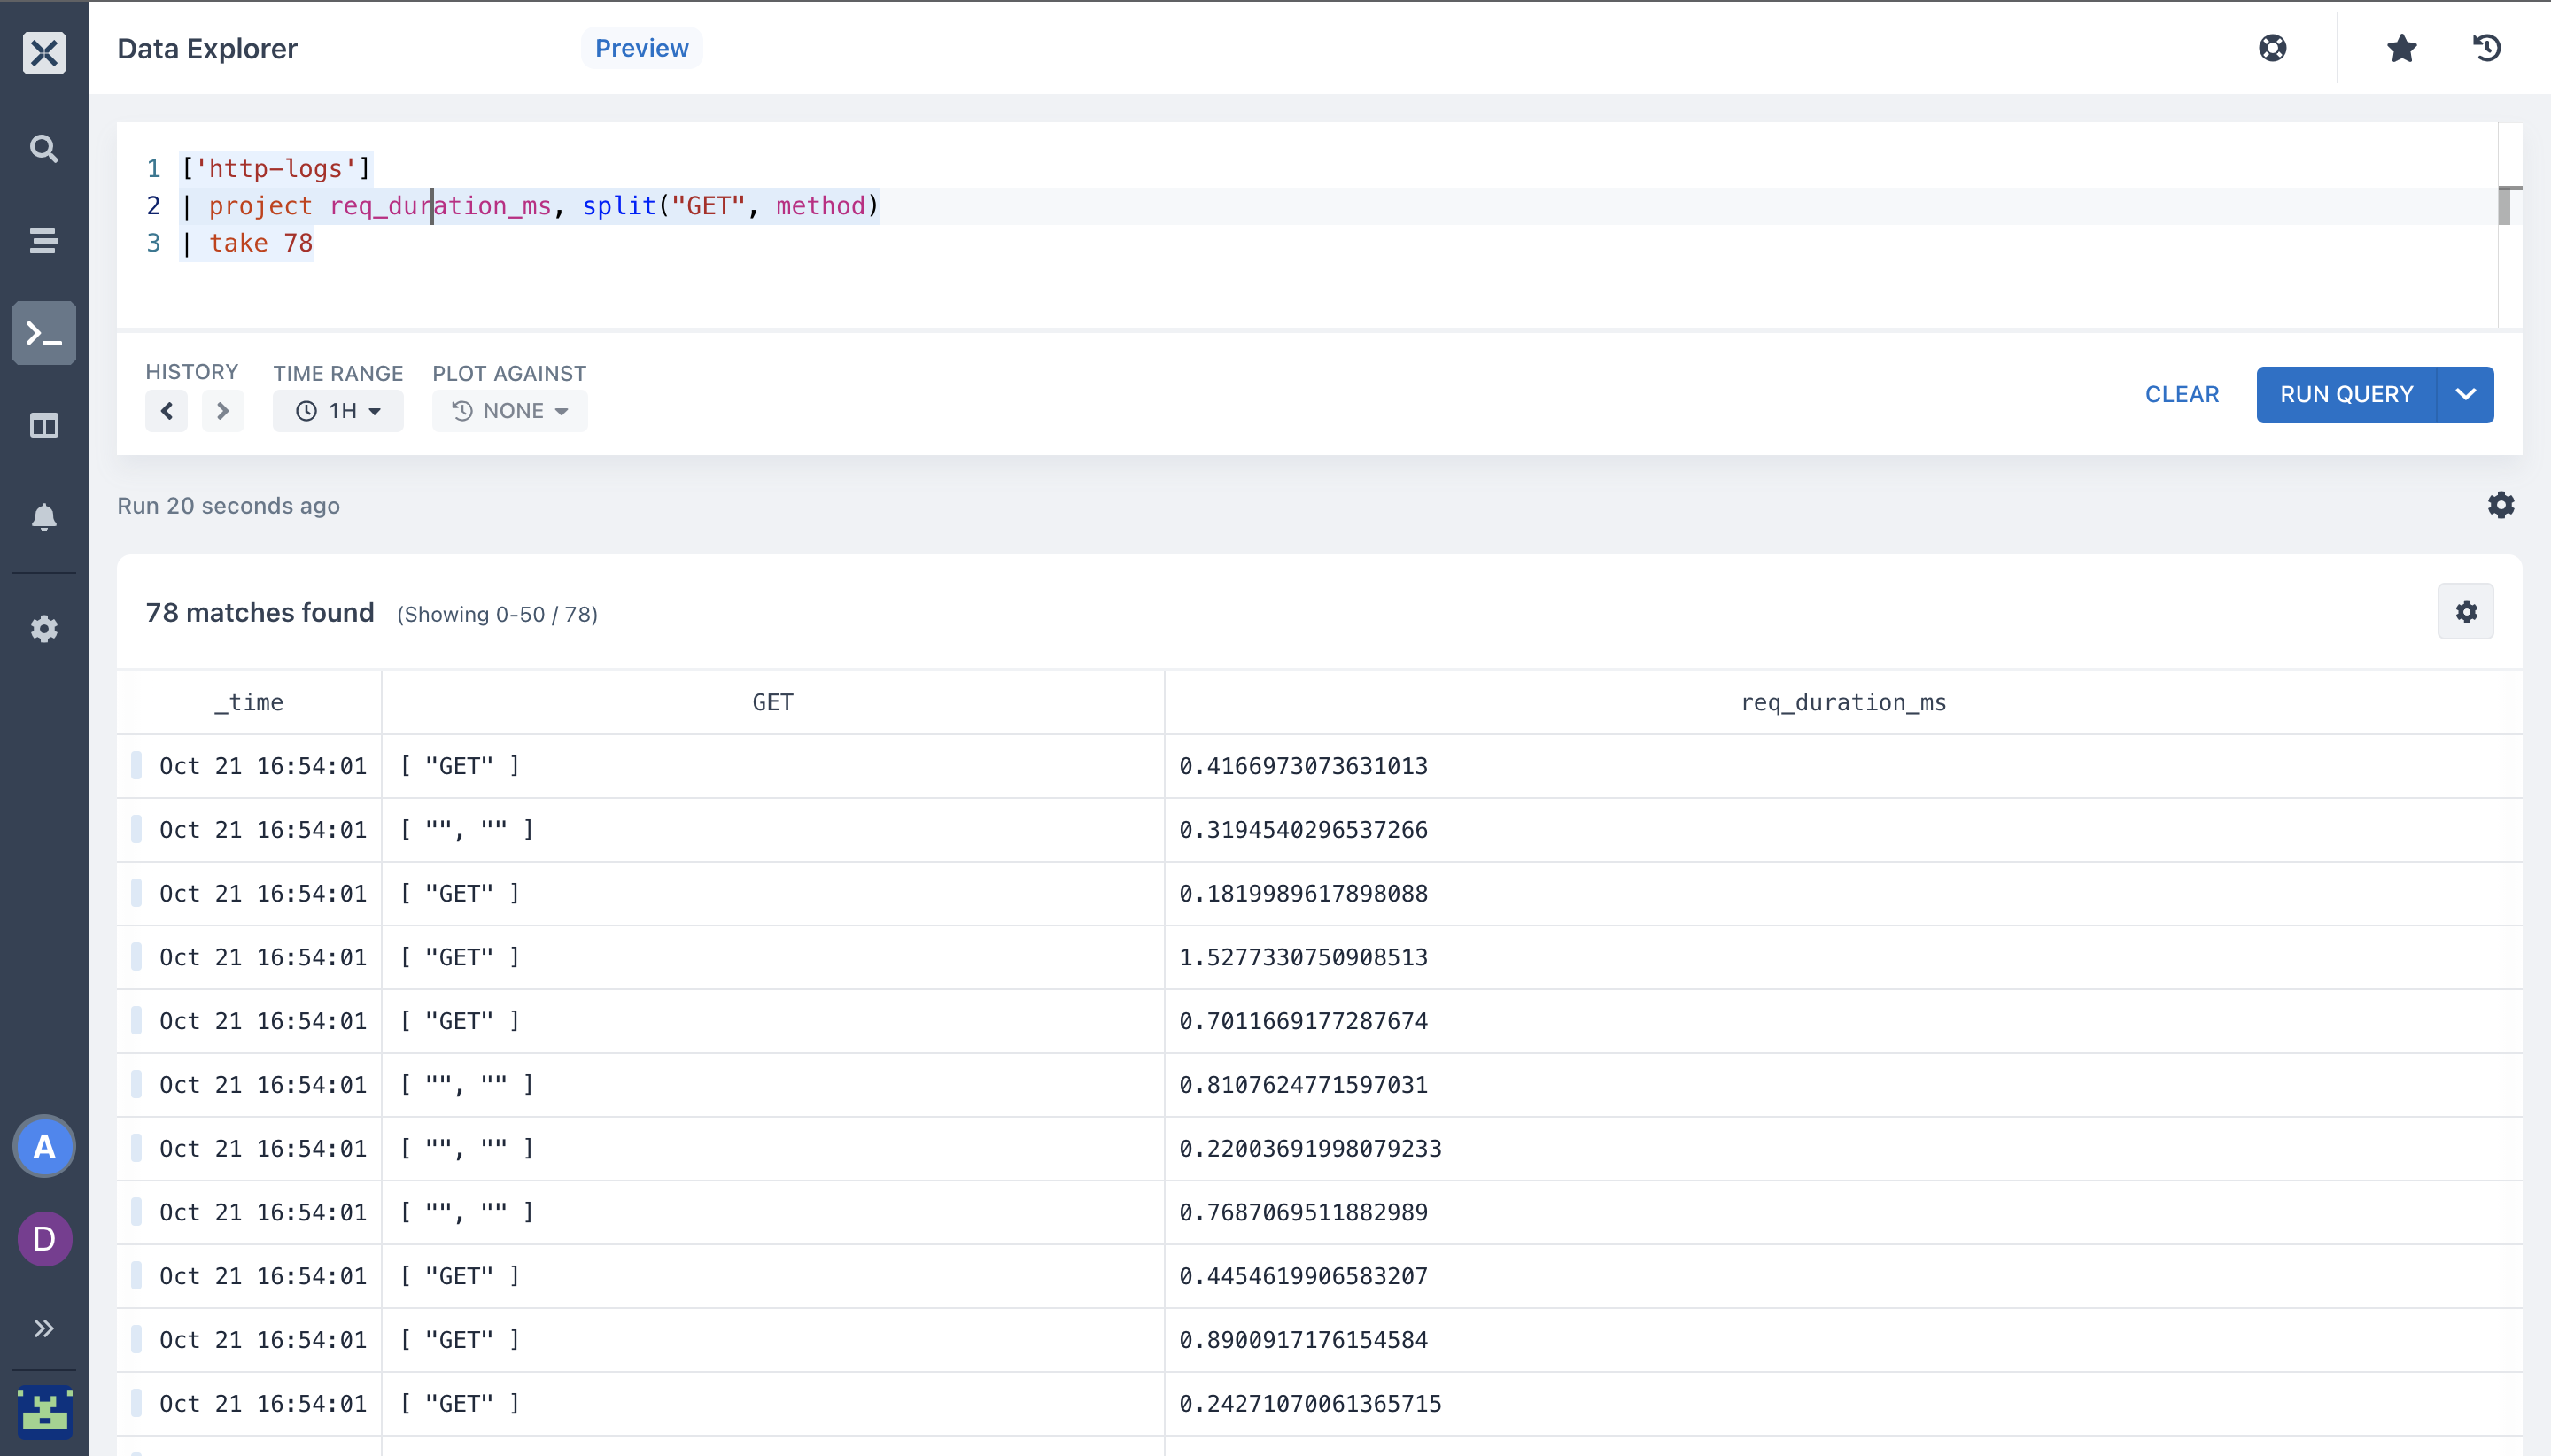
- split: Here, I want to split the given string according to a given delimiter and return a string array with the contained sub-strings. Where:
GETis the source and method is thedelimiter
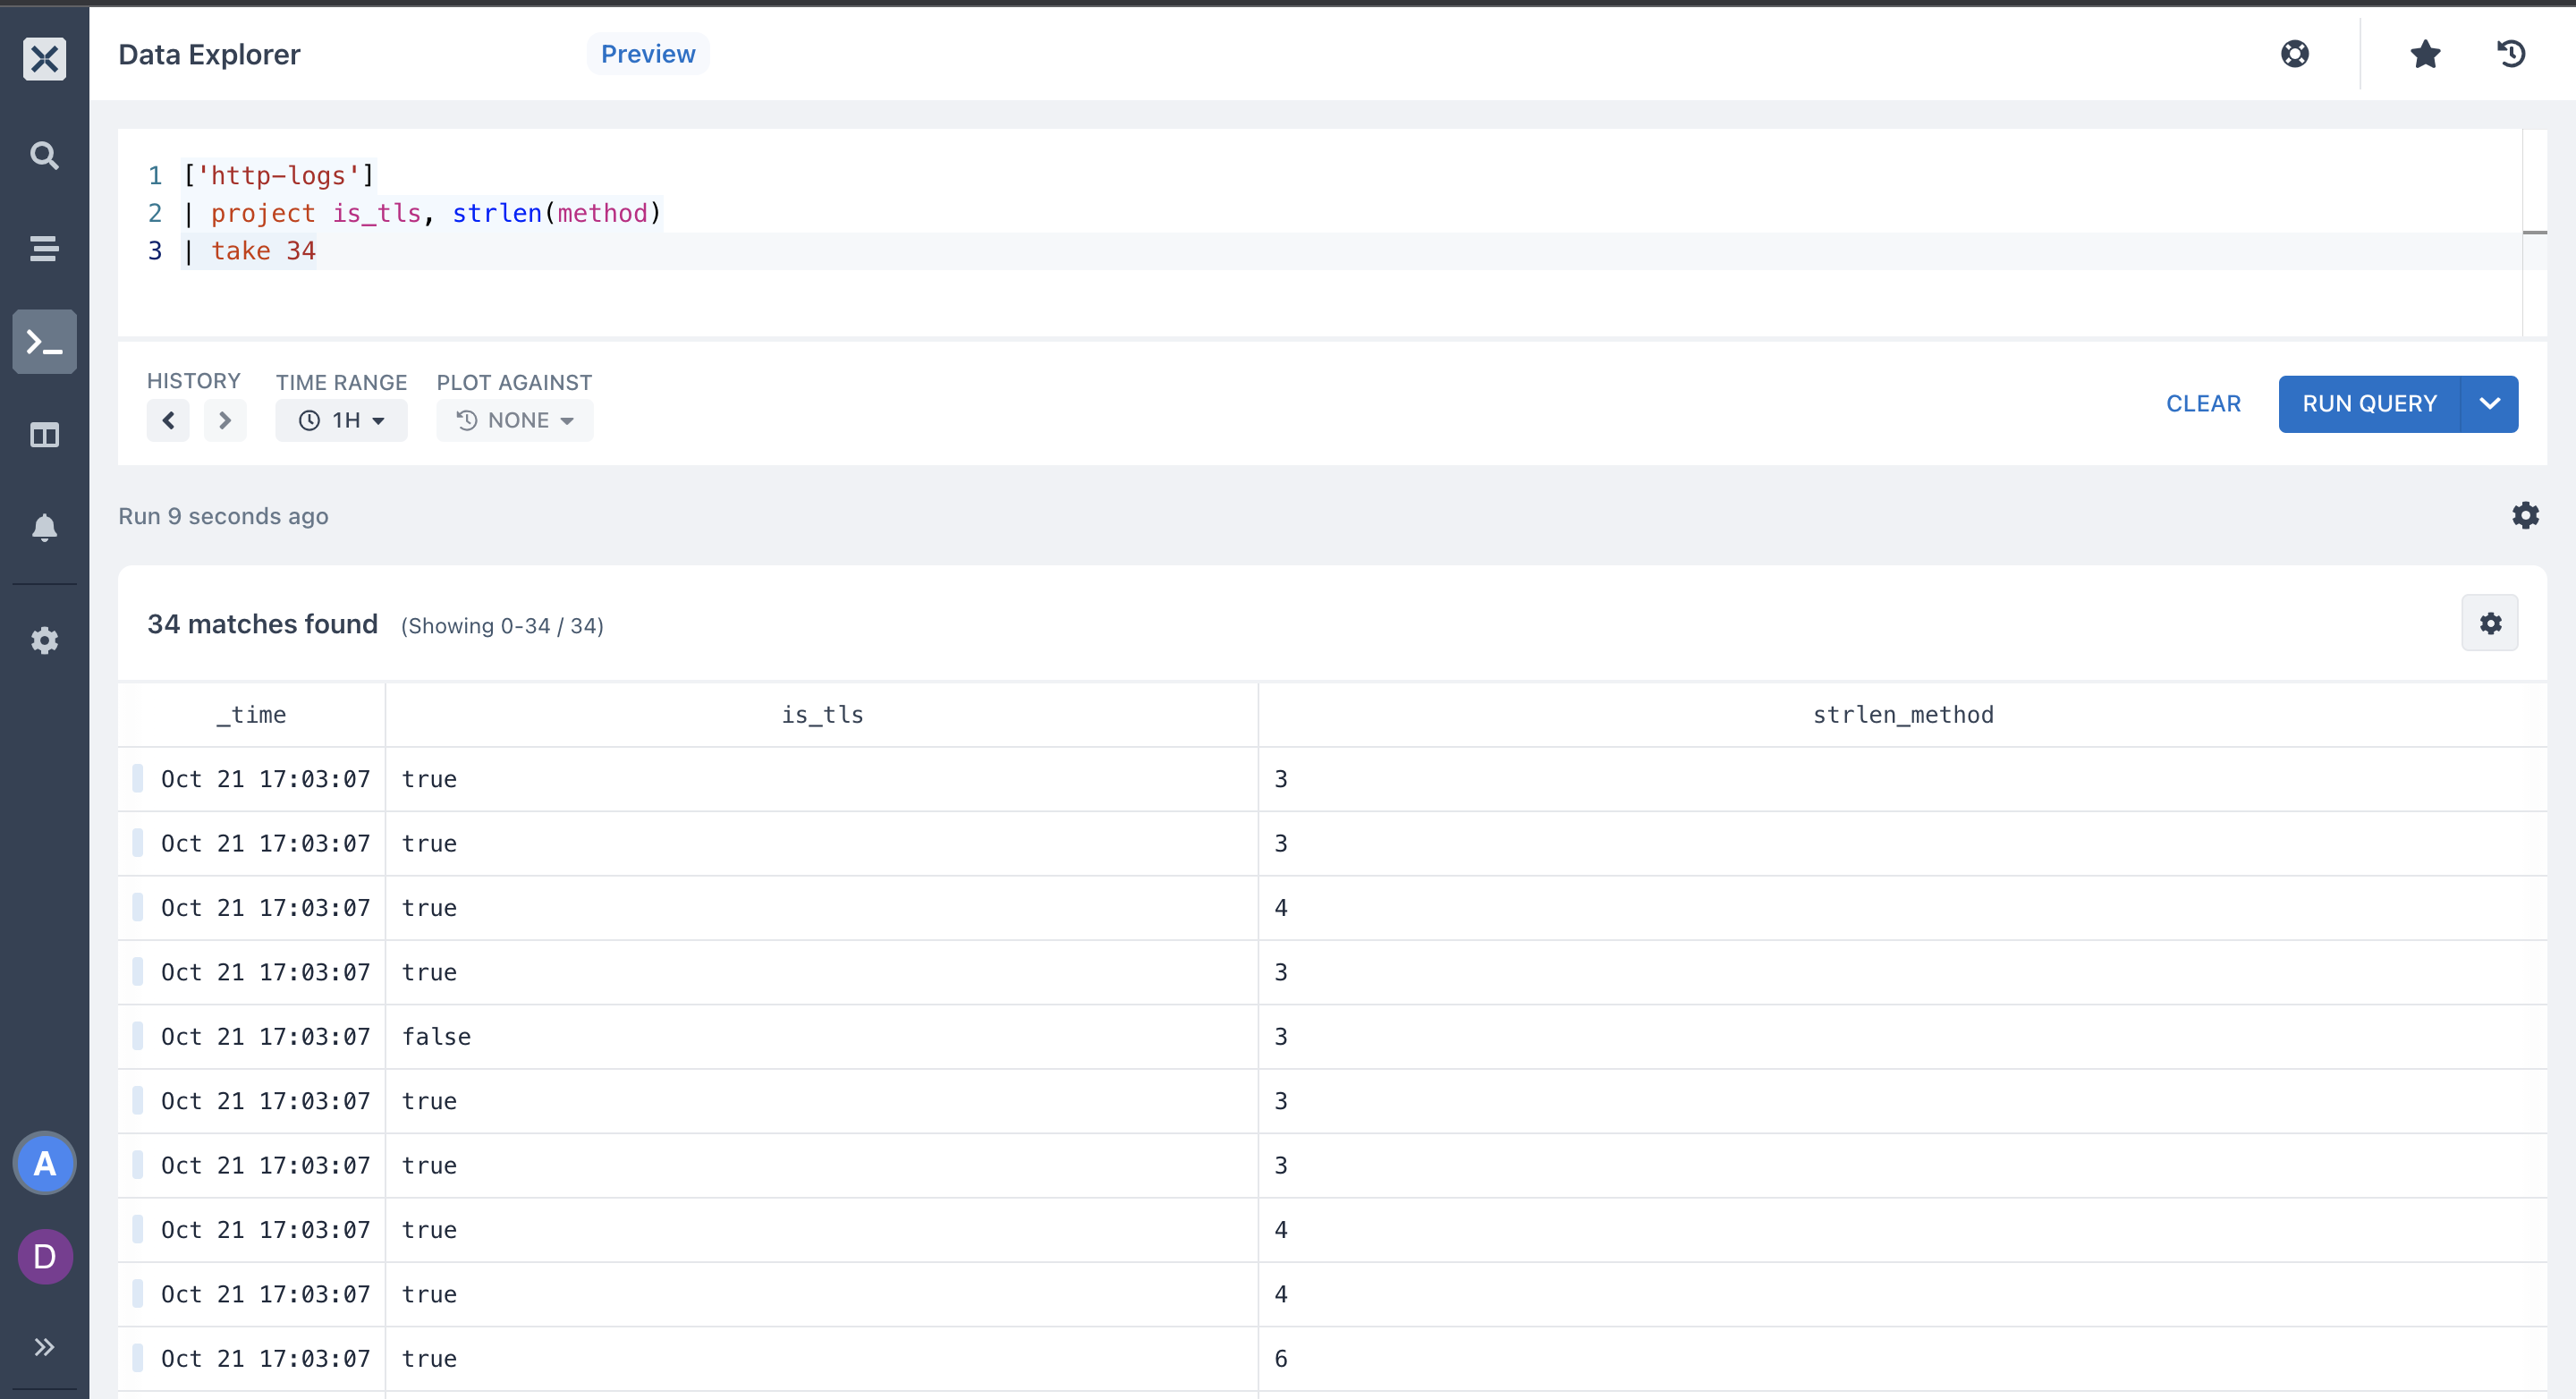
- strlen: Use the
strlenstring function to return the length, in characters, of the input string.
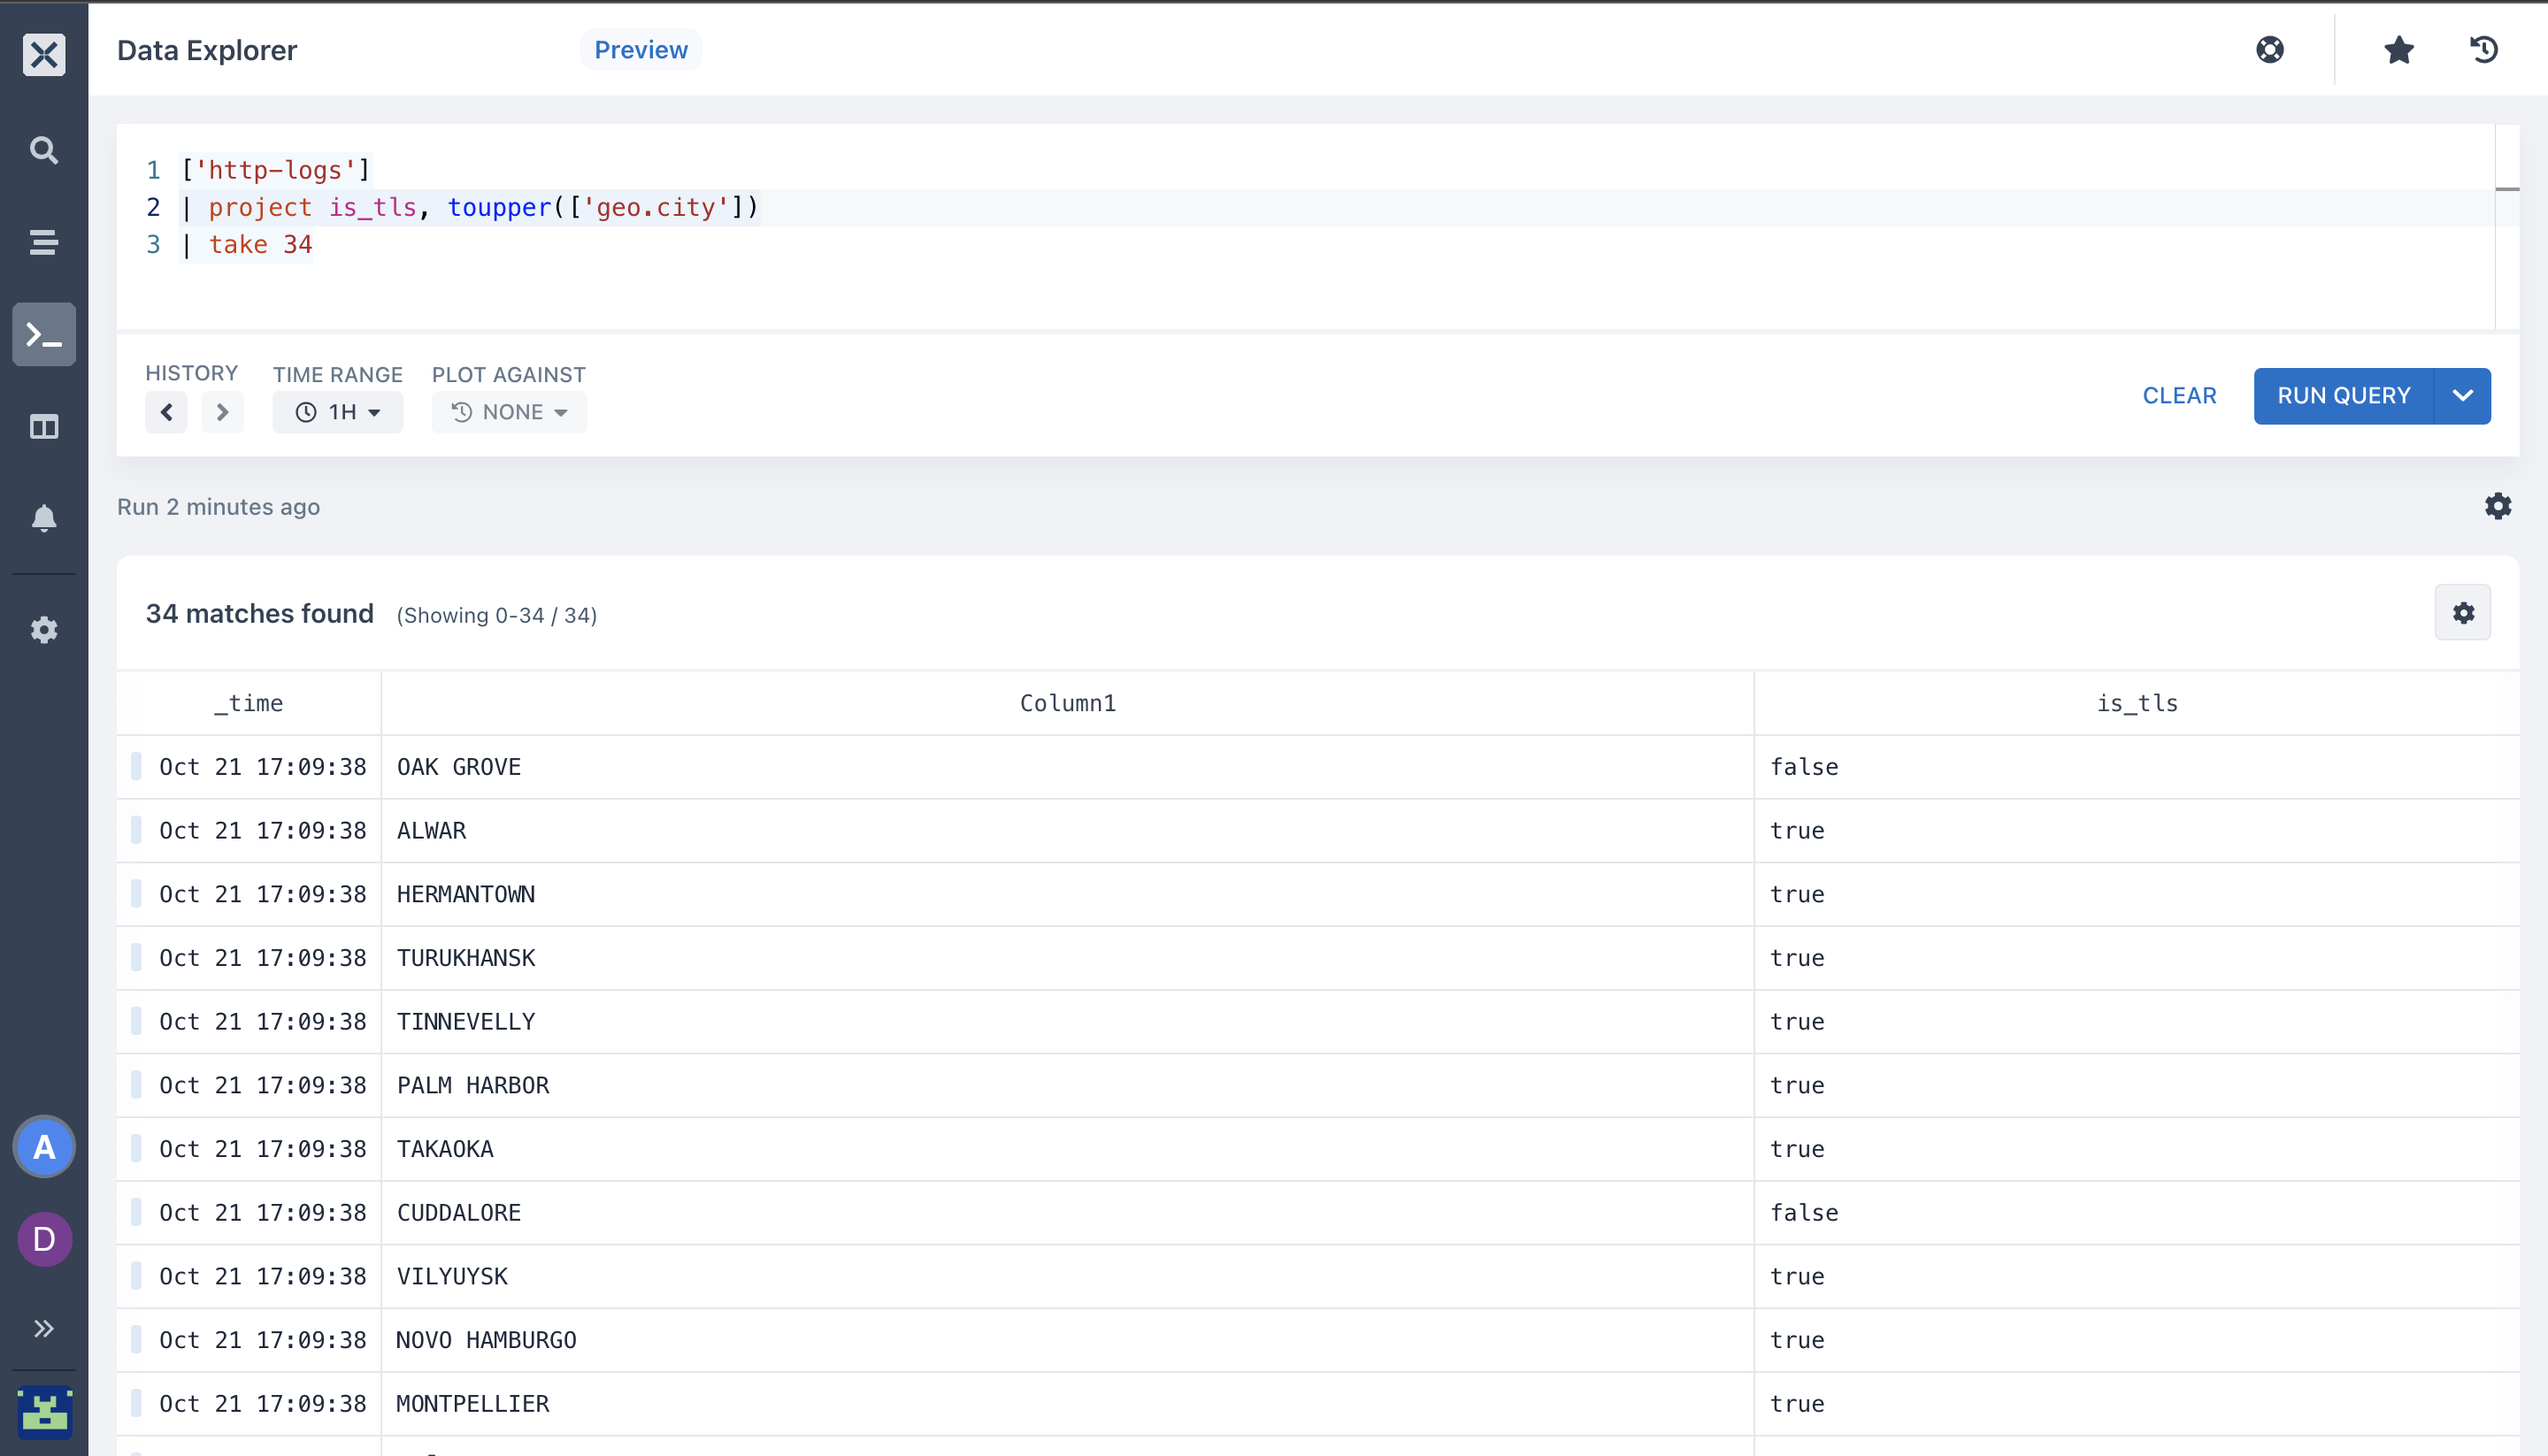
- toupper: Use the
toupperstring function to convert a string to uppercase.
- You can also combine different
operatorsandfunctions.
Help me!
Don’t worry my little developer lamb, I’ve got you. ❤️
We've got our Sandbox for you to play with different datasets.
-
Click this link to join other developers in our Discord community who are using Axiom. Find resources, ask questions, and share your knowledge!
-
Sign up for Axiom Cloud - The fastest and simplest way to get started with Axiom.
References for the road
- Explore Axiom Playground
- Axiom Processing Language docs
- Working with Tabular Operators
- Exploring Scalar Functions
- Introducing Scalar Operators
- Aggregation Functions
Until next time!


