
Grafana is the leading open-source technology for dashboards and visualization, with more than 1 million active instances of Grafana around the world. Application Developers and Platform Engineers count on Grafana to provide a single-pane-of-glass for application monitoring and troubleshooting.
Today, we’re pleased to announce a powerful new data source plugin that brings your Axiom event data to Grafana. Using the plugin, you can store your event data in Axiom’s cloud-native, hyper-efficient, and scalable event datastore, and use Grafana Explore to iterate on queries and dashboards. Whether you’re monitoring Kubernetes clusters, climate change or a rocket launch, you can now enjoy all the benefits of Axiom’s reimagined architecture and use familiar tools in Grafana to analyze your events.
How the Axiom data source plugin works
The Axiom data source plugin is a commercially signed data source plugin available in Grafana’s plugins catalog. Data source plugins communicate with external sources of data like Axiom and return the data in a format that Grafana understands. The code for the plugin is open source and available in the GitHub repository. Under the hood, the plugin uses Axiom’s official Go bindings to retrieve events efficiently.
Getting started
You can install the Grafana data source plugin on Grafana Cloud or local instances of Grafana. Follow the general plugin management steps in the Grafana documentation and find Axiom-specific details in the dedicated Axiom data source plugin documentation.
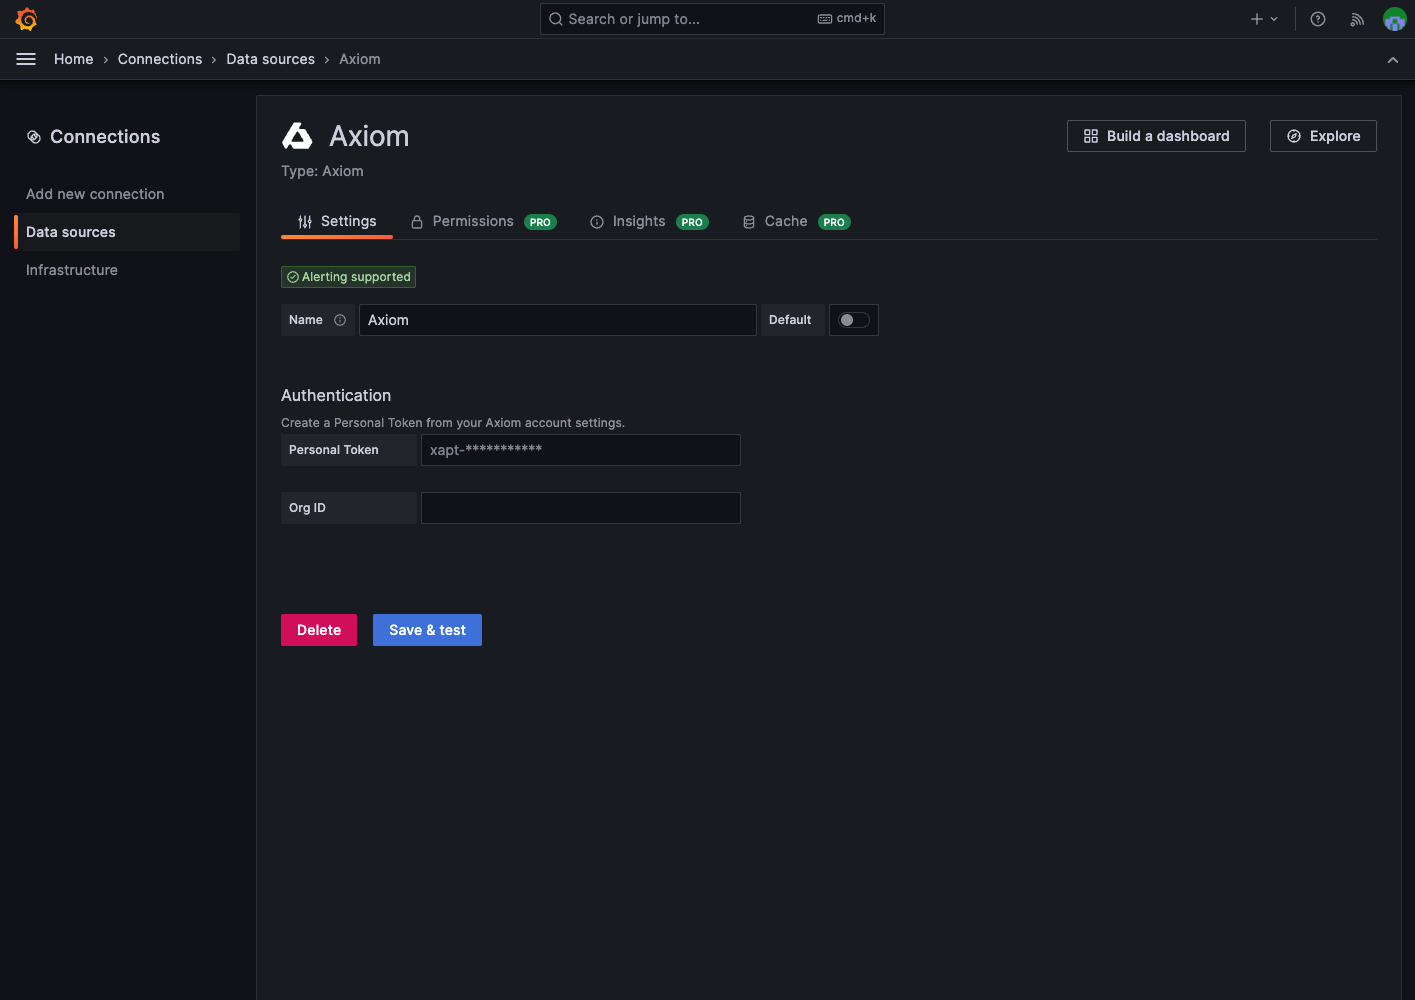
Once installed, you’ll need a Personal Token from Axiom and your organization ID to create an Axiom data source. Both are available from your profile settings.
What you can do with the Axiom data source plugin
With the plugin installed and configured, you can use events from your Axiom datasets in Grafana Explore, create dashboards with panel building blocks, and take action through Grafana Alerting.
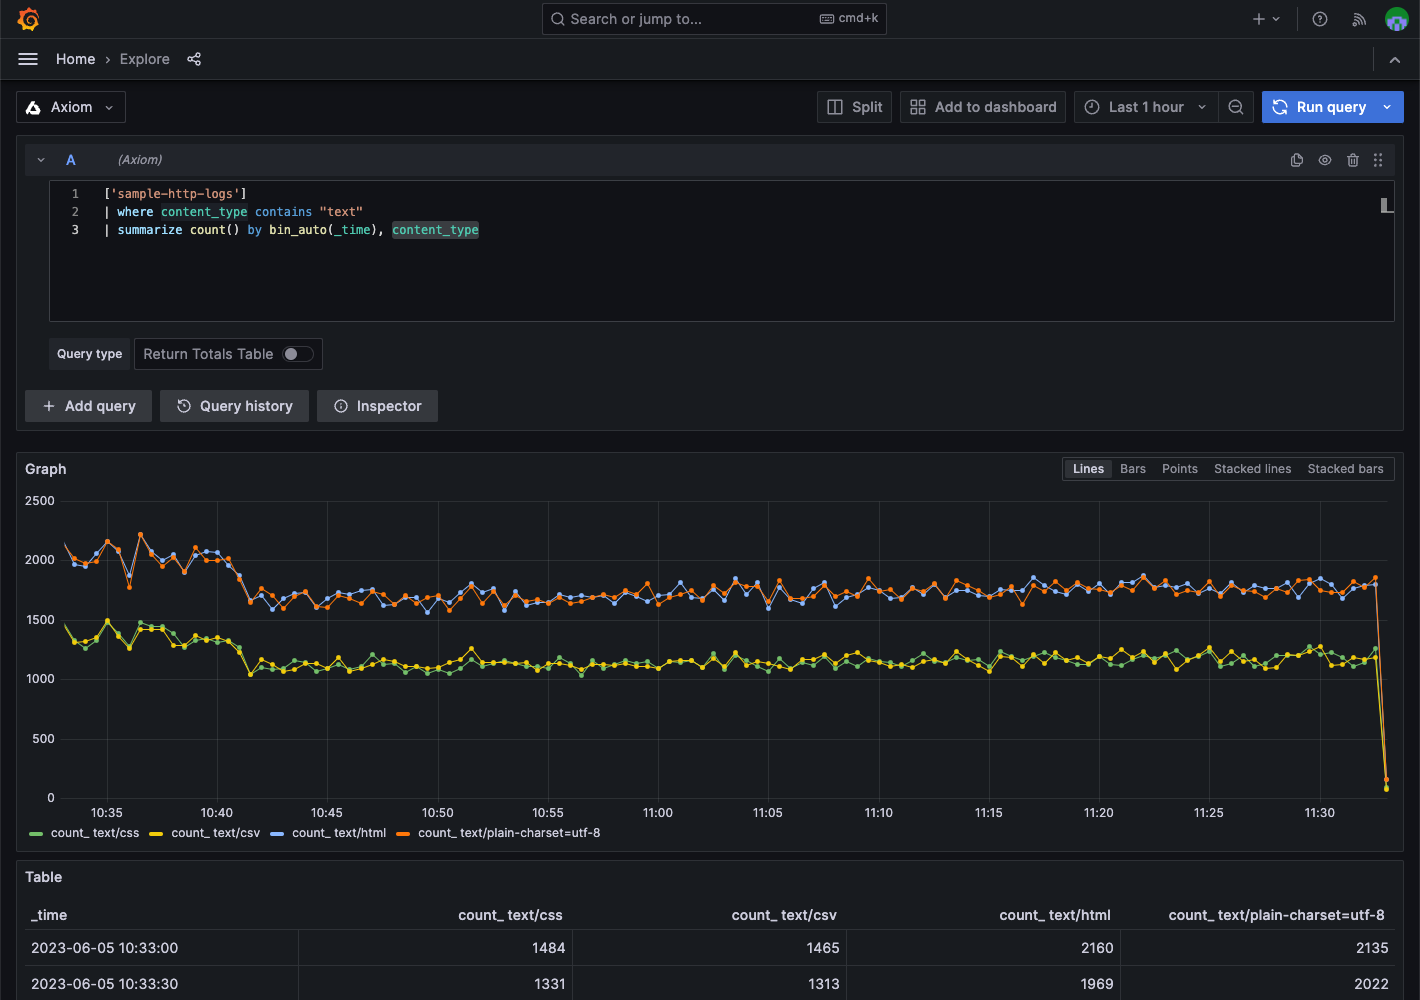
Grafana Explore with Axiom’s APL query language
Axiom has a powerful piped query language, APL, for exploring events. Selecting an Axiom data source in a Grafana Explore tab will display a dedicated editor with schema completion and language workers that provide familiar syntax highlighting out of the box.
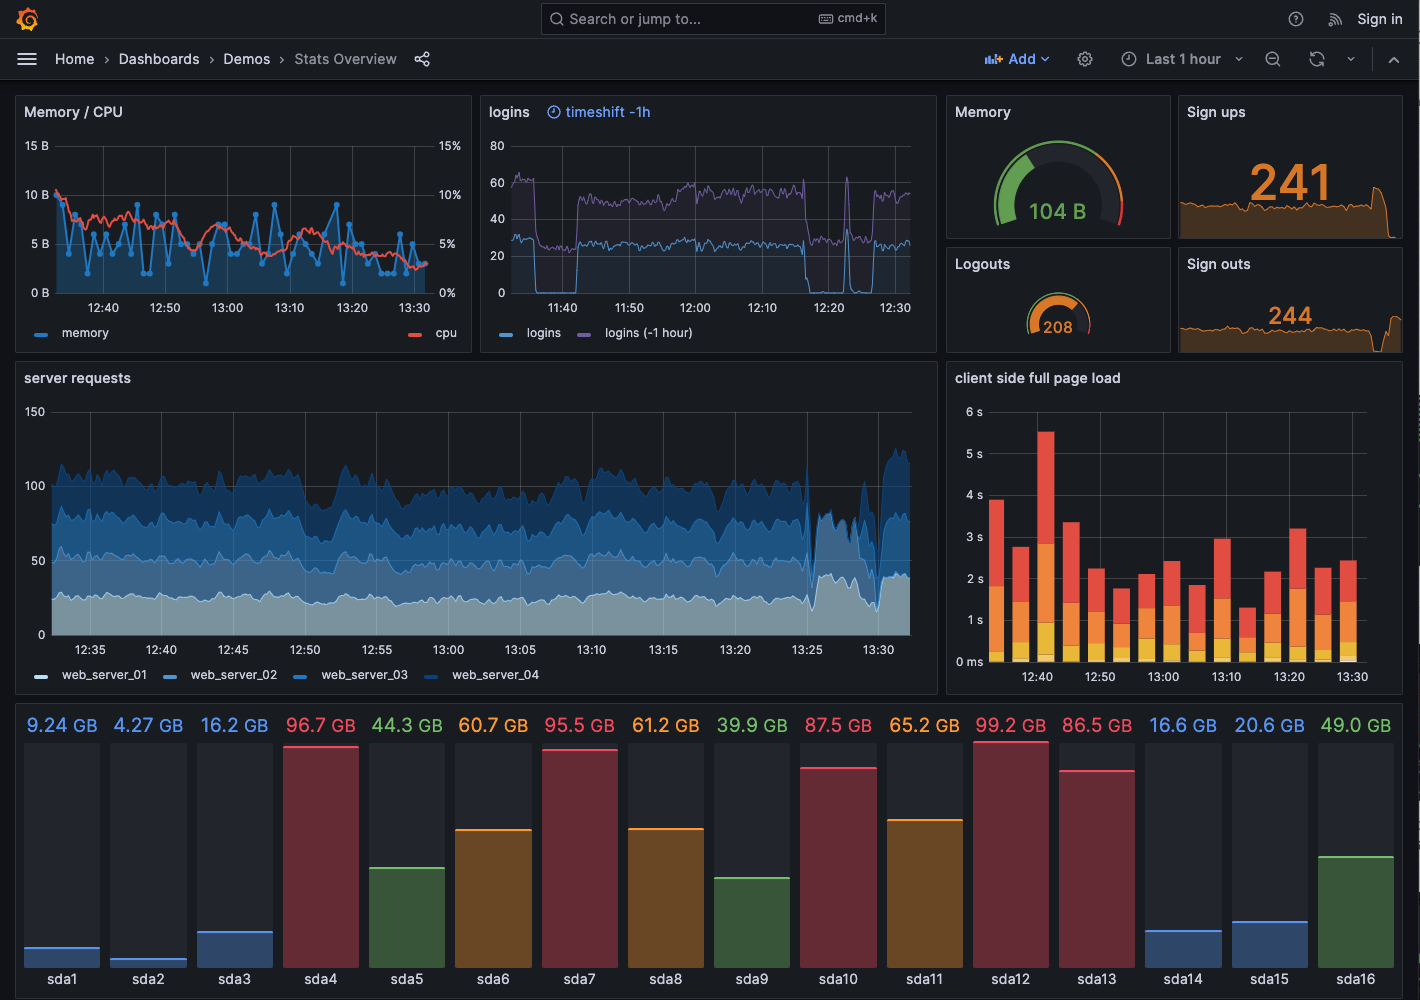
Grafana Dashboards with Axiom’s hyper-efficient performance on data
Grafana dashboards provide a global view of your event data through rows of panels. With over 100 core- and community-created panels to choose from including heatmaps, geomaps and candlestick charts, Grafana is the perfect complement to Axiom’s cloud-native event data store that offers unbeatable performance.
All panels created with an Axiom data source offer the same flexible options as other Grafana data sources including graph styles, units and thresholds.
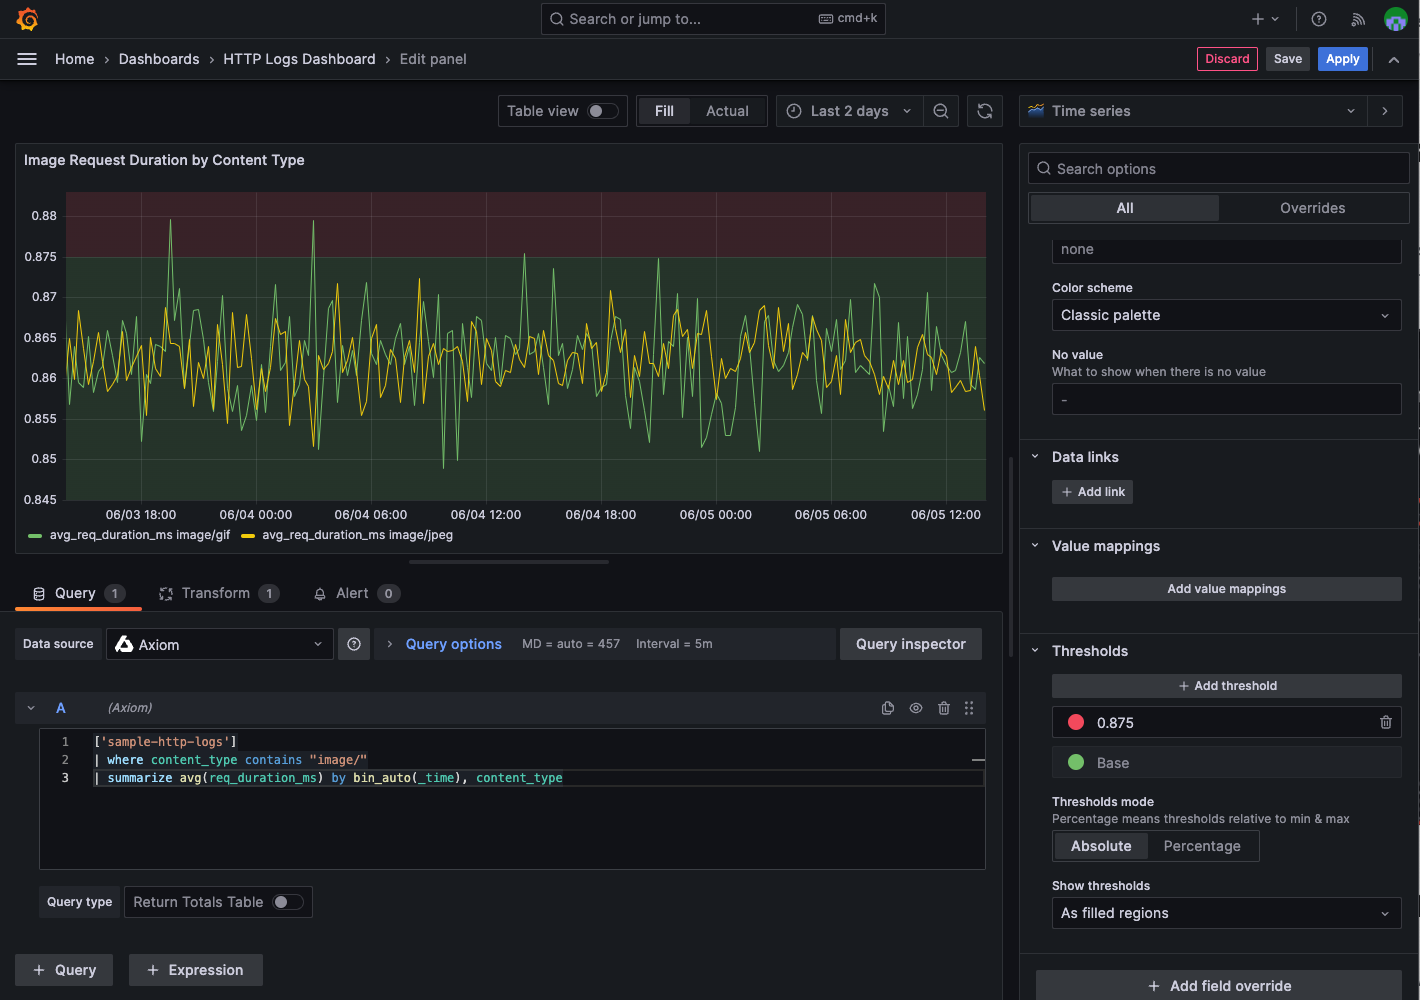
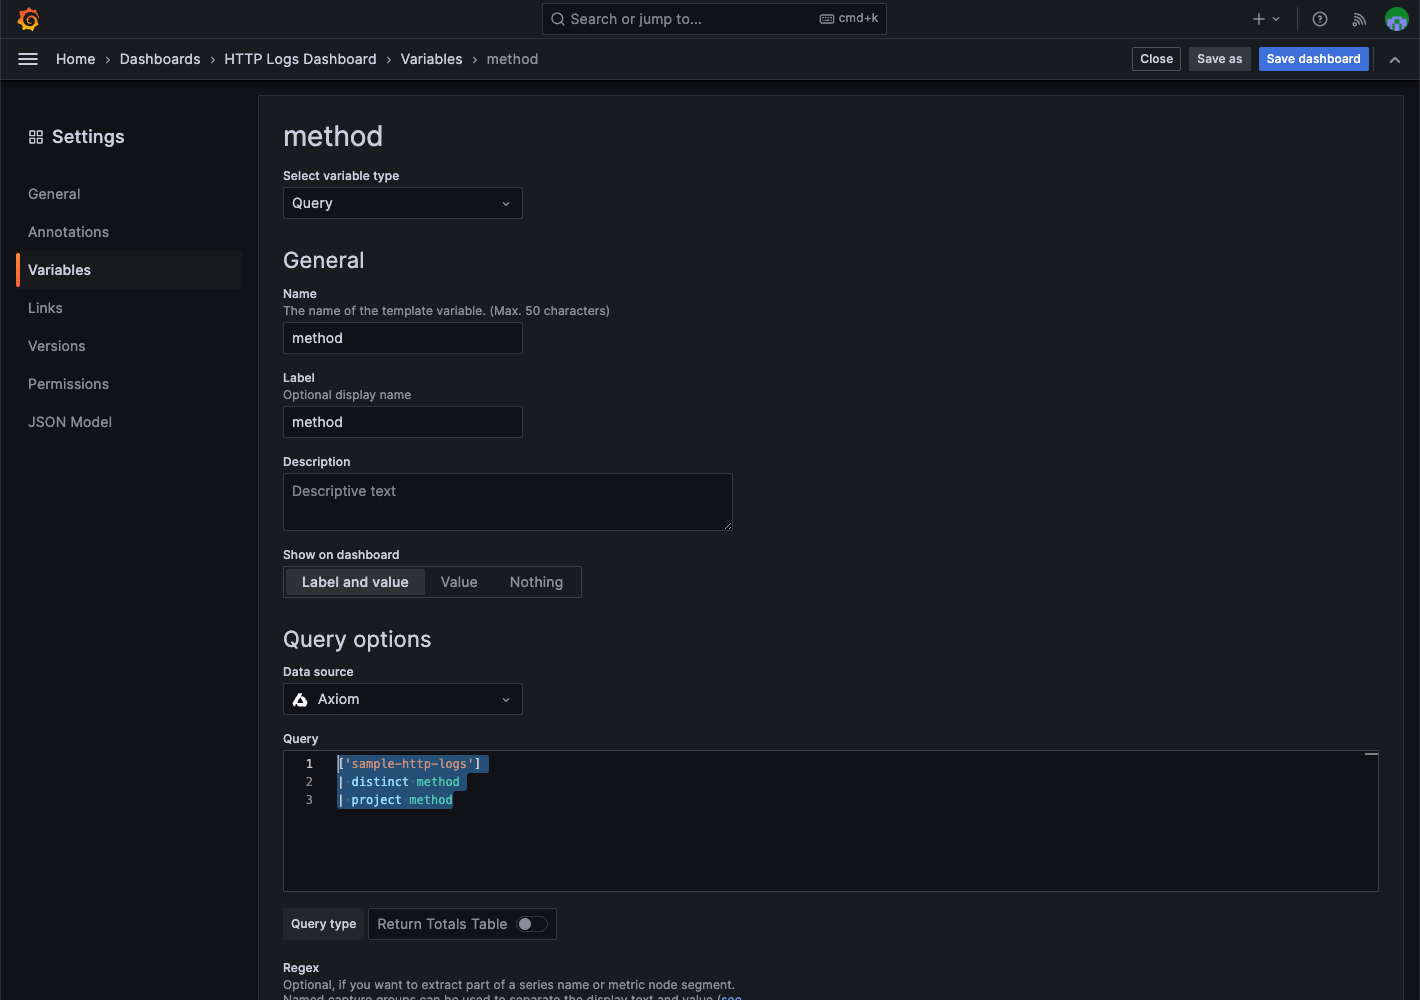
You can even take advantage of Grafana variables when your team want to adjust visualizations in dashboards quickly. Axiom’s convenient distinct and project operators in APL make configuration easy.
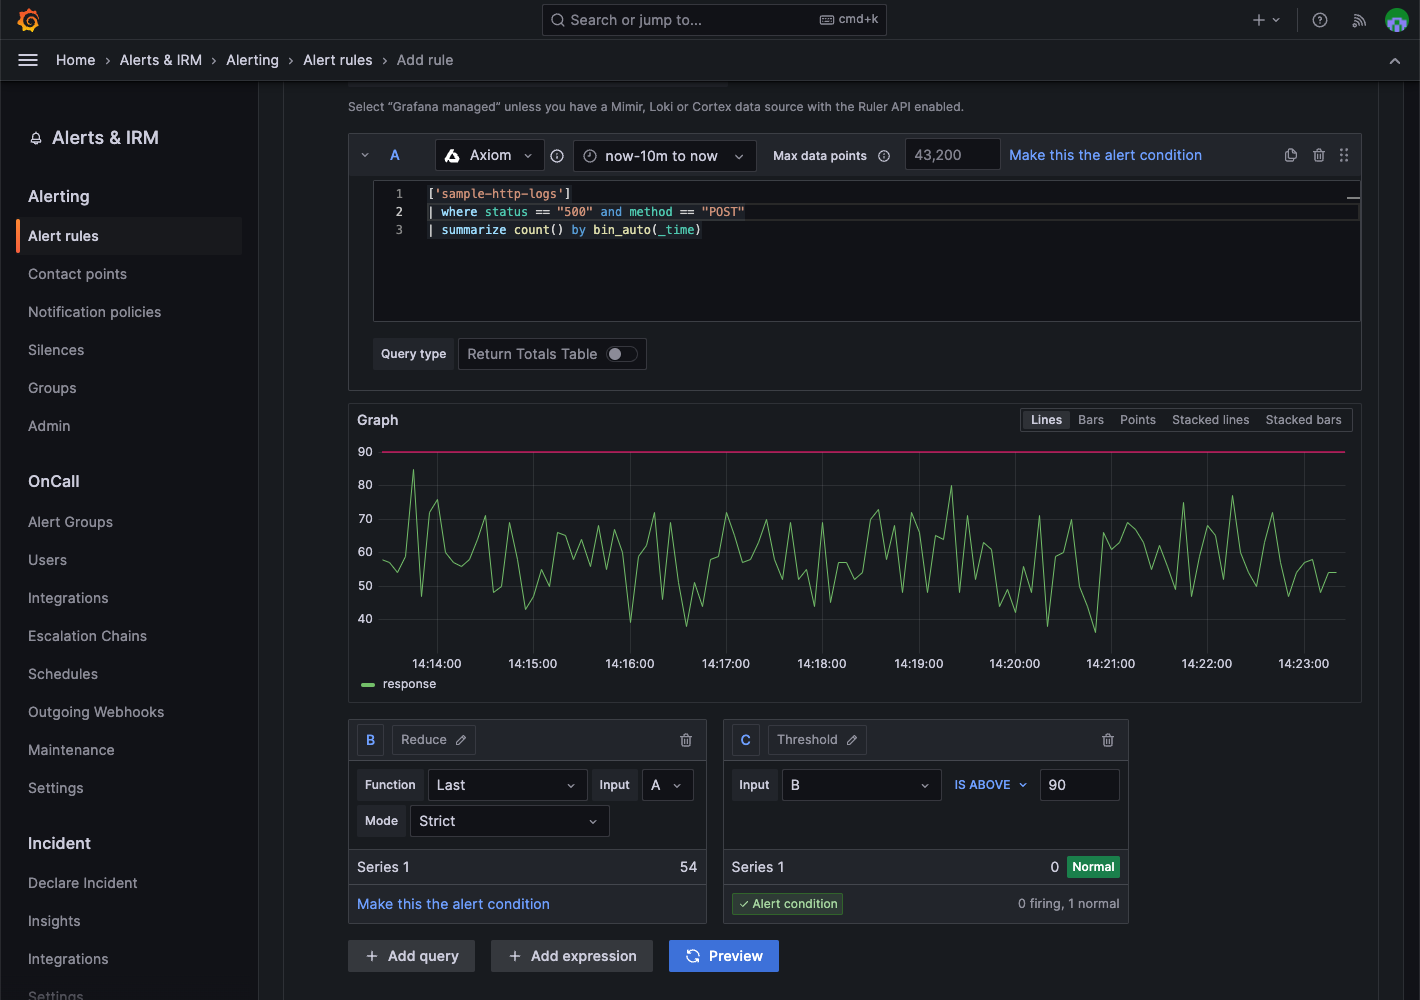
Grafana Alerts on Axiom data source
If your team depends on Grafana to be notified about changes in events, you can enjoy the same flexible configuration options with Grafana managed alerts.
Get started today
At Axiom, we recognize how important it is to have access to your event data everywhere you work to monitor and troubleshoot your applications. That’s why we’re excited to share this new data source plugin. If your team already uses Grafana and wants to augment your event data stack with a hyper-efficient event datastore, you can create an Axiom organization and set up the data source plugin in minutes to get started today.


