Changelog

week 27 · 2026

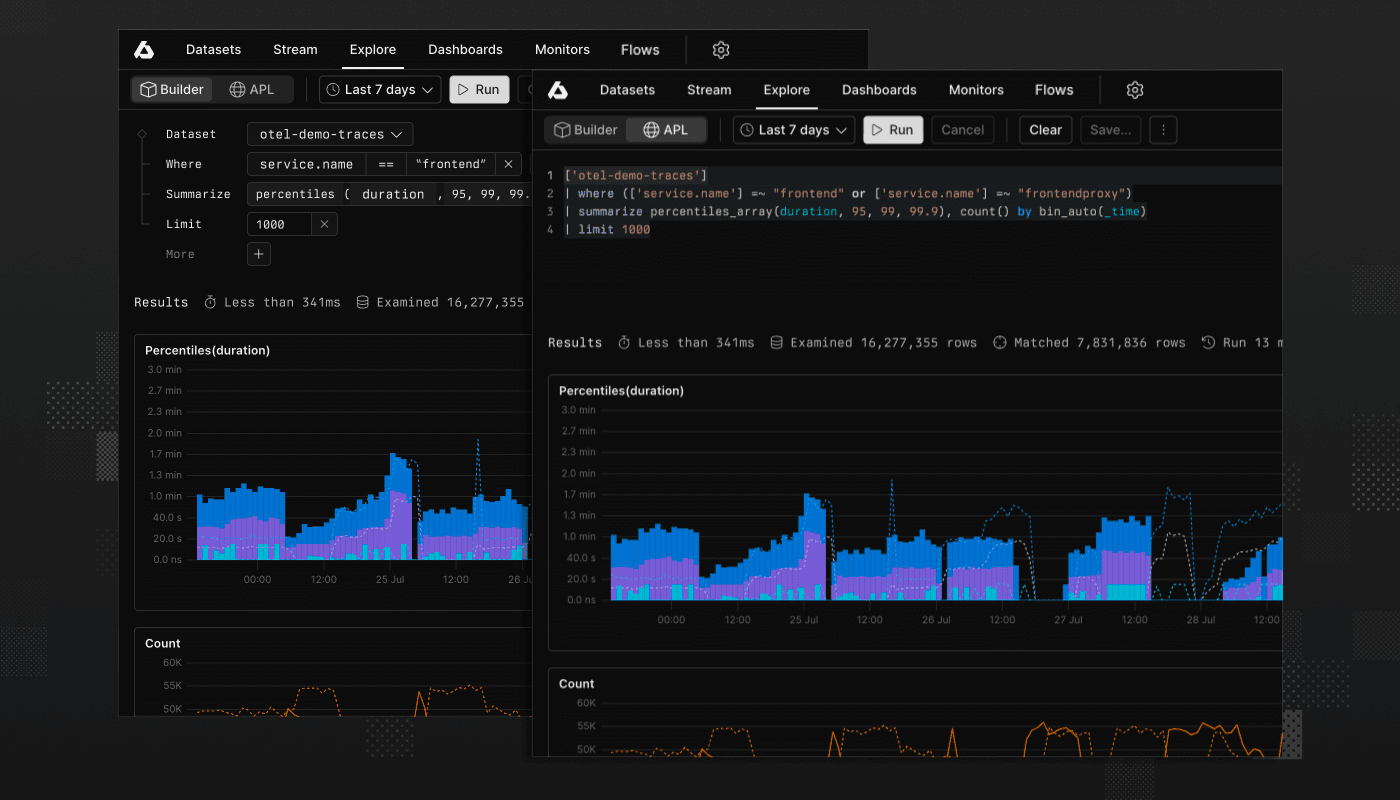
APL and MPL in the Grafana data source

Query Axiom from Grafana in both APL and MPL, four new weighted aggregations in APL, and monitor management from your AI agent.

This week the Axiom data source for Grafana learned to speak APL and MPL, APL picked up four new weighted aggregations, the Axiom MCP server gained monitor and notifier management, and metrics datasets get a Kubernetes dashboard the moment the data arrives.

APL and MPL in the Grafana data source

The Axiom data source for Grafana now runs both APL and MPL queries. Previously the plugin spoke a legacy APL-only query shape; the new version shares a single v2 query model across both languages and migrates your saved queries for you.

  • Query in APL or MPL: Write APL for logs, traces, and events, or MPL for metrics, with CodeMirror language support in the panel editor.

  • Grafana-native results: Query results come back as Grafana data frames, with dedicated builders for time series, log lines, traces, tables, and logs-volume panels, so results render the way Grafana expects.

  • Template variables: APL and MPL variable queries now drive dashboard variables, including dataset, metric, and tag-value selectors.

  • Fits your Grafana setup: The plugin supports newer Grafana releases and React 19, and honors your configured Grafana HTTP client options rather than its own transport.

Update to the latest version of the Axiom data source to pick these up. If you query an edge deployment, there is now a documented migration path for the edge URL and credentials.

Four new weighted aggregations in APL

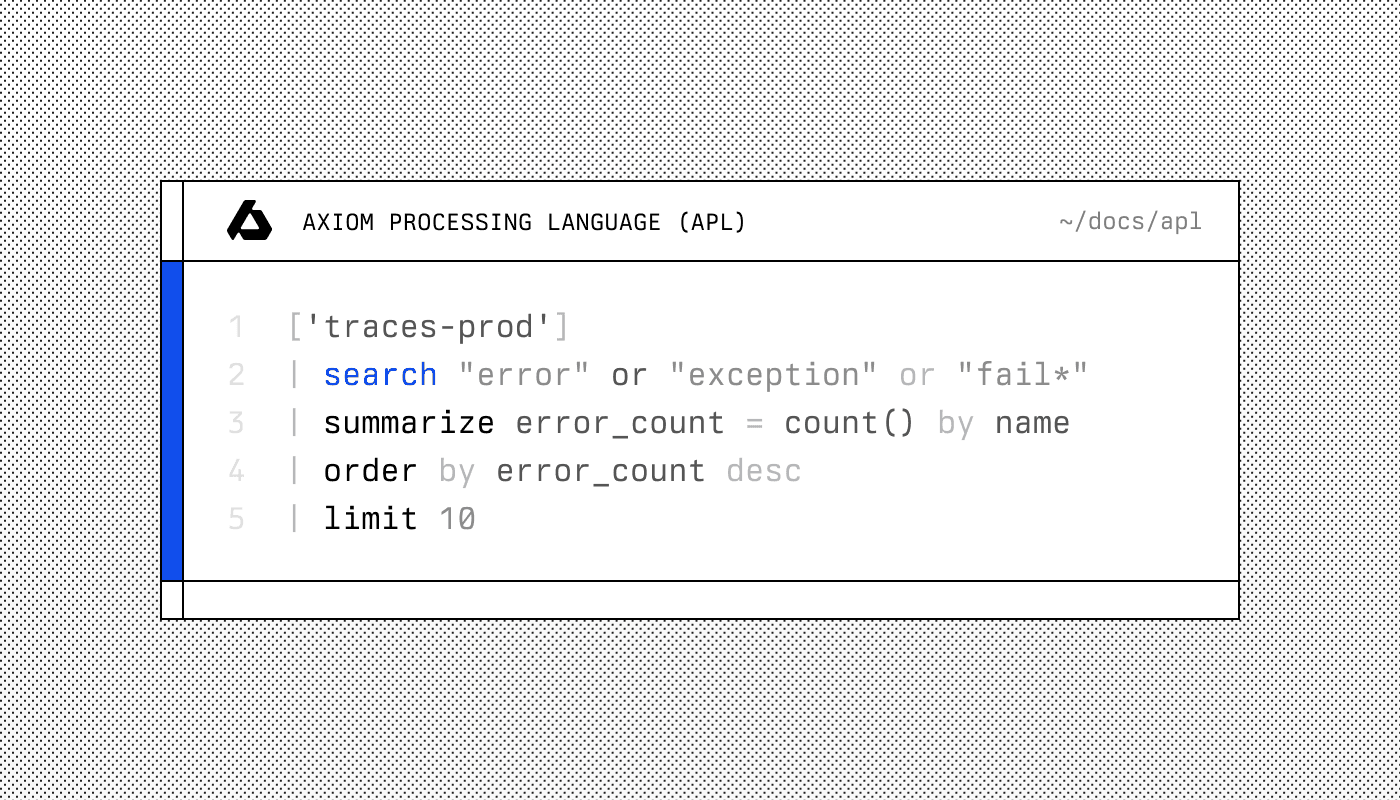
APL gains weighted variants of four aggregations: histogramw, variancew, stdevw, and topkw. They join the existing percentilew and avgw, so the full set of weighted aggregations is now available end to end.

A weighted aggregation takes a value and an integer weight that stands in for a repetition count. This is useful when each row already represents many observations, such as pre-aggregated counters, and you want the statistics computed as if the underlying events were expanded. Rows with a weight of 0 or less are skipped, and a missing weight defaults to 1.

More of Axiom for your AI agents

The Axiom MCP server now covers alerting, not just querying.

  • Monitor and notifier management: New tools let an agent create, update, and delete monitors, and list, update, and delete notifiers, so an agent can set up an alert and its delivery in one flow.

  • Richer metrics discovery: The listMetrics and searchMetrics tools now return each metric's type, temporality, and unit, which helps agents compose correct queries the first time.

Axiom is also now available as an official Grok plugin. The plugin bundles the hosted MCP endpoint and Axiom's skills together, so grok plugin install axiom wires up both at once.

Prebuilt dashboards for Kubernetes and your integrations

Integration dashboards are now generated from your dataset schema instead of a fixed server response, which means they show up automatically for the data you actually send. There are templates for Vercel, AWS Lambda, Cloudflare Logpush, Cloudflare Workers, Convex, OpenTelemetry traces, Tailscale, Next.js, and Netlify.

Dynamic dashboards now understand metric-backed templates too. Send Kubernetes kubelet stats to a metrics dataset and Axiom builds a Kubernetes Stats overview dashboard for it, no manual assembly required.

More of our favorite changes

  • Search inside trace logs: In the trace view, the search box now filters the correlated logs, with a toggle to match the log message only or all attributes.

  • Activity panel on events datasets: The dataset detail page shows total event count and a chart of ingest activity over a time range you choose, in the right sidebar.

  • Metrics in smart filters: A dashboard smart filter's options can now be driven by an MPL metrics query, not just APL.

  • Axiom on AWS Marketplace: You can now purchase Axiom through AWS Marketplace. Link your AWS account from the usage and billing page to buy and manage compute credits through your existing AWS agreement.

week 13 · 2026

Metrics are now generally available

This week is a big one for Axiom. We've made metrics generally available. Axiom now stores and queries logs, traces, metrics, and events in one platform.

Metrics are production-ready

Metrics are now generally available. MetricsDB applies the same architecture Axiom already uses for logs, traces, and events: object storage, ephemeral compute, and no active time series limits. Track every container, service instance, and GPU. The cost model doesn't penalize you for it. Ingest is billed per GB, the same model as everything else you send to Axiom, with no active series count to manage.

Metrics integrate fully with dashboards and monitors, and are queryable alongside your logs, traces, and events in one platform.

MPL (Metrics Processing Language) ships alongside the GA release as a public preview feature. It's a pipeline-based, code-first query language built for time-series operations, designed to be readable by humans, composable by AI agents. Metrics are queryable through Axiom MCP server and a dedicated metrics skill from day one.

For more information, see the full announcement.

Multiple metrics queries in dashboards and Canvas

Dashboard charts can now combine multiple metrics queries into a single time series visualization. Each query can be assigned to a primary or secondary y-axis, making it straightforward to overlay metrics with different scales, like request count and p99 latency, on the same chart. The query preview tooltip, explore, and create monitor actions all work with multi-query charts out of the box.

We've also added a new Include zero values option for y-axis scaling. Previously, chart axes always fit to data. Now you can pin the y-axis to zero for a more accurate visual baseline.

Metrics queries are now fully supported in Canvas as well, bringing the same multi-query and visualization capabilities to ad-hoc exploration.

Revamped metrics dataset summary view

The dataset summary page for metrics datasets has been substantially improved. You can now see an ingest usage chart for your metrics dataset with a configurable date range, browse your metrics in a virtualized list with search, filter by metric type using the dropdown, and jump directly into a query for any metric. Metric type icons in the list make it easier to distinguish gauges, counters, histograms, and summaries at a glance.

Faster page loads with persistent caching

Axiom now persists some frequently accessed data. This means that navigating to dashboards, datasets, monitors, and other pages feels snappier. When you refresh the page or return after a short break, Axiom displays cached data immediately and refreshes it in the background if it's stale. This replaces the previous client-side caching with a more comprehensive and reliable approach.

More of our favorite changes

  • Improved scroll behavior and rendering performance in the Stream tab.

week 12 · 2026

Dashboards API

Last week, we introduced the Dashboards API and logical AND/OR operators in the metrics builder.

Dashboards API

The Dashboards API gives you full programmatic control over dashboards in your Axiom organization. Previously, dashboards could only be created and managed through the UI. Now you can build, update, and tear down dashboards as part of automated workflows, infrastructure-as-code pipelines, or multi-tenant setups where each customer or team gets their own dashboard on provisioning.

The API exposes five operations:

AND/OR operators in the metrics builder

The metrics query builder now supports logical and and or filter operators, making it possible to express the same combinations of conditions that MPL already supported at the query level. You can now combine filter conditions more precisely. For example, filtering for spans where both a status code and a service name match, or where either of two conditions holds true.

More of our favorite changes

  • Metrics datasets now show a data usage column in the datasets list, making it easier to see how much data each metrics dataset holds at a glance

week 9 · 2026

Online evaluations for AI engineering

This week we've added support for online evaluations in AI engineering workflows, shipped major upgrades to metrics dashboards and the query canvas, and made API token management significantly easier.

Online evaluations for AI engineering

Previously, evaluations only ran offline against curated test cases with expected outputs. You could catch regressions before deploying, but had no way to continuously score quality once your capability was live.

Online evaluations let you score your AI capability's outputs on live production traffic. Import onlineEval from the Axiom AI SDK and call it inside withSpan. Each evaluation creates OTel spans linked to the originating generation span, so you can trace scores back to the request that produced them.

Because there's no ground truth for live traffic, online evaluations use reference-free scorers that only see input and output. Write boolean scorers for pass/fail checks, numeric scorers for graded scoring, or async LLM-as-judge scorers for deeper quality assessment.

For more information, see the Online evaluation documentation and the blog post.

API token presets

Creating API tokens with the right permissions used to mean toggling individual capabilities one by one. Token presets let you pick a predefined permission set that matches common use cases, then customize from there. This cuts down the time it takes to set up tokens for ingestion, querying, or admin workflows.

GenAI dataset in Playground

We've added a new GenAI dataset in the Playground. This dataset contains a collection of GenAI traces that you can use to explore and understand the GenAI data in Axiom.

You can find the new dataset in:

Placeholder configurator component

The documentation just got smarter. Previously, you had to manually rewrite placeholders such as AXIOM_DOMAIN in code snippets. We've now added a configurator component below code examples that you can use to replace placeholders and copy code that's tailored to your specific environment.

To try it out, open a documentation page with a code example and start replacing placeholders using the configurator component.

Smart features for blog and changelog

We now support RSS feeds for the blog and the changelog. You can subscribe to the feed by clicking the RSS icon in the top right corner of the blog or changelog overview pages.

You can also filter changelog items by labels such as New feature, Improvement, or Bug fix, so you can easily find changes related to a specific feature or bug fix.

See these smart features in action in the blog and changelog overview pages.

More of our favorite changes

  • Added fit-columns-to-width mode for the events table, so data columns fill exactly 100% of the viewport width without horizontal scroll

  • <kbd>Ctrl</kbd>+<kbd>Click</kbd> now works on monitor list rows to open in a new tab

week 8 · 2026

Query metrics skill

This week we've added support for features that allow you to turn your AI coding agents into metrics exploration experts with the Query metrics skill, query your data within its edge deployment, and send your data to non-US edge deployments from Vercel, Cloudflare Logpush, and Netlify.

Query metrics skill for AI agents

The Query metrics skill turns AI coding agents into metrics exploration experts. Install it in Claude Code, Cursor, Amp, Codex, or any compatible agent. Your AI assistant can then discover available metrics, explore tags and tag values, compose and execute queries against Axiom's MetricsDB, and iterate on results, all from natural language prompts like "Query the CPU usage metric from the app.metrics dataset."

Install all Axiom skills at once:

npx skills add axiomhq/skills

For agent-specific setup instructions, see the Query metrics skill documentation.

Edge query

Query results now stay entirely within your selected edge deployment. Previously, queries executed in your edge deployment but results were routed through Axiom's centralized US infrastructure. Now, both query execution and results remain within the same edge deployment where your data is stored. This means event data is ingested, stored, and queried without ever leaving your selected region.

This is especially important for organizations with data-sovereignty requirements. Frameworks that require both storage and processing to take place within a designated region are now fully supported without needing additional transfer mechanisms.

Edge deployment support for Vercel, Cloudflare Logpush, and Netlify integrations

Vercel, Cloudflare Logpush, and Netlify integrations now support all edge deployments. Previously, these integrations only supported the US East 1 (AWS) edge deployment. The integrations now send data to your organization’s default edge deployment automatically, without any additional configuration.

Search results in aggregation tables

You can now use Cmd+F (or Ctrl+F) to search results in aggregation tables, not just event rows. Previously, this key combination triggered the browser native search feature which could fail on virtualized tables.

More of our favorite changes

  • Added checks to make managing capabilities more reliable

week 5 · 2026

User feedback for AI engineering, metrics dashboard generation, and export enhancements

We've released user feedback capture for AI engineering, made it easier to visualize metrics data, and added support for exporting query results in formats that work better with your workflows.

User feedback for AI engineering

You can now capture user feedback on your AI capabilities and link it directly to traces. When a user gives a thumbs up, leaves a comment, or abandons a response, that signal is stored as a timestamped event connected to the exact AI run that produced it. This lets you correlate user perception with system behavior to understand what went wrong and prioritize high-impact improvements.

Axiom AI SDK supports multiple feedback types including thumbs up/down, numeric ratings, boolean responses, free-form text, and implicit signals like copying or regenerating responses. Feedback events are stored in a dedicated dataset and can be analyzed in both the Query tab and the AI engineering tab.

To learn how to capture user feedback, see User feedback.

Dashboard generation for metrics datasets

You can now generate dashboards directly from metrics datasets. Previously, AI-powered dashboard generation only worked with logs and traces datasets. Now, when you select a metrics dataset, Axiom automatically detects the dataset kind and generates appropriate visualizations for your metrics.

The generation process is intelligent about chart selection. It uses heatmaps for latency, duration, and size metrics while choosing time series charts for counters, rates, and gauges. The result is a dashboard that makes sense for your specific metrics without requiring manual configuration.

We've improved the metrics experience in many other ways:

  • Added last aggregation function to the metrics query builder's using clause

  • Fixed heatmap rendering issues

  • Fixed chart options interface

  • Allowed deletion of metrics datasets

  • Improved value formatting to include units

TOON export for query results

Query results can now be exported in TOON format, a structured data format that's more efficient when sharing data with LLMs and other tools. Choose TOON (structured) for hierarchical data or TOON (list) for flat representations, depending on what works best for your use case.

For more information, see Export query.

Seamless APL to query builder translation

Switching between APL and the visual query builder is now seamless. Previously, translating complex APL queries to the builder could fail or produce incomplete results. The new translation engine properly handles filters with nested groups, operator precedence, string operations, summarize clauses, ordering, and limits.

Improved chart rendering

We've fixed several chart rendering issues that affected data visibility and accuracy:

  • Log scale charts: Values of 1 are now properly visible on logarithmic scale charts. Previously, these values appeared nearly invisible due to how the y-axis minimum was calculated.

  • Scatter charts: Fixed a rendering error that occurred when scatter charts had null x-axis data.

  • Heatmap labels: Heatmaps now limit the number of labels displayed to prevent visual clutter.

Canvas supports builder queries

Canvas previously only worked with APL queries. You can now use it with builder queries too, bringing the same powerful visual exploration to your analytics workflows. The canvas automatically validates chart types against your builder configuration and preserves your queries in the URL for easy sharing. Whether you're building complex aggregations or simple filters, Canvas now adapts to your preferred query style.

More of our favorite changes

  • Improved ingestion reliability with smarter retry limits to prevent cascade failures during high load

  • When you copy or download query results as JSON, Axiom now automatically strips null values from the output.

  • Reserved datasets are now protected from accidental editing or deletion

week 51 · 2025

API token filtering and improved traces UI

We've been busy adding support for API token filtering and improving the traces UI.

Filter for finding specific API tokens easily

You can now find specific API tokens more easily. The new token filtering feature lets you filter tokens by name using a search input that appears automatically when you have 10 or more API tokens. Simply type part of a token name to quickly narrow down your list and find the token you're looking for. This makes managing large numbers of tokens much more efficient, especially for organizations with many API tokens for different services or environments.

Improved traces UI

The traces interface has received a design update, making it easier to navigate and understand your trace data. The updated UI provides better visual hierarchy, clearer span relationships, and improved navigation between related traces and logs.

week 51 · 2025

Generative AI functions

Analyzing generative AI (GenAI) conversation data in your logs just got easier. Previously, extracting insights from AI conversation logs required complex queries to parse message structures, calculate token costs, and filter conversations by role or content.

We’ve added a comprehensive set of GenAI functions to APL that simplify working with conversation data from large language models and AI systems. These functions help you extract specific information like user prompts, assistant responses, and system prompts, calculate token costs and usage metrics, analyze conversation structure and flow, and detect truncation or tool calls in responses.

Function

Description

genai_concat_contents

Concatenates message contents from a conversation array

genai_conversation_turns

Counts the number of conversation turns

genai_cost

Calculates the total cost for input and output tokens

genai_estimate_tokens

Estimates the number of tokens in a text string

genai_extract_assistant_response

Extracts the assistant’s response from a conversation

genai_extract_function_results

Extracts function call results from messages

genai_extract_system_prompt

Extracts the system prompt from a conversation

genai_extract_tool_calls

Extracts tool calls from messages

genai_extract_user_prompt

Extracts the user prompt from a conversation

genai_get_content_by_index

Gets message content by index position

genai_get_content_by_role

Gets message content by role

genai_get_pricing

Gets pricing information for a specific model

genai_get_role

Gets the role of a message at a specific index

genai_has_tool_calls

Checks if messages contain tool calls

genai_input_cost

Calculates the cost for input tokens

genai_is_truncated

Checks if a response was truncated

genai_message_roles

Extracts all message roles from a conversation

genai_output_cost

Calculates the cost for output tokens

For more information, see the blog or the documentation.

More of our favorite changes

  • Added snow mode toggle to the theme selector for a festive winter interface

  • Added tooltip to Stream tab for metrics datasets to provide helpful context

week 49 · 2025

Evals for AI engineering

We’ve added support for offline evaluations (evals) in the AI engineering workflow and improved alerting for data availability this week. These updates allow you to evaluate AI capabilities and stay informed when your data starts flowing again.

Offline evals for AI engineering

Evals are systematic tests that measure how well your AI features perform by automatically running your AI code against test collections and evaluating the results using custom scorers.

Instead of manually testing AI outputs or relying on anecdotal checks, evals provide a data-driven approach to:

  • Catch regressions before they reach production

  • Compare different models, prompts, or approaches

  • Track quality improvements over time

  • Ensure capabilities meet your quality benchmarks

The evaluation framework uses a declarative Eval function that lets you define test suites directly in your codebase with ground truth data, scoring functions, and configurable flags for experimentation. The Axiom AI SDK captures detailed OpenTelemetry traces for each evaluation run, allowing you to analyze results in depth.

See the blog post or learn more about setting up and running evals in the documentation.

Alerts when data returns after no-data state

Monitors with Alert on no data enabled now send notifications when data returns after a no-data alert state. Previously, you only received alerts when data stopped flowing, but not when it resumed. Now you get notified both when data disappears and when it comes back, giving you complete visibility into your data availability.

More of our favorite changes

  • Improved bar chart hover interactions and visual feedback

  • Improved ability to save views even when there are no events in the selected time range

  • Enhanced authentication error handling for better user experience

week 48 · 2025

Unified edge deployment architecture

We’re excited to introduce a foundational capability that expands how you can use Axiom: a unified edge deployment architecture.

Unified edge deployment architecture

Axiom now uses a unified edge deployment architecture that gives you more control over where your event data is stored while maintaining a single, unified management experience. When you create an organization, you choose a primary edge deployment like US East 1 (AWS) or EU West 1 (AWS), and your event data is stored at rest in that infrastructure.

This unified model provides flexibility that wasn’t possible with separate regional instances. You manage everything through Axiom’s Console at app.axiom.co regardless of which edge deployment you select, eliminating the need to juggle multiple accounts or endpoints. As Axiom introduces additional edge deployments, you’ll be able to write event data to specific locations with ease while maintaining unified management and billing.

Currently, when you select a non-US edge deployment, your event data is ingested and stored in your selected edge deployment, and queries execute in that same edge deployment. Query results are routed through US infrastructure, but your event data remains stored in your chosen edge deployment. Axiom is working toward complete within-edge query processing, where the entire operation (from query execution to results) will happen entirely within your selected edge deployment.

This architecture is particularly valuable if you need to meet data sovereignty requirements or prefer to keep your data closer to your operations. For more information, see Edge deployments.

Smarter dashboard refreshing

Charts now only refresh when their configured interval has elapsed, not every time you switch back to a dashboard tab. This prevents unnecessary network calls and makes dashboards more responsive, especially when you have many charts configured with different refresh intervals.

Enhanced Spotlight interactions

Spotlight insight charts are now more interactive and reliable. You can click directly on chart elements to access context menus, making it faster to explore your data. We’ve also fixed chart overlap issues and improved how nested fields are handled, ensuring Spotlight queries run more efficiently and display correctly.

These improvements make Spotlight feel more responsive and reduce visual glitches when working with complex nested data structures.

More of our favorite changes

  • Enhanced toast notifications to remain interactive when dialogs are open

  • Improved trace panel performance for faster loading

  • Improved dataset sorting by ownership and sharing organization

week 46 · 2025

Metrics builder and better parsing of GenAI attributes

This week was a big one for Axiom! We introduced support for OpenTelemetry metrics. In other news, we improved parsing of GenAI attributes in OpenTelemetry traces and improved the user interface for several other features.

Metrics

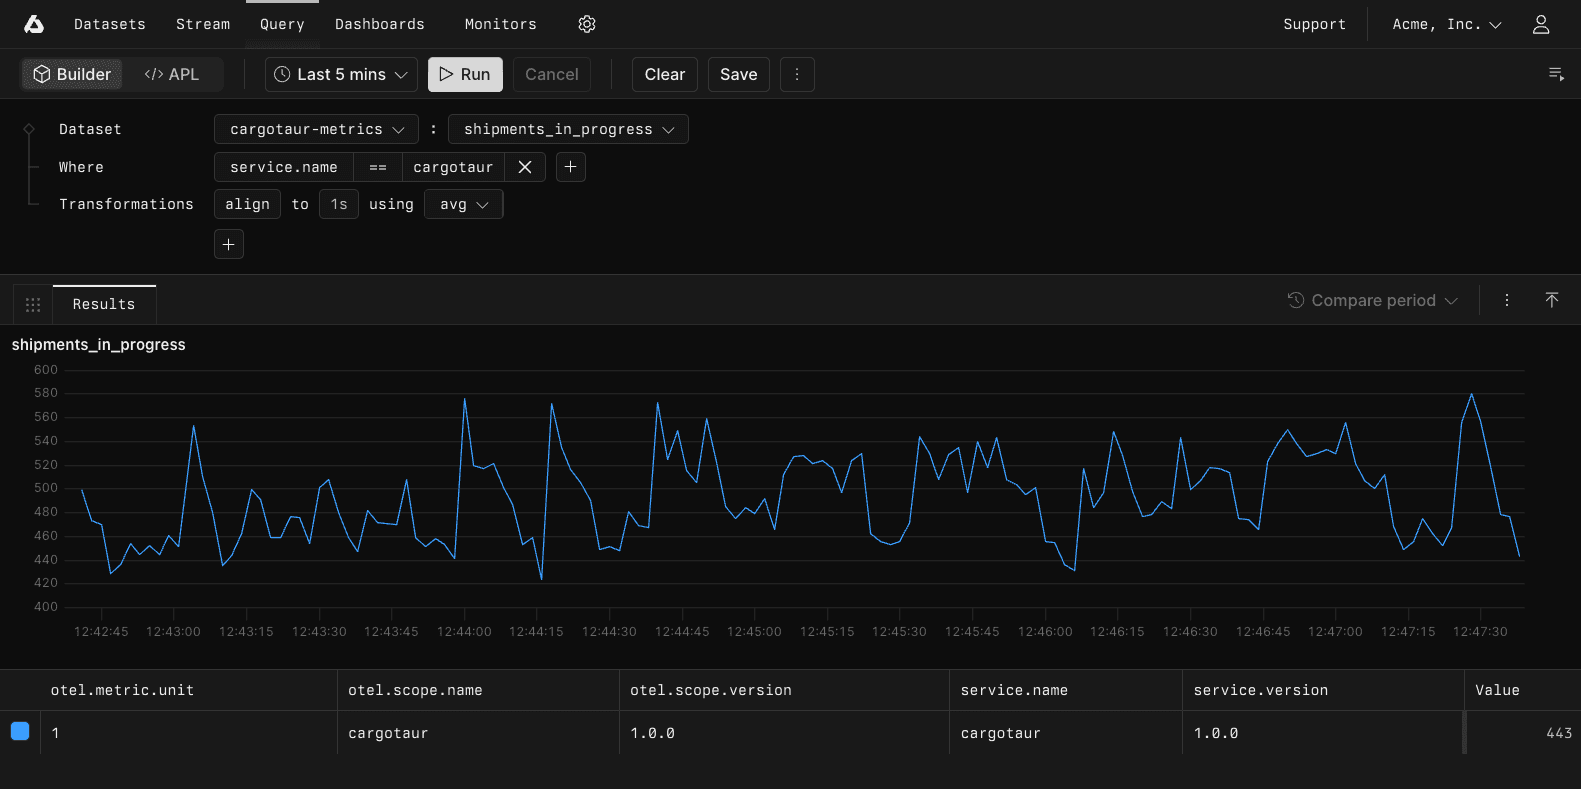
Axiom introduces support for OpenTelemetry metrics through a powerful visual query builder. The new interface provides an intuitive way to filter, transform, and aggregate metrics.

What's new

The metrics query builder in the Console lets you:

  • Select the data source in a familiar visual interface: Choose your dataset and metric in the Builder, similarly to how you would query logs and traces.

  • Filter by tags: Use the Where section to filter series based on tag values with familiar operators.

  • Transform data: Apply transformations like rate calculations, interpolation, and value filling to prepare your data for analysis.

  • Aggregate over time: Use the align transformation to aggregate metrics into time windows.

  • Group by dimensions: Combine series by tags using the group transformation to analyze metrics across different dimensions.

Build your first query

To get started:

  1. Ingest metrics data to Axiom using the OpenTelemetry Collector.

  2. Go to the Query tab and click Builder.

  3. Select your OTel metrics dataset and the metric you want to query.

  4. Add filters in the Where section to focus on specific series.

  5. Apply transformations to calculate rates, aggregate over time, or group by tags.

  6. Click Run to see your results.

The builder supports all the core operations you need for metrics analysis, from simple filtering to complex aggregations. Whether you're tracking request rates, analyzing latency distributions, or monitoring system health, the visual interface makes it straightforward to extract insights from your metrics data.

Example query and results

Example query and results

For more information, see the blog and the documentation.

Better parsing of GenAI attributes

OpenTelemetry GenAI attributes are now handled more intelligently. Previously, attributes with JSON content were represented as strings. These attributes are now parsed and represented as array types. This allows for a better structure and queryable format.

For example, gen_ai.input.messages and gen_ai.output.messages are now parsed as arrays:

{
    "gen_ai.input.messages": [{"role": "user", "content": "What is the weather?"}],
    "gen_ai.output.messages": [{"role": "assistant", "content": "I need more information about your location."}]
}

This makes it easier to query and analyze message history directly in your traces.

If you're monitoring LLM applications or AI workloads, you'll see richer detail in your traces without any changes to your instrumentation. For more information on observability for AI apps, see the documentation.

RBAC permission enforcement

RBAC permission enforcement has been strengthened for some endpoints. Custom roles now require explicit read permissions to access billing info, datasets fields schemas, and field information. If you have custom roles that previously accessed these endpoints without read permissions, update the role configuration to grant read access. Axiom's built-in roles already include appropriate permissions and aren't affected by this change.

More of our favorite changes

  • Improved side panel behavior in dataset settings.

week 45 · 2025

Enhanced view access controls and more reliable PagerDuty incident resolution

We’ve been busy making Axiom more flexible and intuitive. Last week’s updates focused on removing barriers to data exploration, improving view access controls, and more reliable API interactions.

Enhanced view access controls

Views now work correctly for users who have been granted access to specific views but don’t have broader dataset permissions. Previously, you might encounter issues when trying to use views without underlying dataset access. The system now properly recognizes view-specific permissions and ensures that trace links and field metadata work correctly within view results.

This improvement makes view-based access control more practical for teams that need to share specific data slices without exposing entire datasets.

More reliable PagerDuty incident resolution

Several issues with PagerDuty integration have been fixed that were preventing incidents from resolving correctly. When monitors detected that issues were cleared, PagerDuty incidents weren’t always being updated or resolved as expected.

These fixes ensure that the full lifecycle of your incidents—from creation to resolution—flows reliably between Axiom monitors and PagerDuty. Your on-call workflows should now work more smoothly, with incidents opening and closing as they should.

AI-assisted queries without specifying a dataset

You can now generate queries using AI without specifying a dataset upfront. When you start a query, Axiom’s AI assistant intelligently determines the appropriate dataset based on your natural language question. If your question doesn’t map to a specific dataset, the assistant generates generic APL patterns that work across your data.

This makes exploratory analysis faster and more intuitive, especially when you’re not sure which dataset contains the information you need or when you’re writing queries that could apply to multiple datasets.

Updated subprocessors

We’ve updated our list of subprocessors to include Vercel and PlanetScale as infrastructure providers, and we’ve removed Koala. Vercel supports Console deployment infrastructure, and PlanetScale handles app configuration—your event data continues to be stored and processed exclusively in Axiom’s core data platform. These additions support our platform’s reliability and scalability.

Review our complete and up-to-date list of subprocessors.

More of our favorite changes

  • Improved icon rendering performance to prevent layout shifts

  • Enhanced query alignment resolution before submission

  • Better default aggregation handling with required group by operations

week 43 · 2025

Richer audit log context

Audit logs now give you a clearer picture of what’s happening across your organization.

Richer context in audit logs

Audit logs now capture significantly more context about how your team interacts with Axiom. When you review audit logs, you’ll see privacy-safe representations of the queries being run, making it easier to understand what’s happening across your organization without exposing sensitive data in query strings.

Audit logs now also track the source of each query—including which monitor triggered it—so you can trace query activity back to its origin. This is particularly useful when debugging performance issues or understanding which monitors are generating the most query load. Dashboard tracking is coming soon to provide even more visibility.

Query cost tracking and storage usage are now included in audit logs, giving you better visibility into resource consumption patterns. This helps you identify expensive queries, optimize performance, and understand how different teams use their query and storage budgets.

These enhancements make audit logs more actionable for governance, debugging, and cost optimization workflows.

Monitor high-cost queries

With query cost tracking now available in audit logs, you can set up monitors to alert you when expensive queries run. Here’s an APL example that identifies queries exceeding your cost threshold of 1000 query units:

['axiom-audit']
| where action == 'runAPLQueryCost'
| where ['properties.query_cost_gbms'] > 1000

Use this query as a monitor to get notified when expensive queries run. You can adjust the query_cost_gbms threshold based on your organization’s usage patterns and budget.

Check out the audit logs documentation for more details.

Additional improvements

  • Fixed OpenTelemetry span handling.

  • Improved dataset handling during subscription updates.

  • Fixed spend limit notification logic to ensure alerts are sent correctly.

week 40 · 2025

Query improvements and trace enhancements

Query improvements and trace enhancements

We were busy refining the core query experience last week, making it faster and more intuitive to explore your data. These updates focus on streamlining workflows that you use every day, from field selection to trace correlation.

Enhanced query field interactions

Working with fields in the query builder is now more intuitive. Previously, when you viewed the query results and clicked a field name in the sidebar, Axiom opened unique values. You can now select fields by clicking field names, and clicking the number on the right of a field name displays the unique values. This makes building queries faster and reduces unnecessary clicks when you’re exploring your data.

Smarter trace correlation across datasets

Trace linking just got smarter. Previously, you could only correlate logs and traces when the trace ID was stored in the trace_id field. Now, Axiom automatically detects trace IDs in any field containing trace in its name, whether that’s attributes.trace_id, custom_trace_id, or any other variation.

This enhancement makes it much easier to correlate between your logging and tracing datasets, especially if you’re using custom field naming conventions or migrating from other observability platforms.

Support for new versions of OpenTelemetry semantic conventions

We have added support for versions 1.36 and 1.37 of OpenTelemetry semantic conventions. These versions introduce updated attribute names for AI operations. Your existing traces continue to work seamlessly, while new traces benefit from the latest standards for tracking AI prompt inputs and completion outputs.

This ensures you’re getting the most accurate and standardized view of your generative AI workloads.

Adding support for new versions of OpenTelemetry semantic conventions means that the shape of your data can change. For more information, see Semantic conventions.

Enhanced data ingestion safeguards

We’ve strengthened data ingestion with better handling of edge cases and invalid data. Axiom now automatically sanitizes problematic data during ingestion to ensure your datasets remain clean and queryable.

When you ingest data that exceeds our limits, Axiom now handles it gracefully by replacing oversized strings with clear indicators, converting invalid float values like NaN and infinity to null, and preventing deeply nested structures from breaking your queries. We’ve also improved how reserved field names are handled — if you accidentally use internal field names like _sysTime, Axiom automatically renames them with a _user_ prefix to avoid conflicts.

These improvements mean more reliable data ingestion and fewer surprises when exploring your datasets, especially when working with diverse data sources or migrating from other platforms. For more information, see Limits on ingested data.

More of our favorite changes

  • Enhanced help text for data trimming operations

  • Better date parsing that now correctly handles formats like 25/09/2025, 19:15

  • Improved chart options menu with better organization and visual hierarchy

  • Fixed query field pagination to prevent infinite loading loops

  • Better modal context handling for chart editing interfaces

  • Fixed chart options editing interface that was previously inaccessible in some scenarios

  • Resolved issue where query builder menus could be hidden behind other interface elements

  • Fixed alignment issues in section bar actions across the dashboard

  • Improved error handling for date parsing edge cases

week 25 · 2025

Improved JSON ingestion flexibility

Improved JSON ingestion flexibility

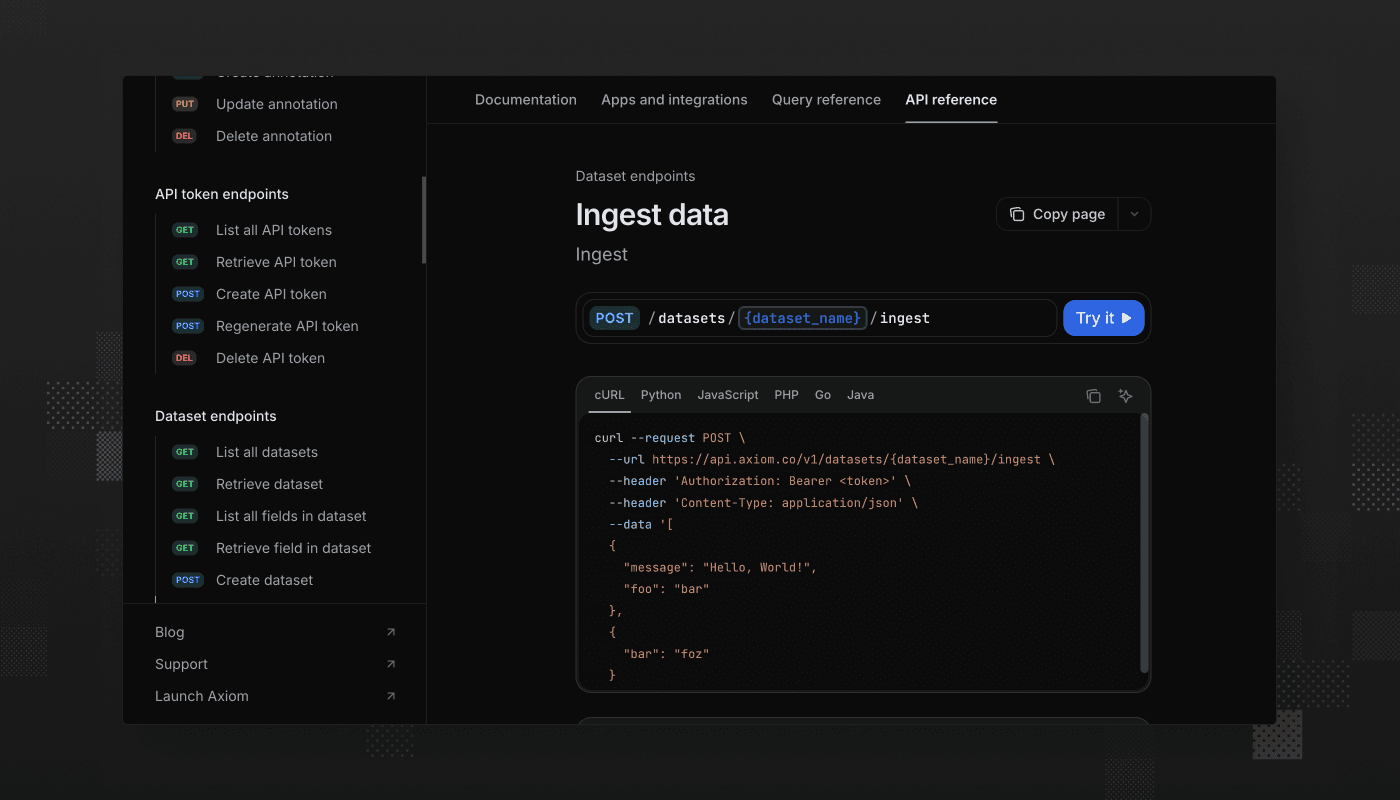
The ingest endpoint just got smarter. We’ve expanded support for the Content-Type: application/json header, so it now accepts both JSON arrays and newline-delimited JSON (NDJSON).

This improvement solves a common pain point for teams working with third-party tools or SDKs that don’t allow customizing the Content-Type header. Previously, sending NDJSON required setting application/x-ndjson, which wasn’t always feasible. Now, Axiom accepts NDJSON even when the header is set to application/json, making integrations simpler and more forgiving.

Whether you’re piping logs from a custom client or wiring up a webhook, your data gets where it needs to go, no header gymnastics required.

Try it out today or read more in the documentation.

week 23 · 2025

Updated Datasets tab UI and map field configuration

Updated Datasets tab UI and map field configuration

We’ve redesigned the Dataset tab to make exploring your data faster, cleaner, and more intuitive—and added powerful new controls for configuring map fields.

In observability, clarity matters. Our updated UI helps you navigate fields with confidence, spotlight insights with quick charts, and zero in on what you need, whether that’s a saved query or a deeply nested virtual field. Every pixel of the Dataset tab now works harder to give you better visibility into your data.

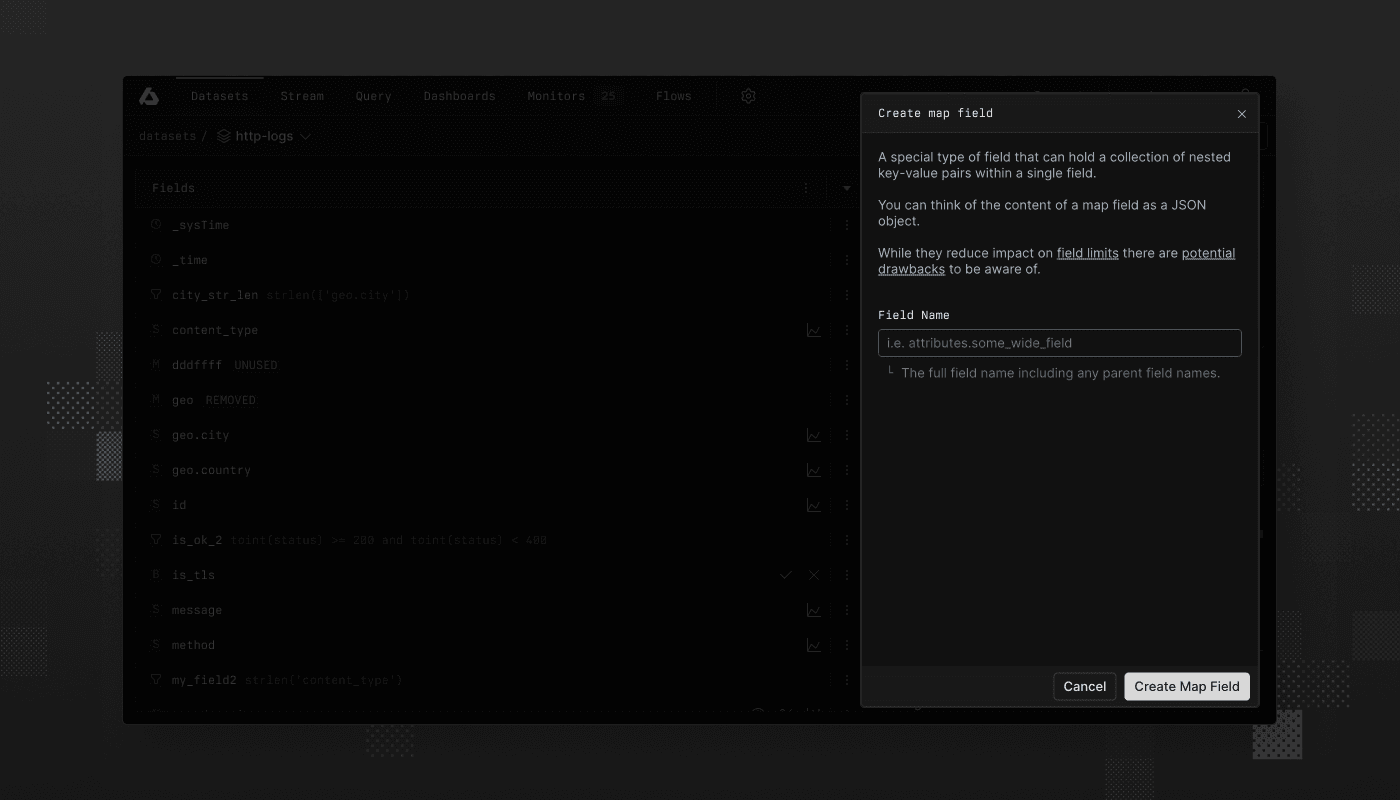
The upgrade doesn’t stop at the surface. You can now fully manage map fields (those handy, JSON-style key-value collections) directly from the UI. View removed or unused map keys, inspect nested data with ease, and maintain schema hygiene without diving into raw payloads.

We also smoothed out interactions across the board:

  • Cleaner field lists

  • Faster access to saved queries and history

  • Streamlined editing of field descriptions and units

The result? Less time spelunking, more time analyzing.

Check out the details of the new Dataset tab and the map field configuration feature in the documentation.

week 4 · 2025

Resizeable span details pane

Resizeable span details pane

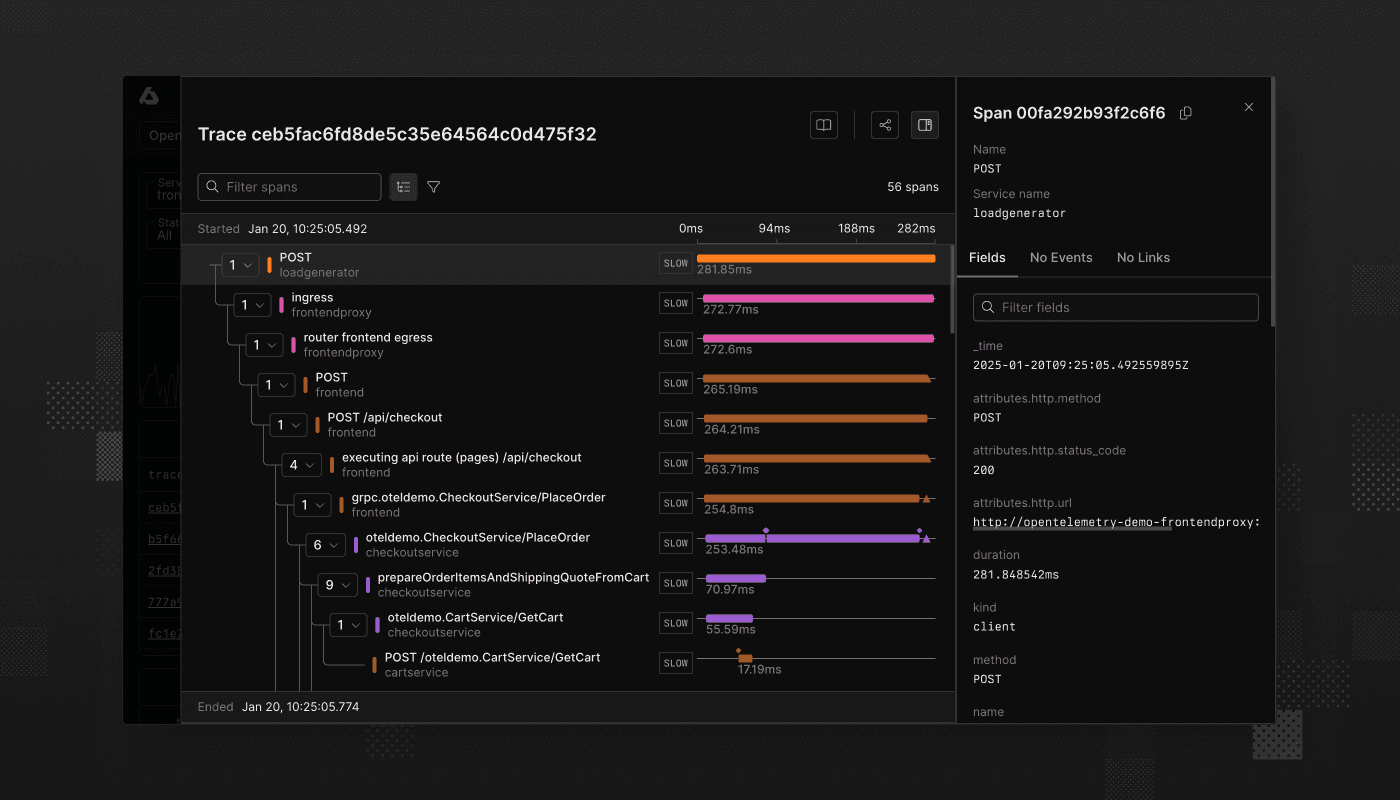
We’re happy to announce that you can now resize the span details view. Previously, the size of the span details view was fixed. This meant that for large traces, you could not easily look at the waterfall view of traces and the span details at the same time. You can now resize the view to your needs and easily cross-reference information between the waterfall view and the span details view.

For more information, see the documentation.

week 43 · 2024

Changes to the Vector collector

Changes to the Vector collector

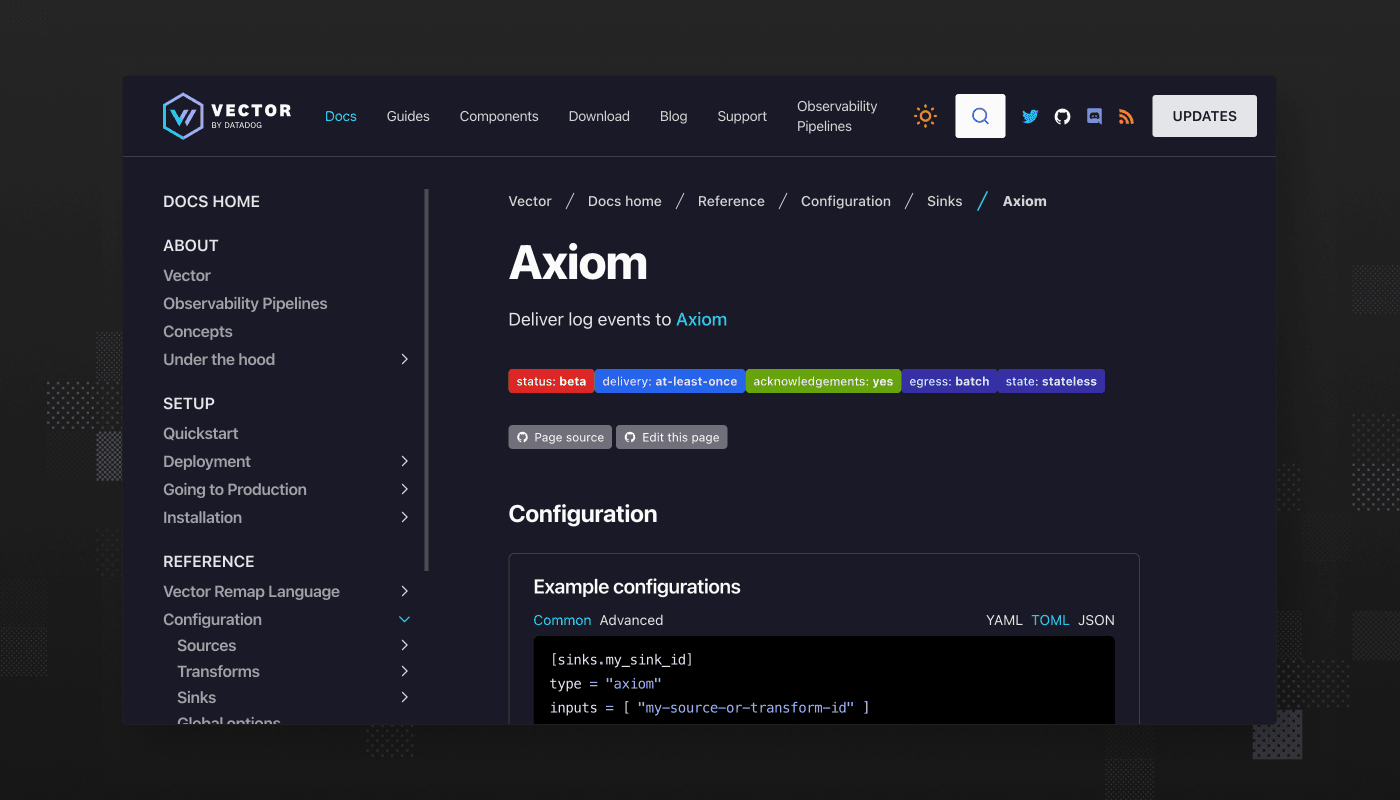
We’re happy to announce that you can now use the _time field with the Vector collector version v0.42.0 or newer.

Before Vector version v0.42.0, the Axiom sink was based on an Elasticsearch endpoint. This constrained Axiom to the Elasticsearch wire semantics. When you sent data to Axiom, you had to specify the timestamp in the @timestamp field.

Starting with Vector version v0.42.0, the Axiom sink uses the native Axiom ingest endpoint. This means that you can specify the timestamp in the _time field as usual.

For more information, see the documentation.

week 38 · 2024

Chart creation improvements

Chart creation improvements

Creating charts in Axiom has become even easier. We’re excited to announce two improvements to the chart creation process.

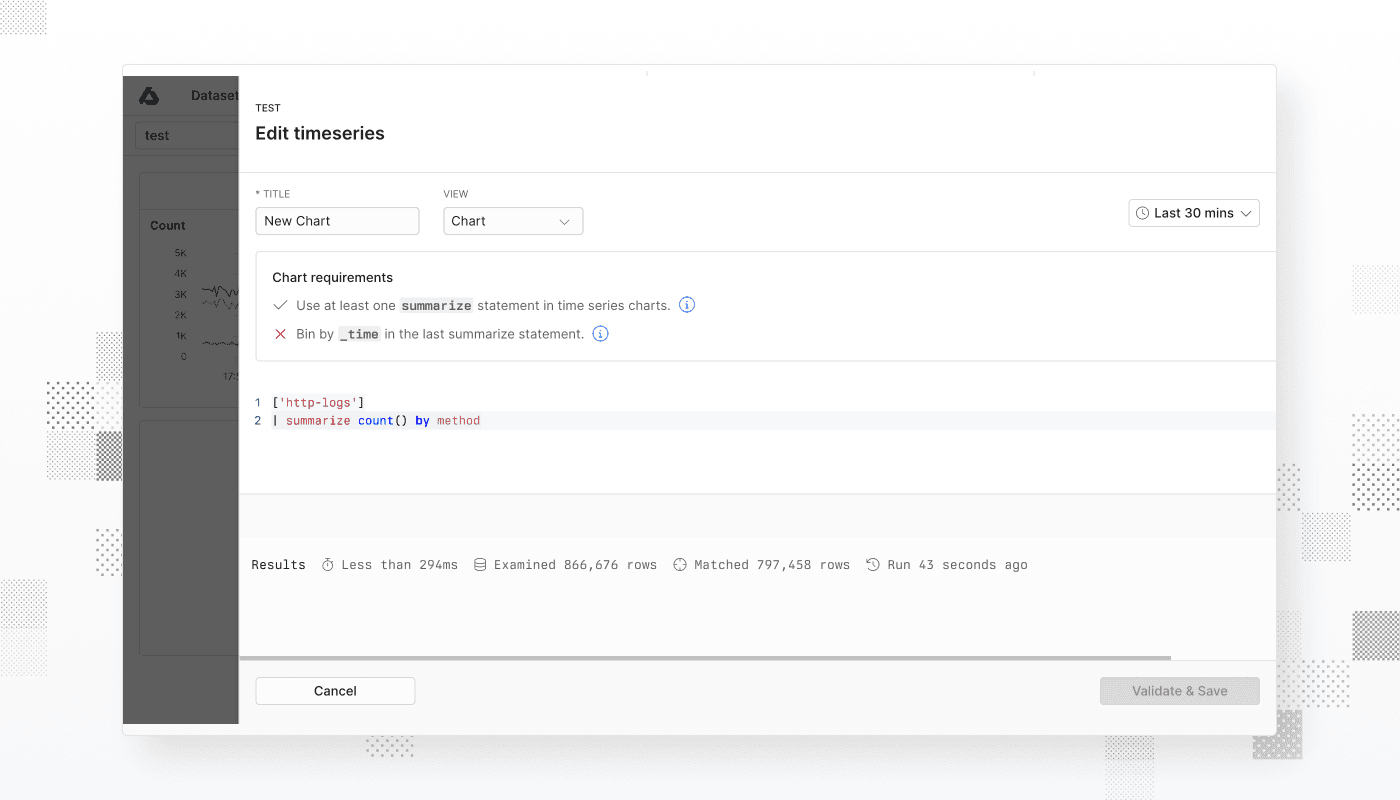
Chart creation now includes input validation and in-app education. This assistive feature informs you about the requirements for the type of chart you’re creating, validates your input in real time, and educates you on how to build a query that matches those requirements. Input validation is available for both the visual and the APL query builder.

We have also streamlined the chart creation process to make it more intuitive. Now the first step is to choose the type of chart that you want to create, followed by a chart creation interface tailored to that chart type.

week 38 · 2024

Results table and event panel improvements

Results table and event panel improvements

We’re excited to announce major improvements to the results table and the event panel.

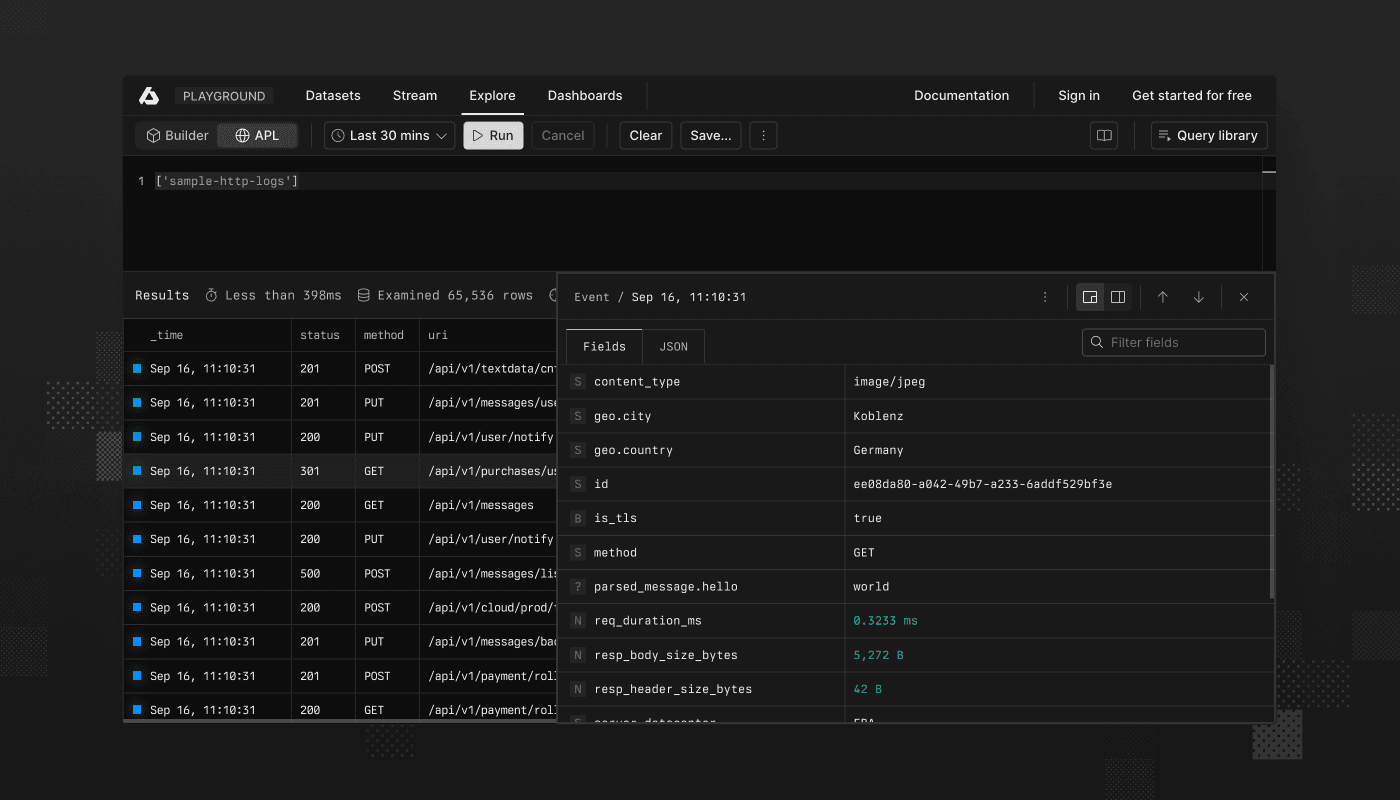
In the results table, you can switch between raw data and column modes. The raw data mode displays the raw event data and highlights the fields you select. The column mode displays each selected field in a different column and doesn’t show the raw event data. In column mode, you can resize the width of columns by dragging the borders.

In the event panel, you can navigate between events by clicking the Navigate up or Navigate down buttons. You can also change the height of the event panel to fit the viewport height or the height of the results table.

For more information, see the Query results in the documentation.

week 30 · 2024

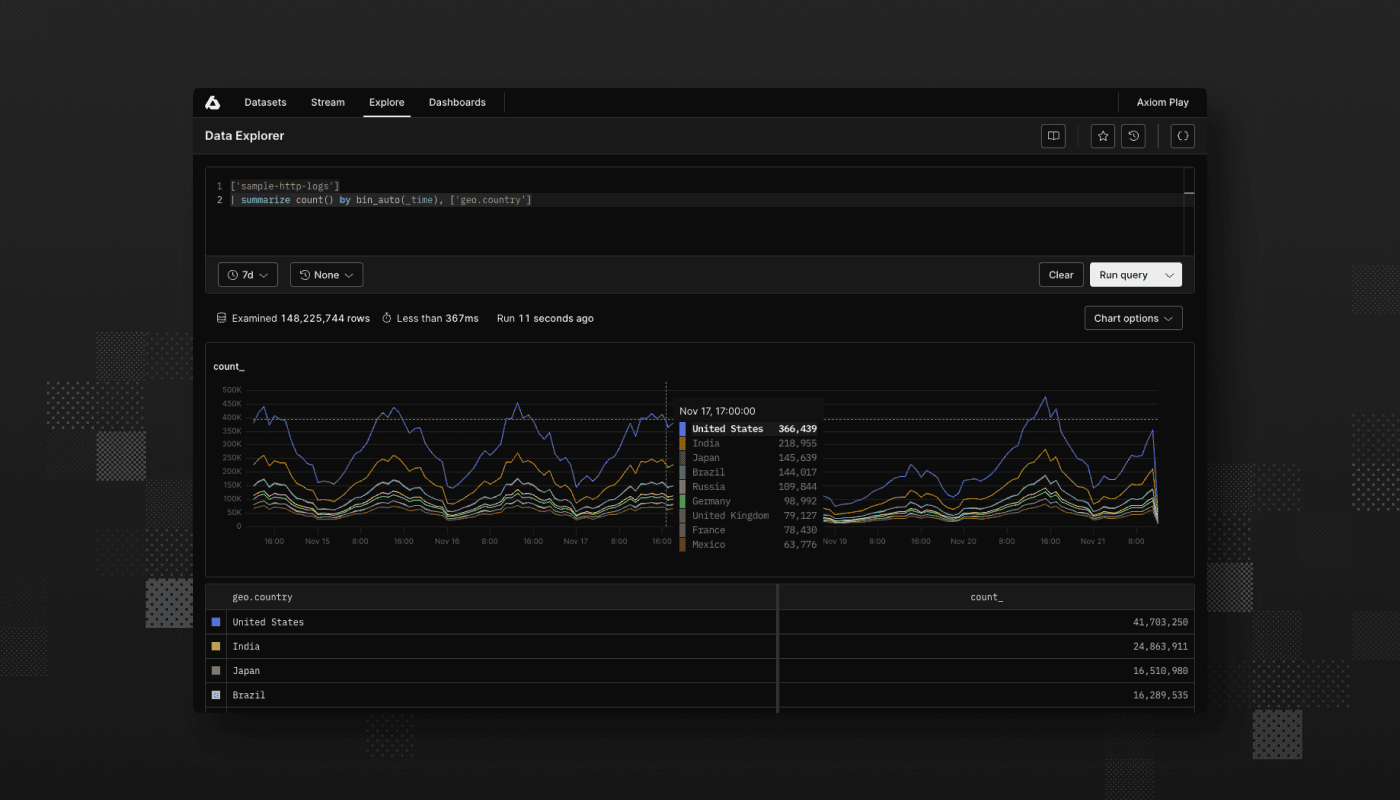
Unified query builder experience in the Explore tab

Unified query builder experience in the Explore tab

Axiom introduces a unified query builder experience in the Explore tab.

  • A new toolbar has been added that provides you with all the tools to build your queries.

  • The toolbar contains the buttons you could previously find dispersed in different parts of the UI: the time range selector, the button to run your query, and many more.

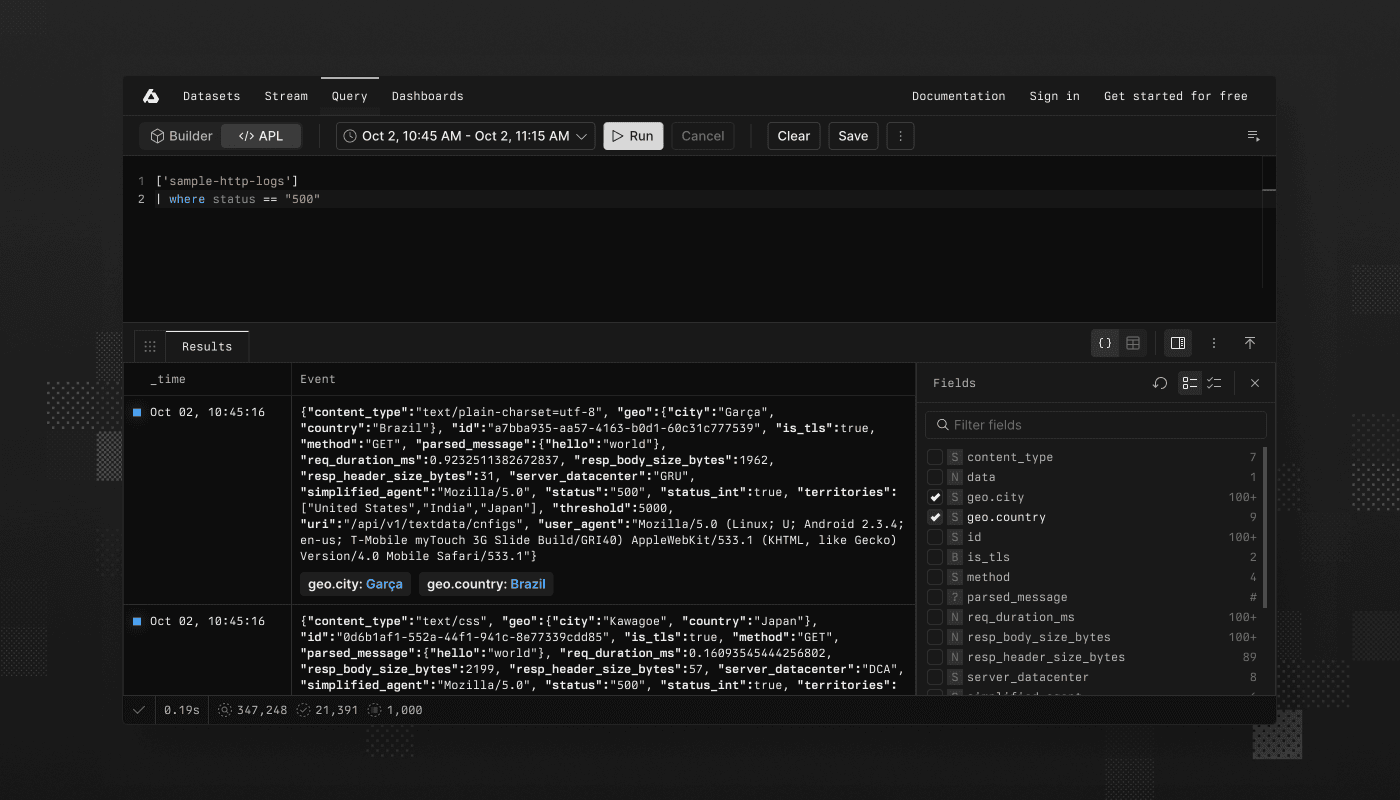
  • Previously, you could only build queries using a visual tool in the Datasets tab or using APL in the Explore tab. Now you can build queries both ways in a single place, the Explore tab. All you need to do is select Builder in the toolbar for a visual query builder experience, and APL to structure queries using Axiom’s piped processing language.

These important updates are part of wider changes that we plan to release soon to improve your query experience.

week 30 · 2024

Improvements to the search operator

Improvements to the search operator

A year ago, Axiom introduced the search operator to APL to let you explore your data in an unstructured way. While useful, it had limitations in handling complex data types and numbers.

Previously, you could only search for string values. Axiom now significantly expands the search operatorʻs capabilities:

  • You can search for numbers. For example, search for a numeric customer ID directly.

  • You can search inside complex data types such as maps and arrays.

The has and contains operators power the search operator and also receive these capabilities.

These improvements make it easier to dig deep into your datasets and find the information you need quickly, whether in casual exploration, deep investigation, or advanced monitor and dashboard setups.

Try out the enhanced search capabilities today and experience faster, more comprehensive data exploration. For more details on using the improved search operator, see the documentation.

week 10 · 2024

Field vacuuming and other improvements

Field vacuuming and other improvements

Axiom adds support for field vacuuming and other improvements.

Field vacuuming wipes all fields and rebuilds the schema on the next event Axiom receives. This can be useful if the number of fields in a dataset exceeds the allowed limits defined by your pricing plan.

To learn more about vacuuming fields, see the documentation.

This release adds the following further improvements:

  • Adds the possiblity to set a dashboard as your default starting page in the Axiom app.

  • Adds support for searching for datasets in the Datasets, Stream, and Explore tabs.

Breaking changes to Splunk endpoint

This update changes how events received by the Splunk endpoints are stored in Axiom in the following ways:

  • Renames the message field to _raw: This adjustment aligns with common data handling practices and improves the intuitiveness of data analysis.

  • Includes the fields object in requests: Requests to the Splunk endpoint include the fields object to provide more comprehensive data capture.

Action required

If you use saved queries, dashboards or monitors for datasets associated with a Splunk endpoint, make the following changes on March 11th, 2024:

  • Rename the message field to _raw in the affected queries.

  • Ensure new fields do not collide with existing aliases or virtual fields.

week 7 · 2024

Microsoft Teams notifier

Microsoft Teams notifier

Axiom lets you set up a notifier with Microsoft Teams and adds other improvements to notifiers.

The new notifier lets you integrate your monitors with Microsoft Teams. When a monitor triggers, you now have the option to send a notification to your organization’s Microsoft Teams instance.

This release adds the following further improvements to notifiers:

  • Adds a Test button to the right of each notifier in the list of notifiers. Clicking this button triggers the notifier for a single test run. Use this feature to ensure a notifier works as intended.

  • Adds the possibility to manage notifiers from the list of monitors. Previously, if you started creating a monitor but realised you hadn't created the notifier, you had to leave the monitor creation process. After this update, you can create notifiers without leaving this page.

To explore the new notifier features, go to your Axiom account.

week 1 · 2024

Span duration histogram and other improvements to tracing

Span duration histogram and other improvements to tracing

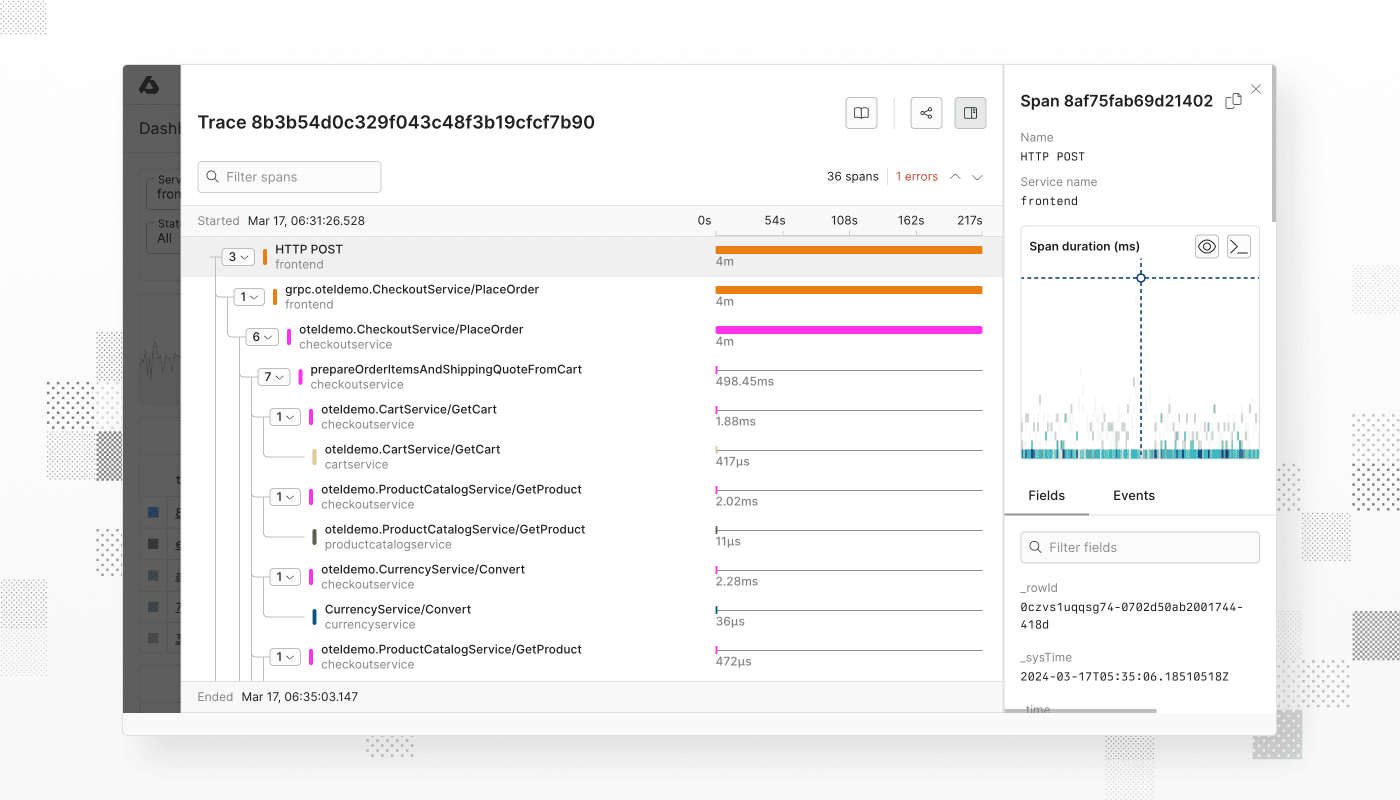
Axiom adds a span duration histogram and other improvements to tracing.

The span duration histogram gives you a quick overview about the duration of individual spans within a trace. This histogram appears to the right of the waterfall view of traces. The span duration histogram can be useful in the following cases, among others:

  • You look at a trace or an individual span and you only know its duration. There is no obvious error. You want to know if you are looking at something normal in terms of duration, or an outlier. The histogram helps you determine if you are looking at an outlier and might drill down further.

  • You've found an outlier. You want to investigate and look at other outliers. The histogram shows you what the baseline is and what is not normal in terms of duration. You want to filter for the outliers and see what they have in common.

This release further improves tracing in the following ways:

  • Adds support for deep linking to individual span inside a trace.

  • Adds support for expanding multiple span events.

  • Adds support to export traces in Axiom and Jaeger format.

  • Improves the design of the trace waterfall view. With tighter data density, you can scan more spans efficiently.

  • Improves the background contrast on span hover and click for readability.

  • Changes search across spans so that it is now case insensitive.

  • Fixes an issue where missing spans were duplicated if they had multiple children.

  • Fixes an issue where child spans were displayed larger than their parent span due to rounding.

In addition, this release fixes an issue where the Grafana data source plugin couldn't query data from Axiom.

To explore the new tracing features such as the span duration histogram, go to the Axiom Playground and click a trace in the list.

week 47 · 2023

Refreshed theming and compact interface

Refreshed theming and compact interface

We are excited to announce the latest updates to Axiom’s user interface, making it more user-friendly and accessible than ever before. With a consistent design across the platform, this release focuses on enhancing visual clarity and improving user experience. Here’s what’s new:

  • Compact UI: We've refined the interface for a cleaner look and enhanced data density, meaning you can see more on your screen without sacrificing readability.

  • Improved contrast: Upgraded theming tokens for better visibility in light and dark modes.

week 13 · 2023

Enhanced documentation navigation

Enhanced documentation navigation

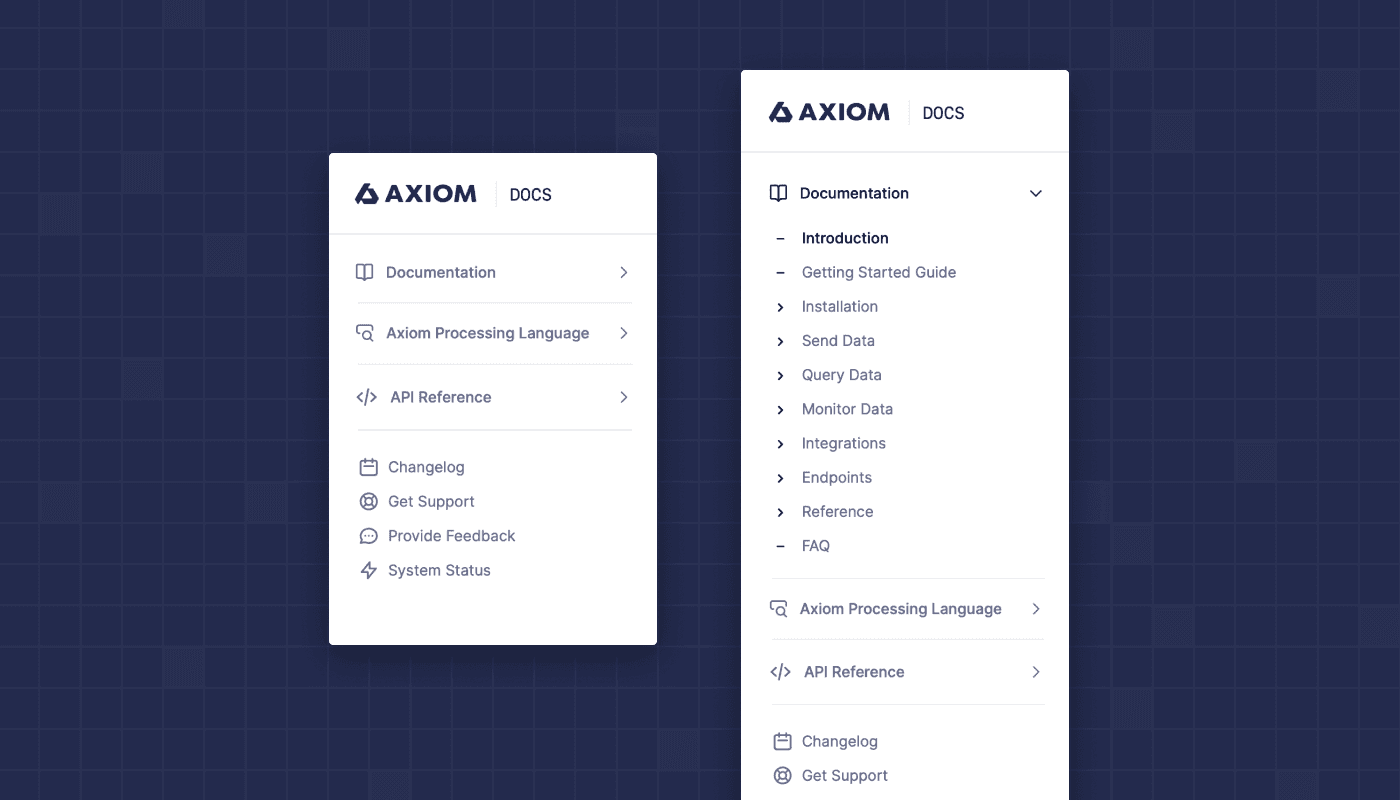
We recently analyzed comments from new users and existing customers about our product documentation. We carefully considered the feedback, then used it to improve navigation in our help system.

These changes have just landed! This is a significant improvement to our document navigation making it even easier for you to find the information you need.

It’s not the end of the road though, we have more work to do, which will land shortly. We welcome your ongoing thoughts on this update in our Discord Community.

week 22 · 2022

New topk Implementation

New topk Implementation

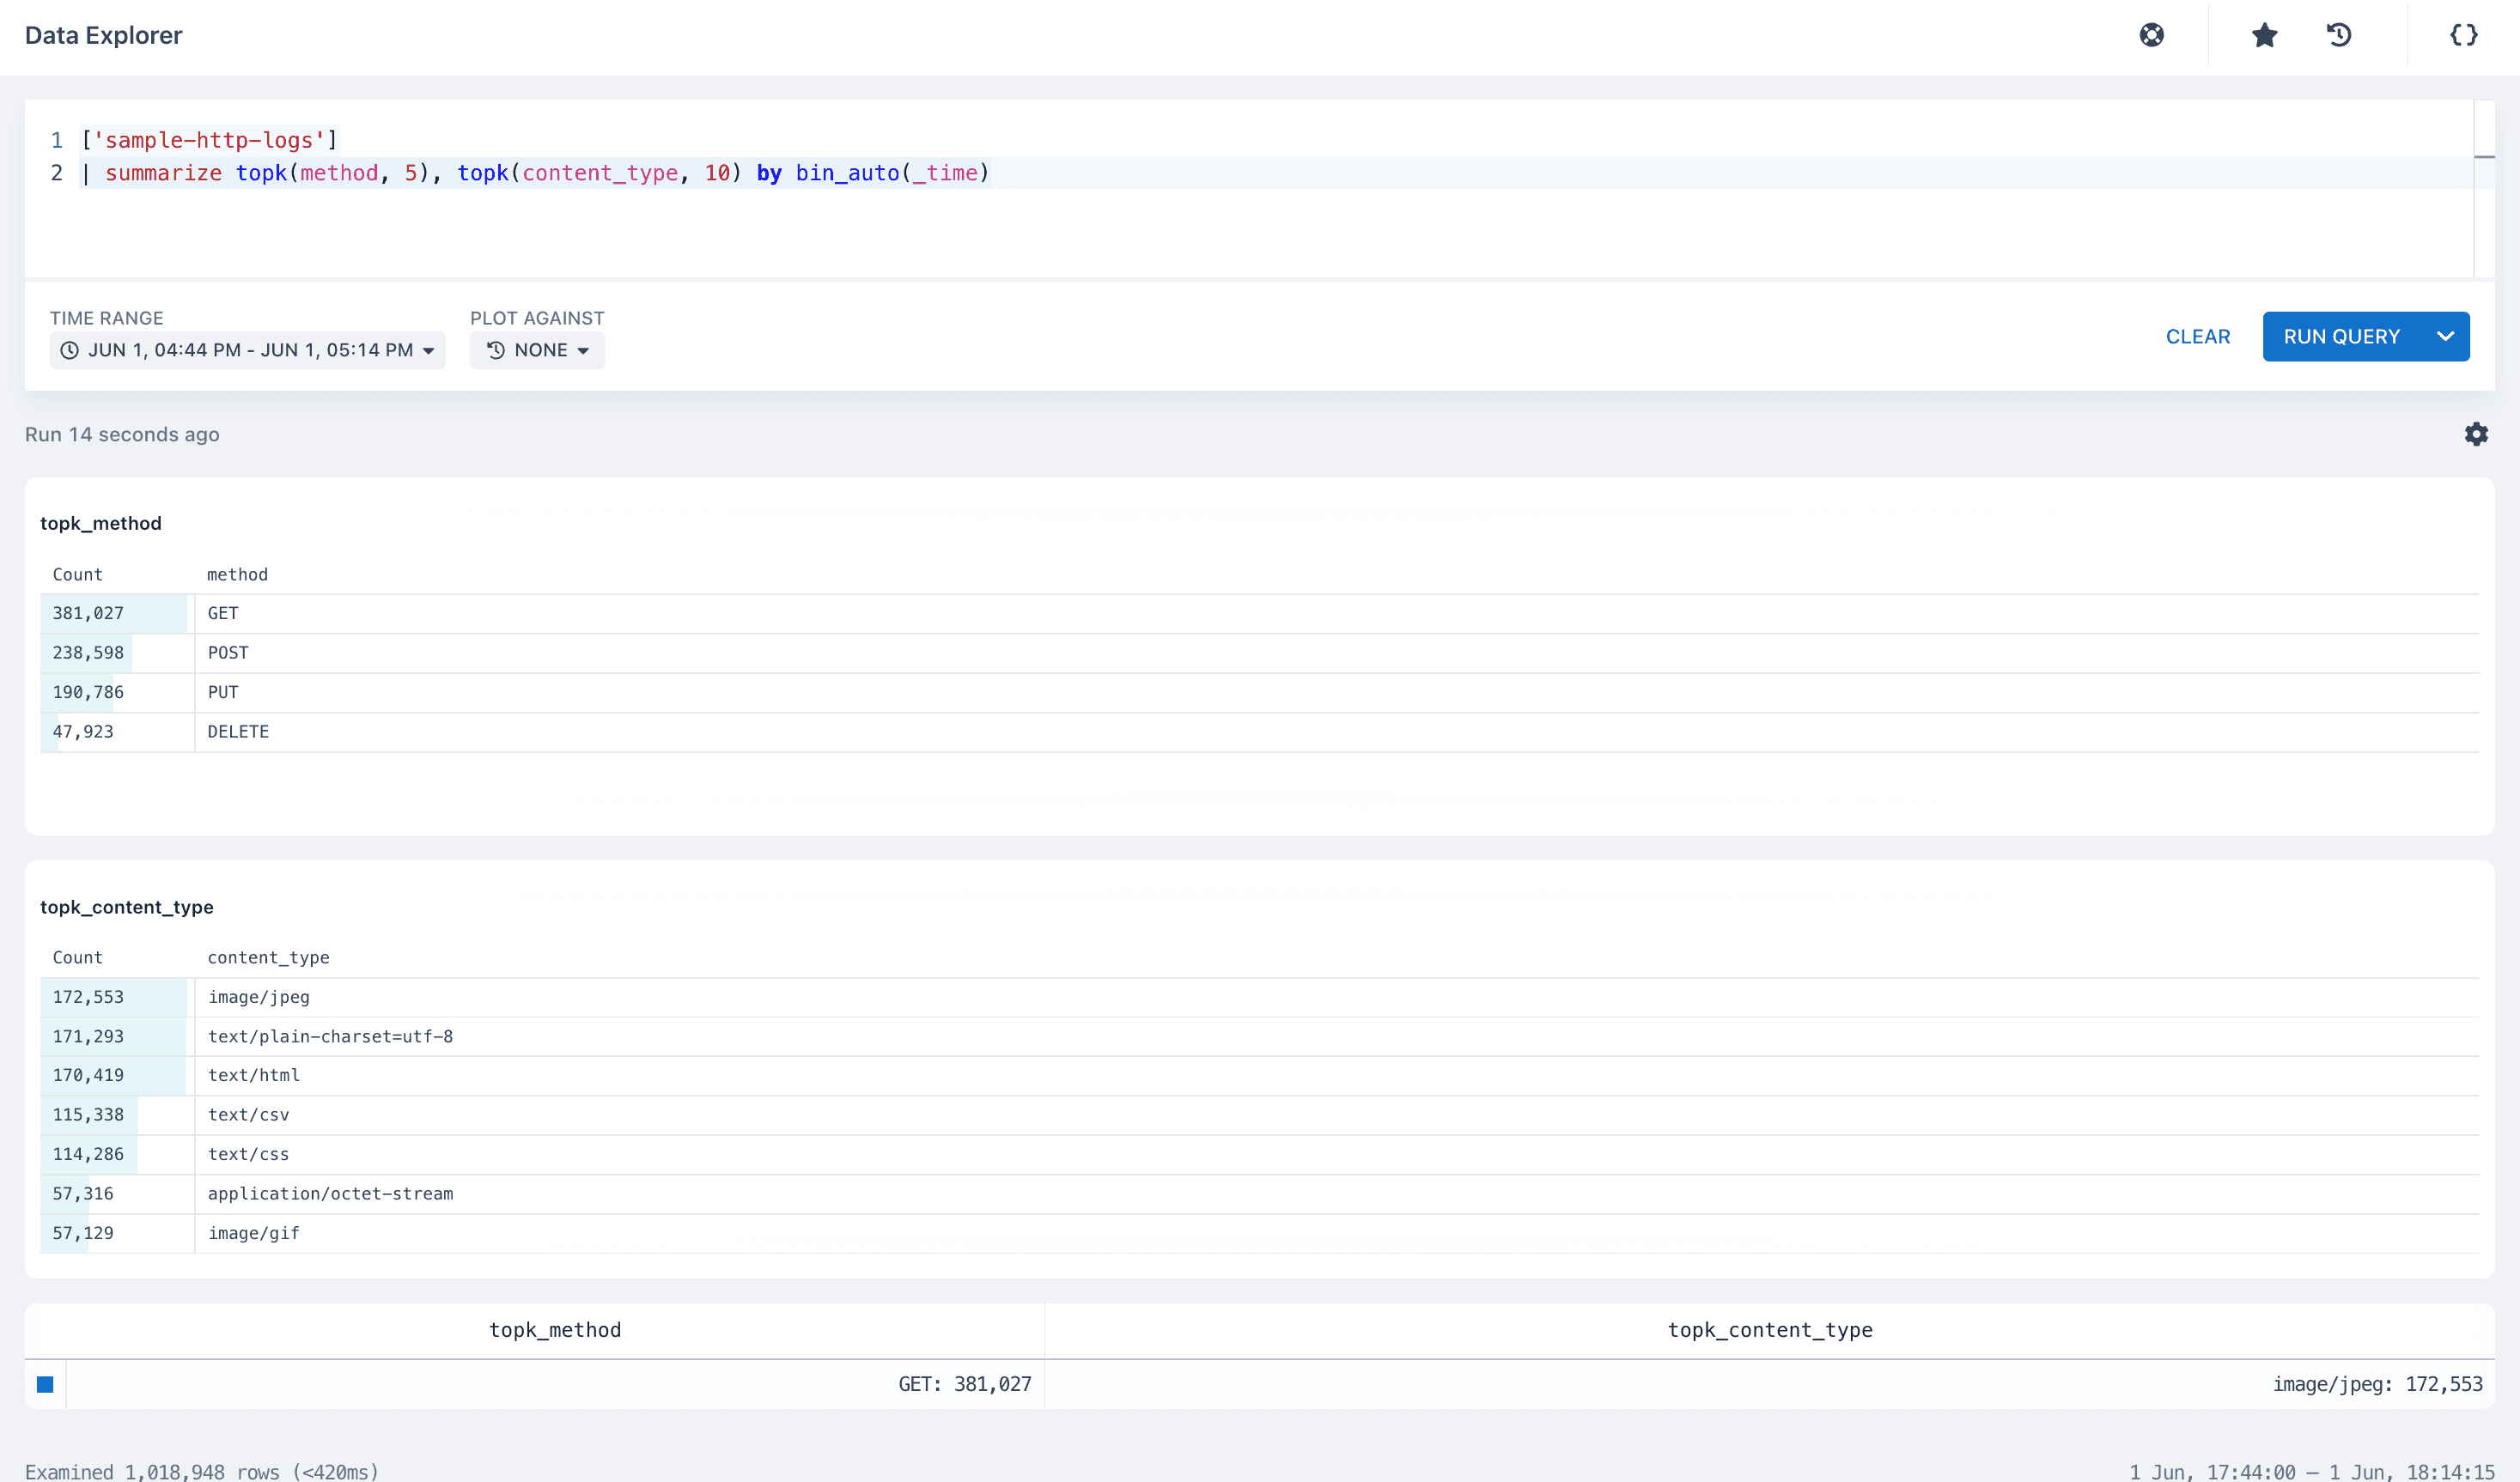
We worked on and deployed a new topk implementation with a scaling factor. With this implementation, you can get the precise estimates when you want to know the top 5 or top 10 (where ‘5’ and ’10’ are ‘k’ in the topk) values for a field in a dataset.

The topK aggregation takes two arguments:

  1. The field to aggregate

  2. How many results to return (top 5, or top 10, or top 20, etc)

Learn more about this aggregation here