Customers have asked for a feature we’re glad to announce: Axiom now has a tracing interface that provides surprisingly quick tracing across 100% of the events in your infrastructure. Distributed tracing lets you see the communication flows among microservices rather than having to cobble them together in your mind from individual log events.
There are already a few distributed tracing tools that work atop the OpenTelemetry framework, but building one into Axiom lets you run traces at full speed on your Axiom data with no additional setup.
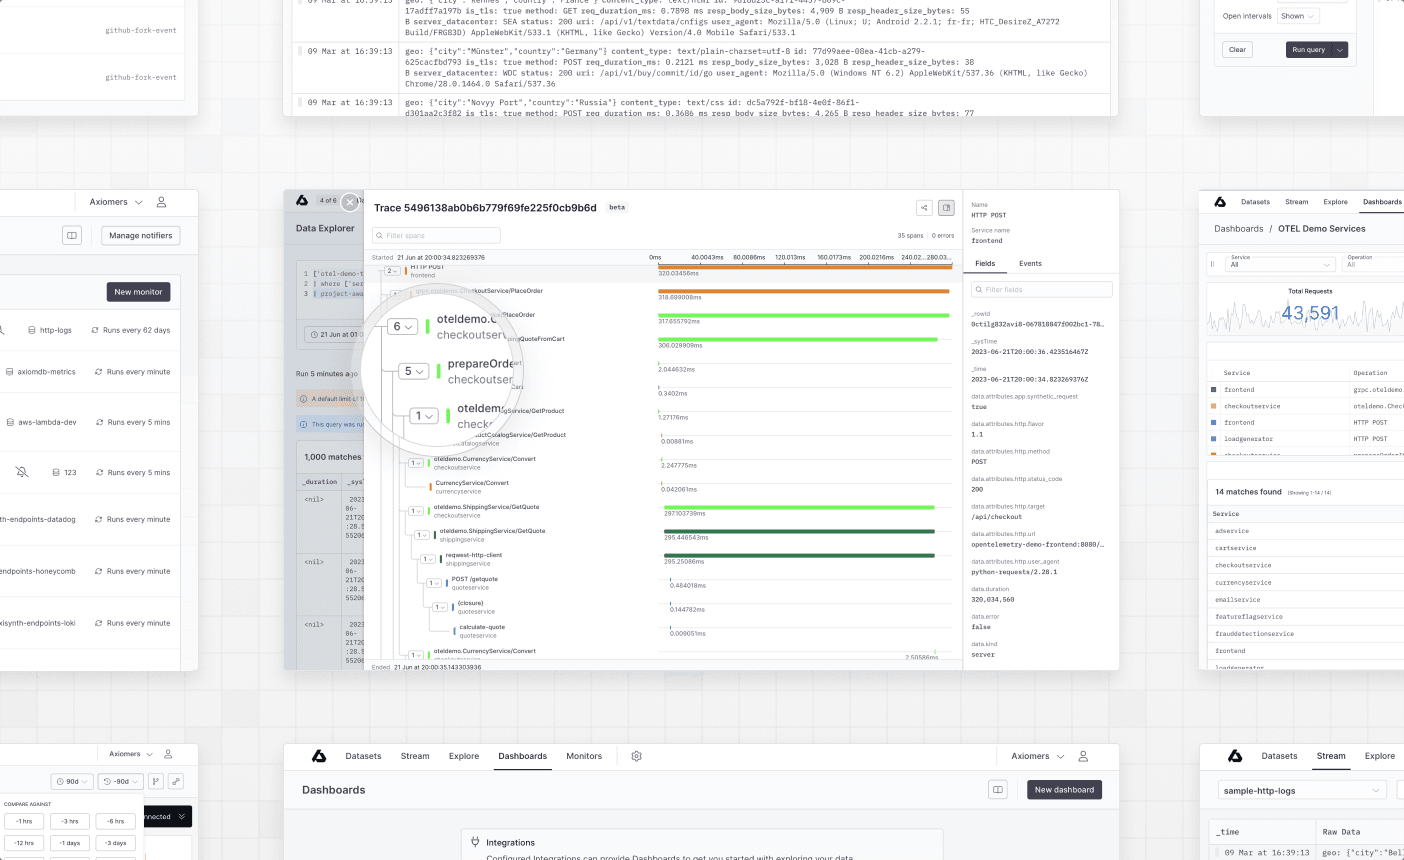
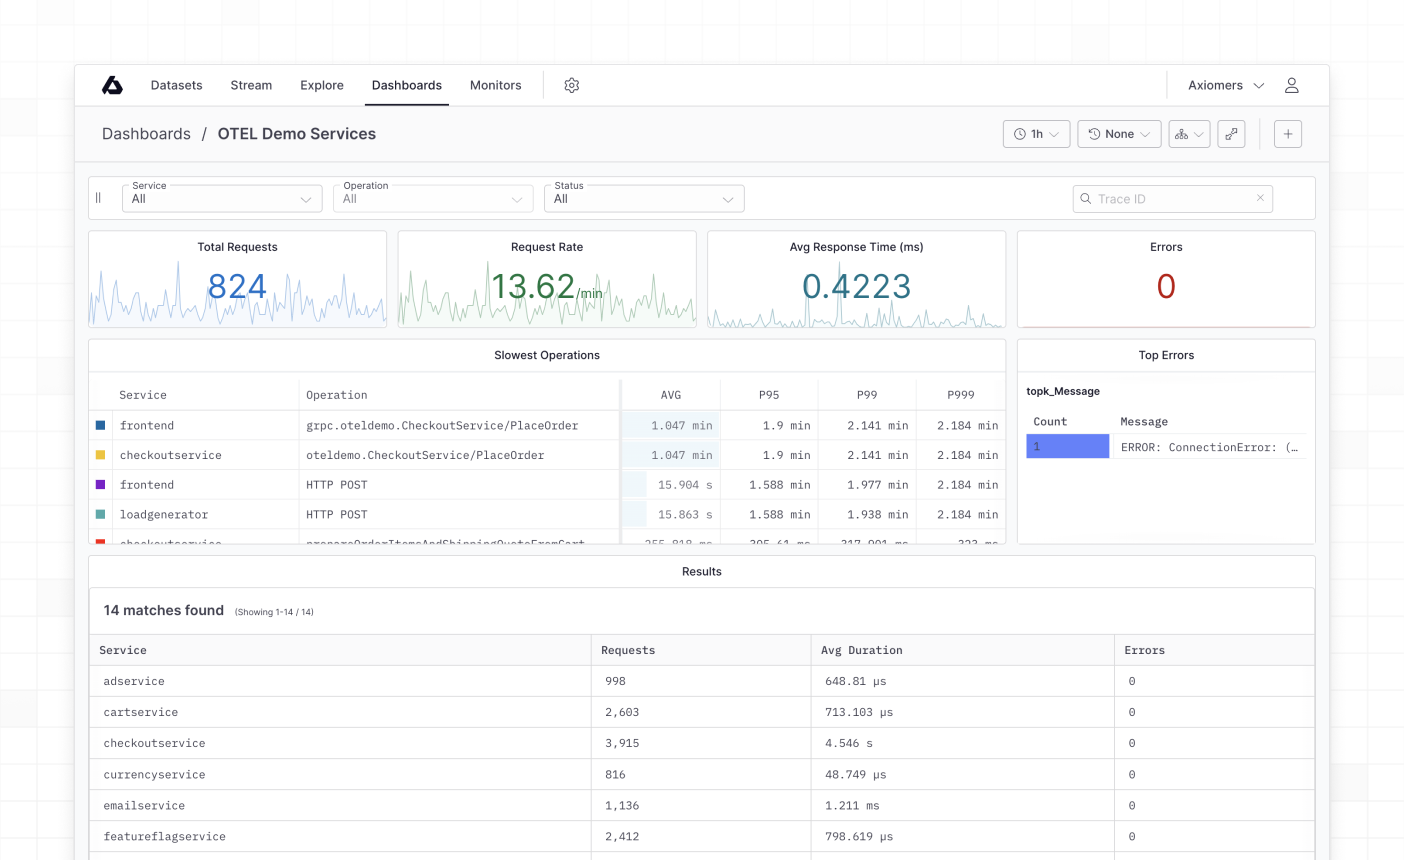
We opted to keep our UI simple and familiar, another customer idea. If you don’t do a lot of tracing, it’s easier and quicker to have a simple UI that looks a lot like Chrome’s network panel, with a waterfall view to inspect your traces, and a dedicated dashboard to drill down into services and operations in your OpenTelemetry data.
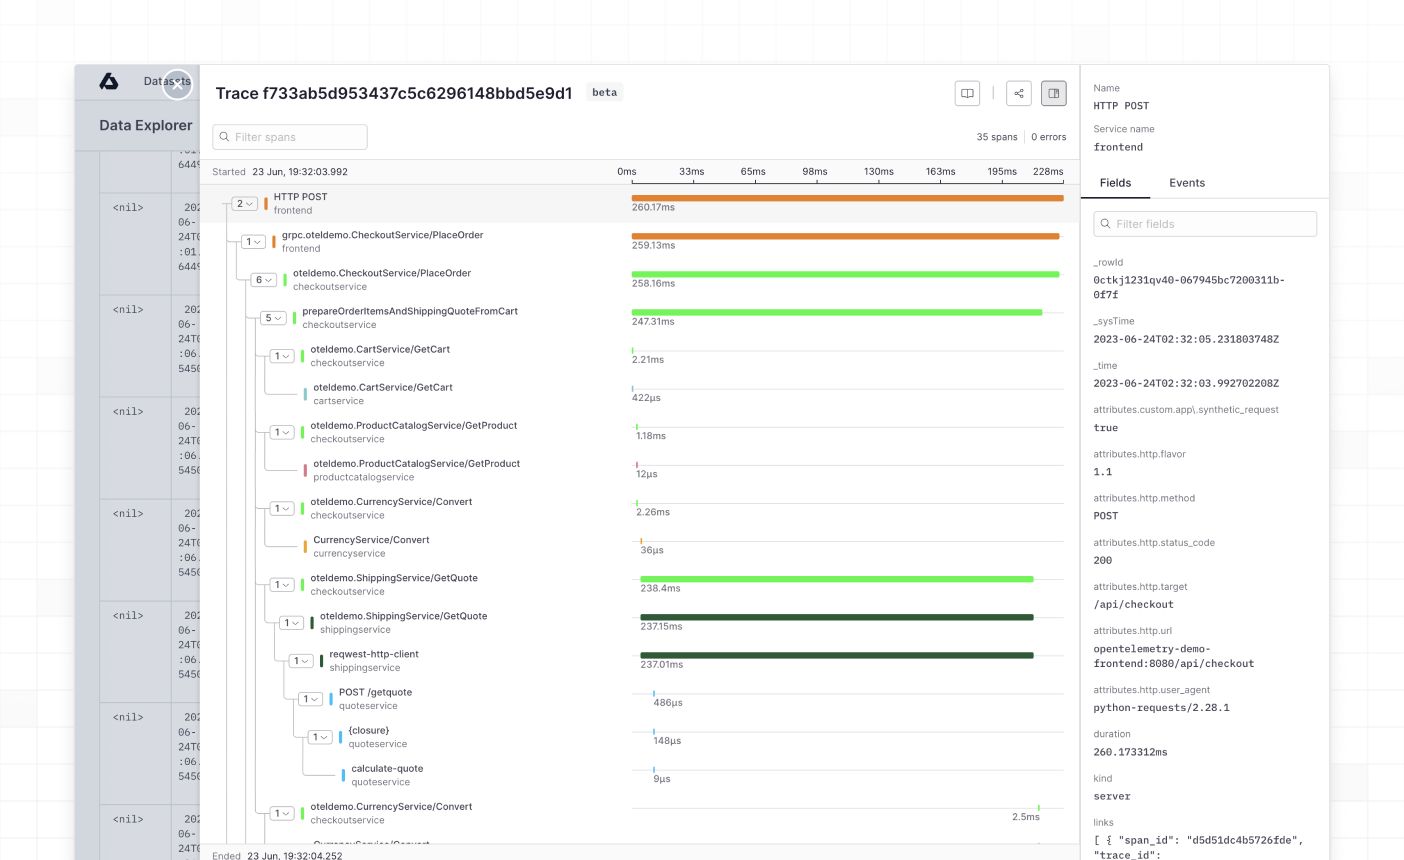
In our waterfall view, we made sure to add familiar features that make it easy to explore each trace:
Hierarchical representation of spans with their parent/child relationships
Visualization of missing and async spans, and any other temporal anomalies
Browsable span metadata, including fields and associated events
Red highlighting of errors to make them stand out
Collapsable span hierarchy for simpler navigation
Get started now
Give your team complete visibility across applications, services and operations with Axiom’s tracing dashboard and waterfall view. Learn more about these features in our documentation, and how you can send OpenTelemetry data to Axiom.