
Takeaways
- Convex’s built-in logs provide basic visibility, but growing applications need comprehensive observability beyond recent logs.
- Axiom’s Convex integration streams function executions, errors, and performance metrics for complete backend visibility.
- Advanced APL queries enable deep analysis of function performance, database usage, and error patterns.
- Prebuilt dashboards and monitoring capabilities transform reactive backend data into actionable insights.
The reactive backend revolution
Modern applications demand real-time responsiveness. Users expect instant updates, live collaboration features, and seamless experiences that feel as dynamic as the data they’re interacting with. This shift has given rise to reactive backends—systems that automatically update clients when underlying data changes, eliminating the need for manual refresh cycles or complex polling mechanisms.
Convex has emerged as a leading platform in this space, offering developers a reactive database where queries are TypeScript code running directly in the database. Just as React components react to state changes, Convex queries react to database changes, creating a seamless development experience for building dynamic, live-updating applications.
But with great reactivity comes great responsibility—the responsibility to understand what’s happening under the hood. As Convex applications scale and complexity grows, developers need comprehensive observability into their backend operations, function performance, and system behavior.
Convex provides built-in logging capabilities that give developers visibility into their most recent function executions and console logs. This works well for development and debugging, but production applications require more sophisticated observability. This is where Axiom’s Convex integration bridges the gap.
Complete observability for Convex deployments
Axiom’s integration with Convex streams comprehensive data from your deployment, providing structured insights into every aspect of your reactive backend:
- Function execution data includes execution times, status codes, function types (queries, mutations, actions), and component paths.
- Database usage metrics track document reads, bytes transferred, and query patterns.
- Performance indicators monitor cache hit rates, scheduled job lag, and resource utilization.
- Error tracking captures failure patterns, exception details, and affected functions.
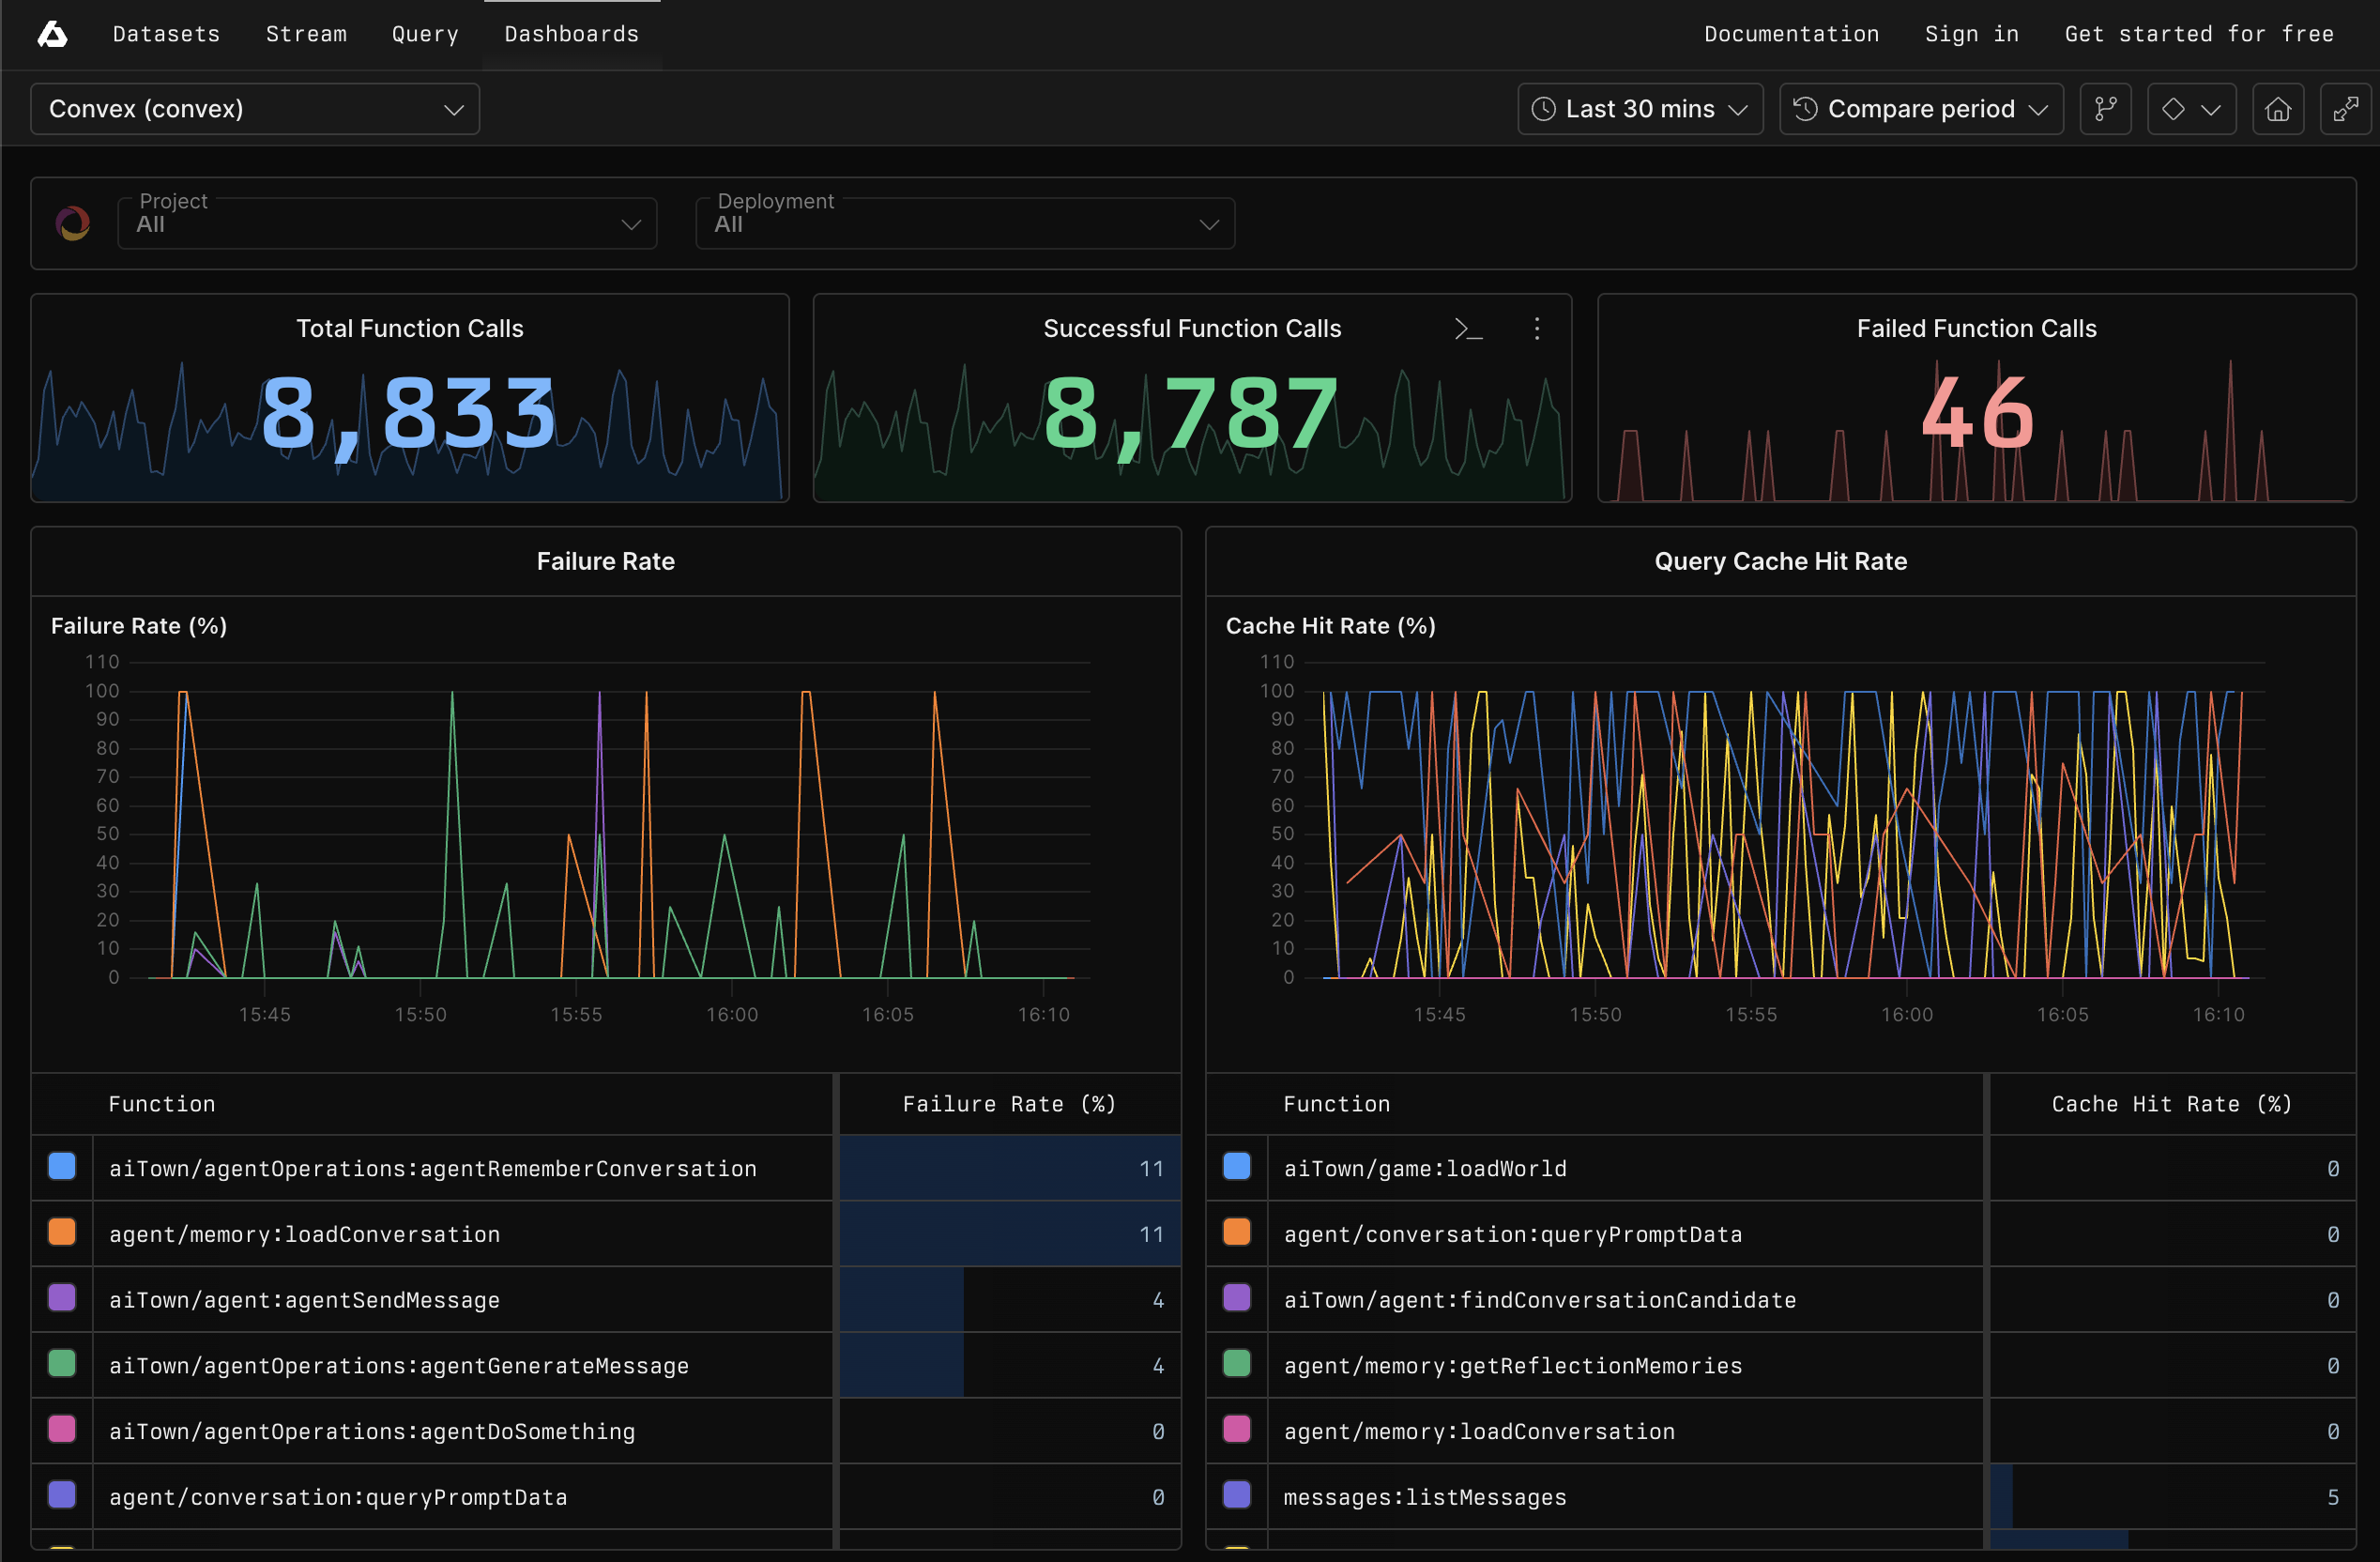
The integration automatically creates a prebuilt dashboard in Axiom’s Integrations section, giving you immediate insights into function performance, database operations, error analysis, and system monitoring—all without writing a single query.
Explore the dashboard in the Playground
Advanced analytics with APL
Beyond the prebuilt dashboard, Axiom’s powerful Axiom Processing Language (APL) enables deep analysis of your Convex data. Here are some powerful queries you can run:
Track function execution times to identify performance bottlenecks:
['convex']
| where ['data.topic'] == "function_execution"
| summarize
    avg_time_ms = avg(['data.execution_time_ms']),
    max_time_ms = max(['data.execution_time_ms']),
    total_calls = count()
  by ['data.function.path']
| order by avg_time_ms desc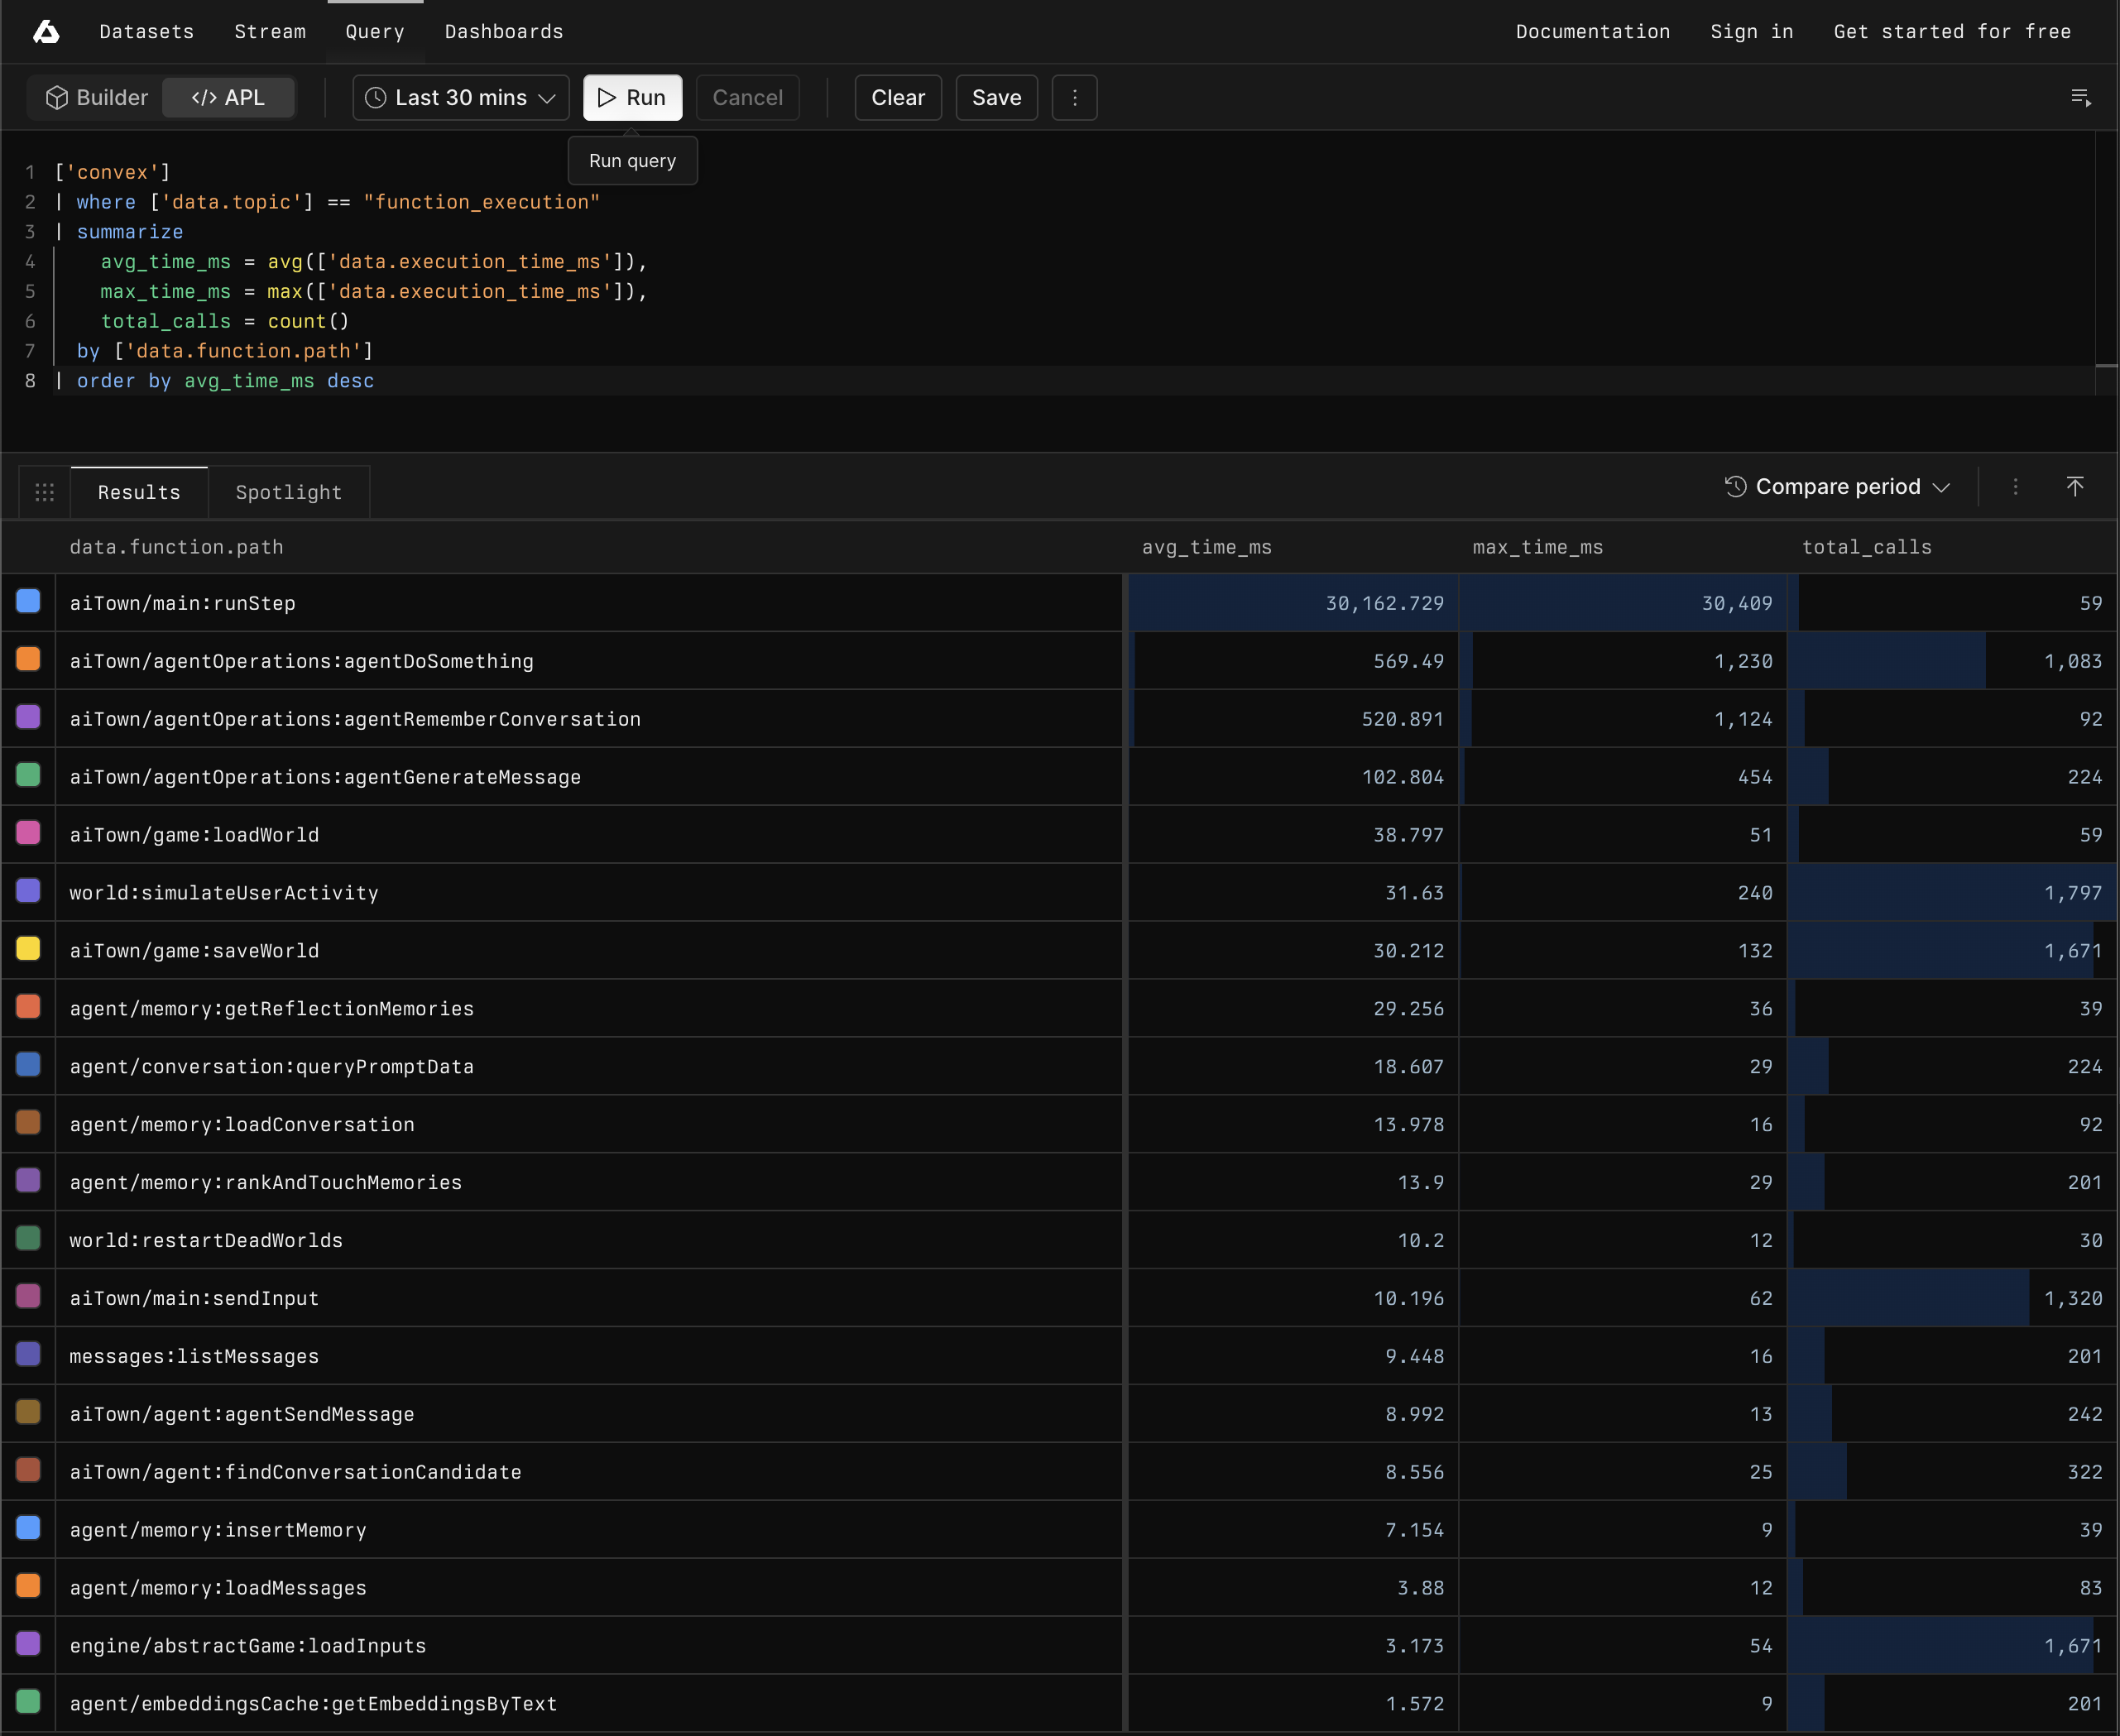
Monitor function error rates to catch issues early:
['convex']
| where ['data.topic'] == "function_execution" and ['data.status'] == "failure"
| summarize count() by ['data.function.path'], ['data.function.type']
| order by count_ desc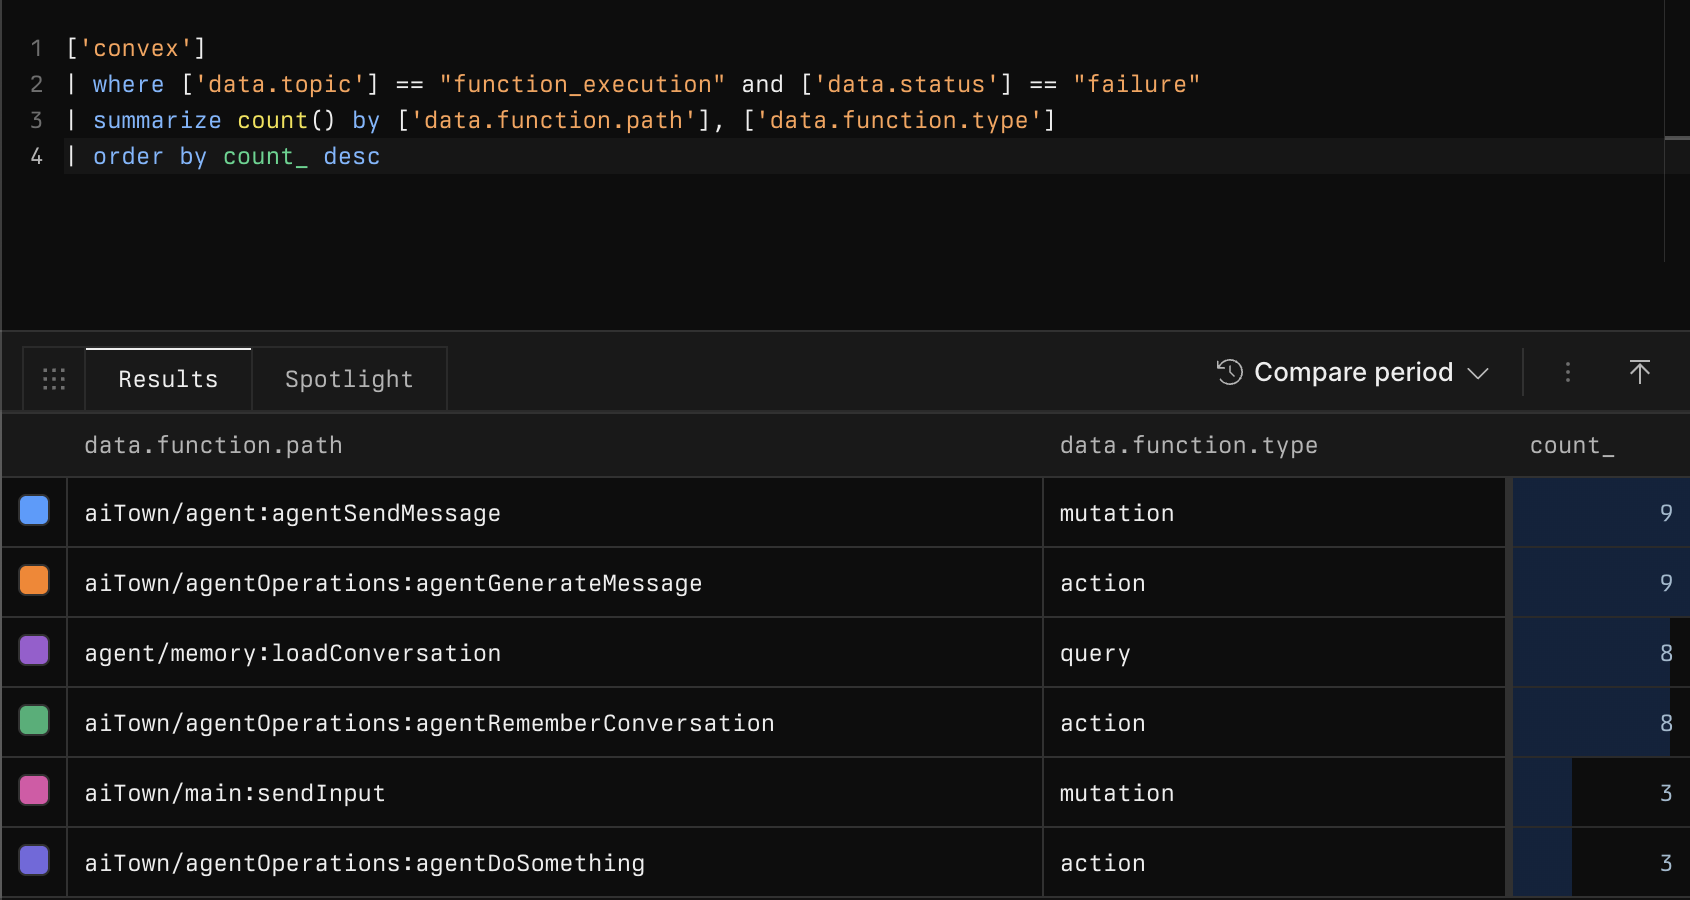
Analyze database usage patterns to optimize resource consumption:
['convex']
| where ['data.topic'] == "function_execution"
| summarize
    avg_docs_read = avg(['data.usage.database_read_documents']),
    avg_bytes_read = avg(['data.usage.database_read_bytes'])
  by ['data.function.path']
| order by avg_bytes_read descTrack query cache performance for optimization opportunities:
['convex']
| where ['data.topic'] == "function_execution"
  and ['data.function.type'] == "query"
  and isnotempty(['data.function.cached'])
| summarize
    cache_hits = countif(['data.function.cached'] == true),
    total_queries = count()
| extend cache_hit_rate = (cache_hits * 100) / total_queriesProactive monitoring and alerting
Reactive backends require proactive monitoring to maintain the seamless user experience they’re designed to provide. Axiom’s monitoring capabilities let you set up intelligent alerts based on your Convex data:
Function failure rate monitoring alerts you when error rates exceed acceptable thresholds:
['convex']
| where ['data.topic'] == "function_execution"
| summarize
    total_calls = count(),
    failures = countif(['data.status'] == "failure")
  by ['data.function.path']
| extend error_rate = (failures * 100) / total_calls
| where error_rate > 5 // Alert if error rate exceeds 5%Performance monitoring catches slow functions before they impact user experience:
['convex']
| where ['data.topic'] == "function_execution" and ['data.execution_time_ms'] > 5000
| summarize count() by ['data.function.path']These monitors integrate seamlessly with notification channels like Slack, PagerDuty, and email, ensuring your team stays informed about issues as they develop.
The business impact of reactive backend observability
The benefits of comprehensive Convex observability extend far beyond technical metrics:
- Improved user experience: Proactive monitoring catches performance issues before users notice them, maintaining the seamless reactive experience your application promises.
- Faster incident resolution: Detailed function execution data and error tracking accelerate debugging, reducing mean time to resolution.
- Optimized resource usage: Database usage analytics help identify inefficient queries and optimize resource consumption, directly impacting operational costs.
- Data-driven optimization: Historical performance data enables informed decisions about function optimization, caching strategies, and architectural improvements.
- Team collaboration: Shared dashboards and monitoring insights keep your entire team aligned on system health and performance goals.
Getting started with Convex + Axiom
Setting up observability for your Convex deployment is straightforward. The integration requires a Convex Professional plan and takes just a few minutes to configure:
- Configure the integration in your Convex dashboard with your Axiom dataset name and API key.
- Add optional attributes like project name, environment, or team information for better context.
- Verify the connection and start streaming data immediately.
- Explore the prebuilt dashboard for instant insights into your deployment.
- Create custom monitors based on your specific performance and reliability requirements.
The integration begins streaming data immediately, and you’ll have access to both real-time monitoring and historical analysis from day one.
For more information, see Send data from Convex.
Beyond basic observability
Axiom’s Convex integration doesn’t just solve the immediate observability challenge—it transforms reactive backend data into a strategic asset. The combination of comprehensive data collection, powerful querying capabilities, and intelligent monitoring creates a foundation for continuous improvement and optimization.
As your Convex application grows in complexity and scale, Axiom grows with you, providing the insights and monitoring capabilities you need to maintain the reactive, real-time experience your users expect.
Ready to unlock complete observability for your Convex deployment? Get started with Axiom’s Convex integration and transform reactive backend data into actionable insights.


