What correlations are
A correlation group contains up to three datasets:- Logs dataset: OpenTelemetry log records with trace context.
- Traces dataset: OpenTelemetry trace spans.
- Metrics dataset: OpenTelemetry metrics stored in MetricsDB.
Prerequisites
Before you create a correlation group, prepare the datasets that you plan to connect:- Send logs, traces, and metrics to separate datasets.
- Use a dedicated OpenTelemetry metrics dataset for metrics.
- Ensure logs include
trace_idandspan_idfor log-to-trace and trace-to-log navigation. This should happen by default if you useLogger.emitor the equivalent in your OpenTelemetry library. - Use OpenTelemetry semantic conventions when possible
Create a correlation group
- In Axiom Console, go to Datasets.
- Click Correlations.
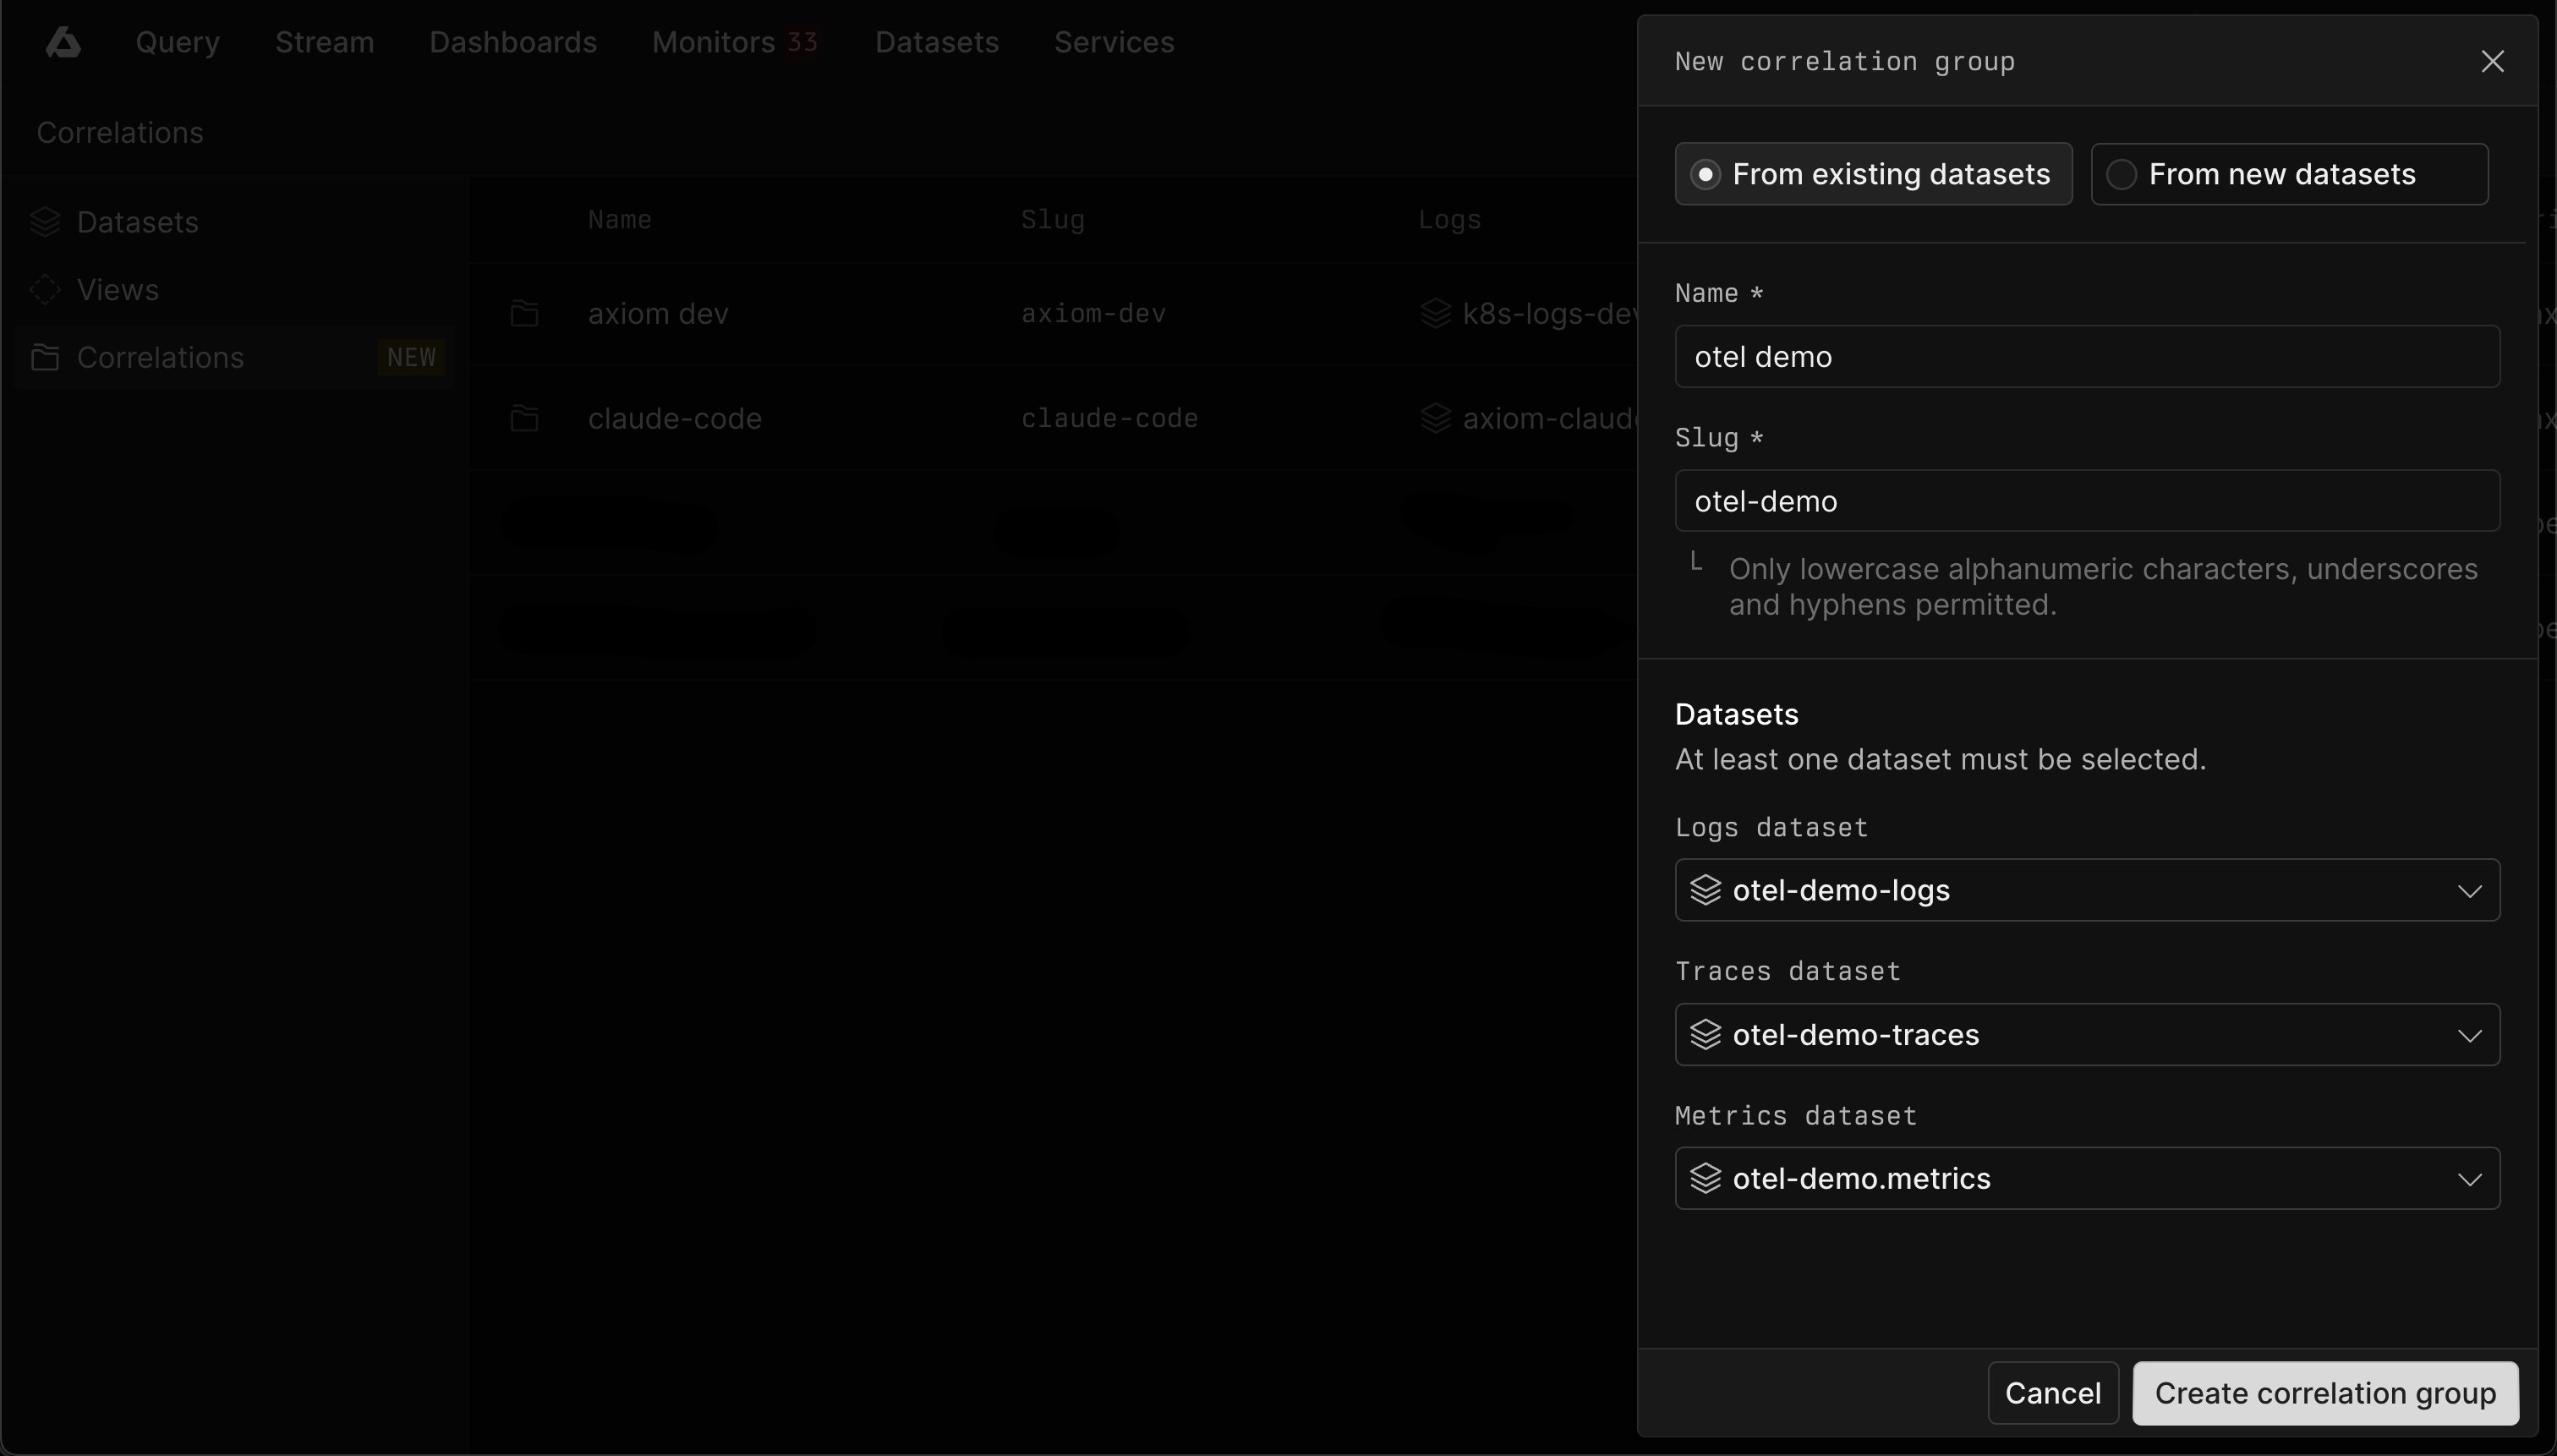
- Click New correlation group.
- Enter a Name.
- Enter a Slug.
- Select one or more datasets:
- Logs dataset
- Traces dataset
- Metrics dataset
- Click Create correlation group.
Use correlations
Use correlations from query results and trace details to move between telemetry signals.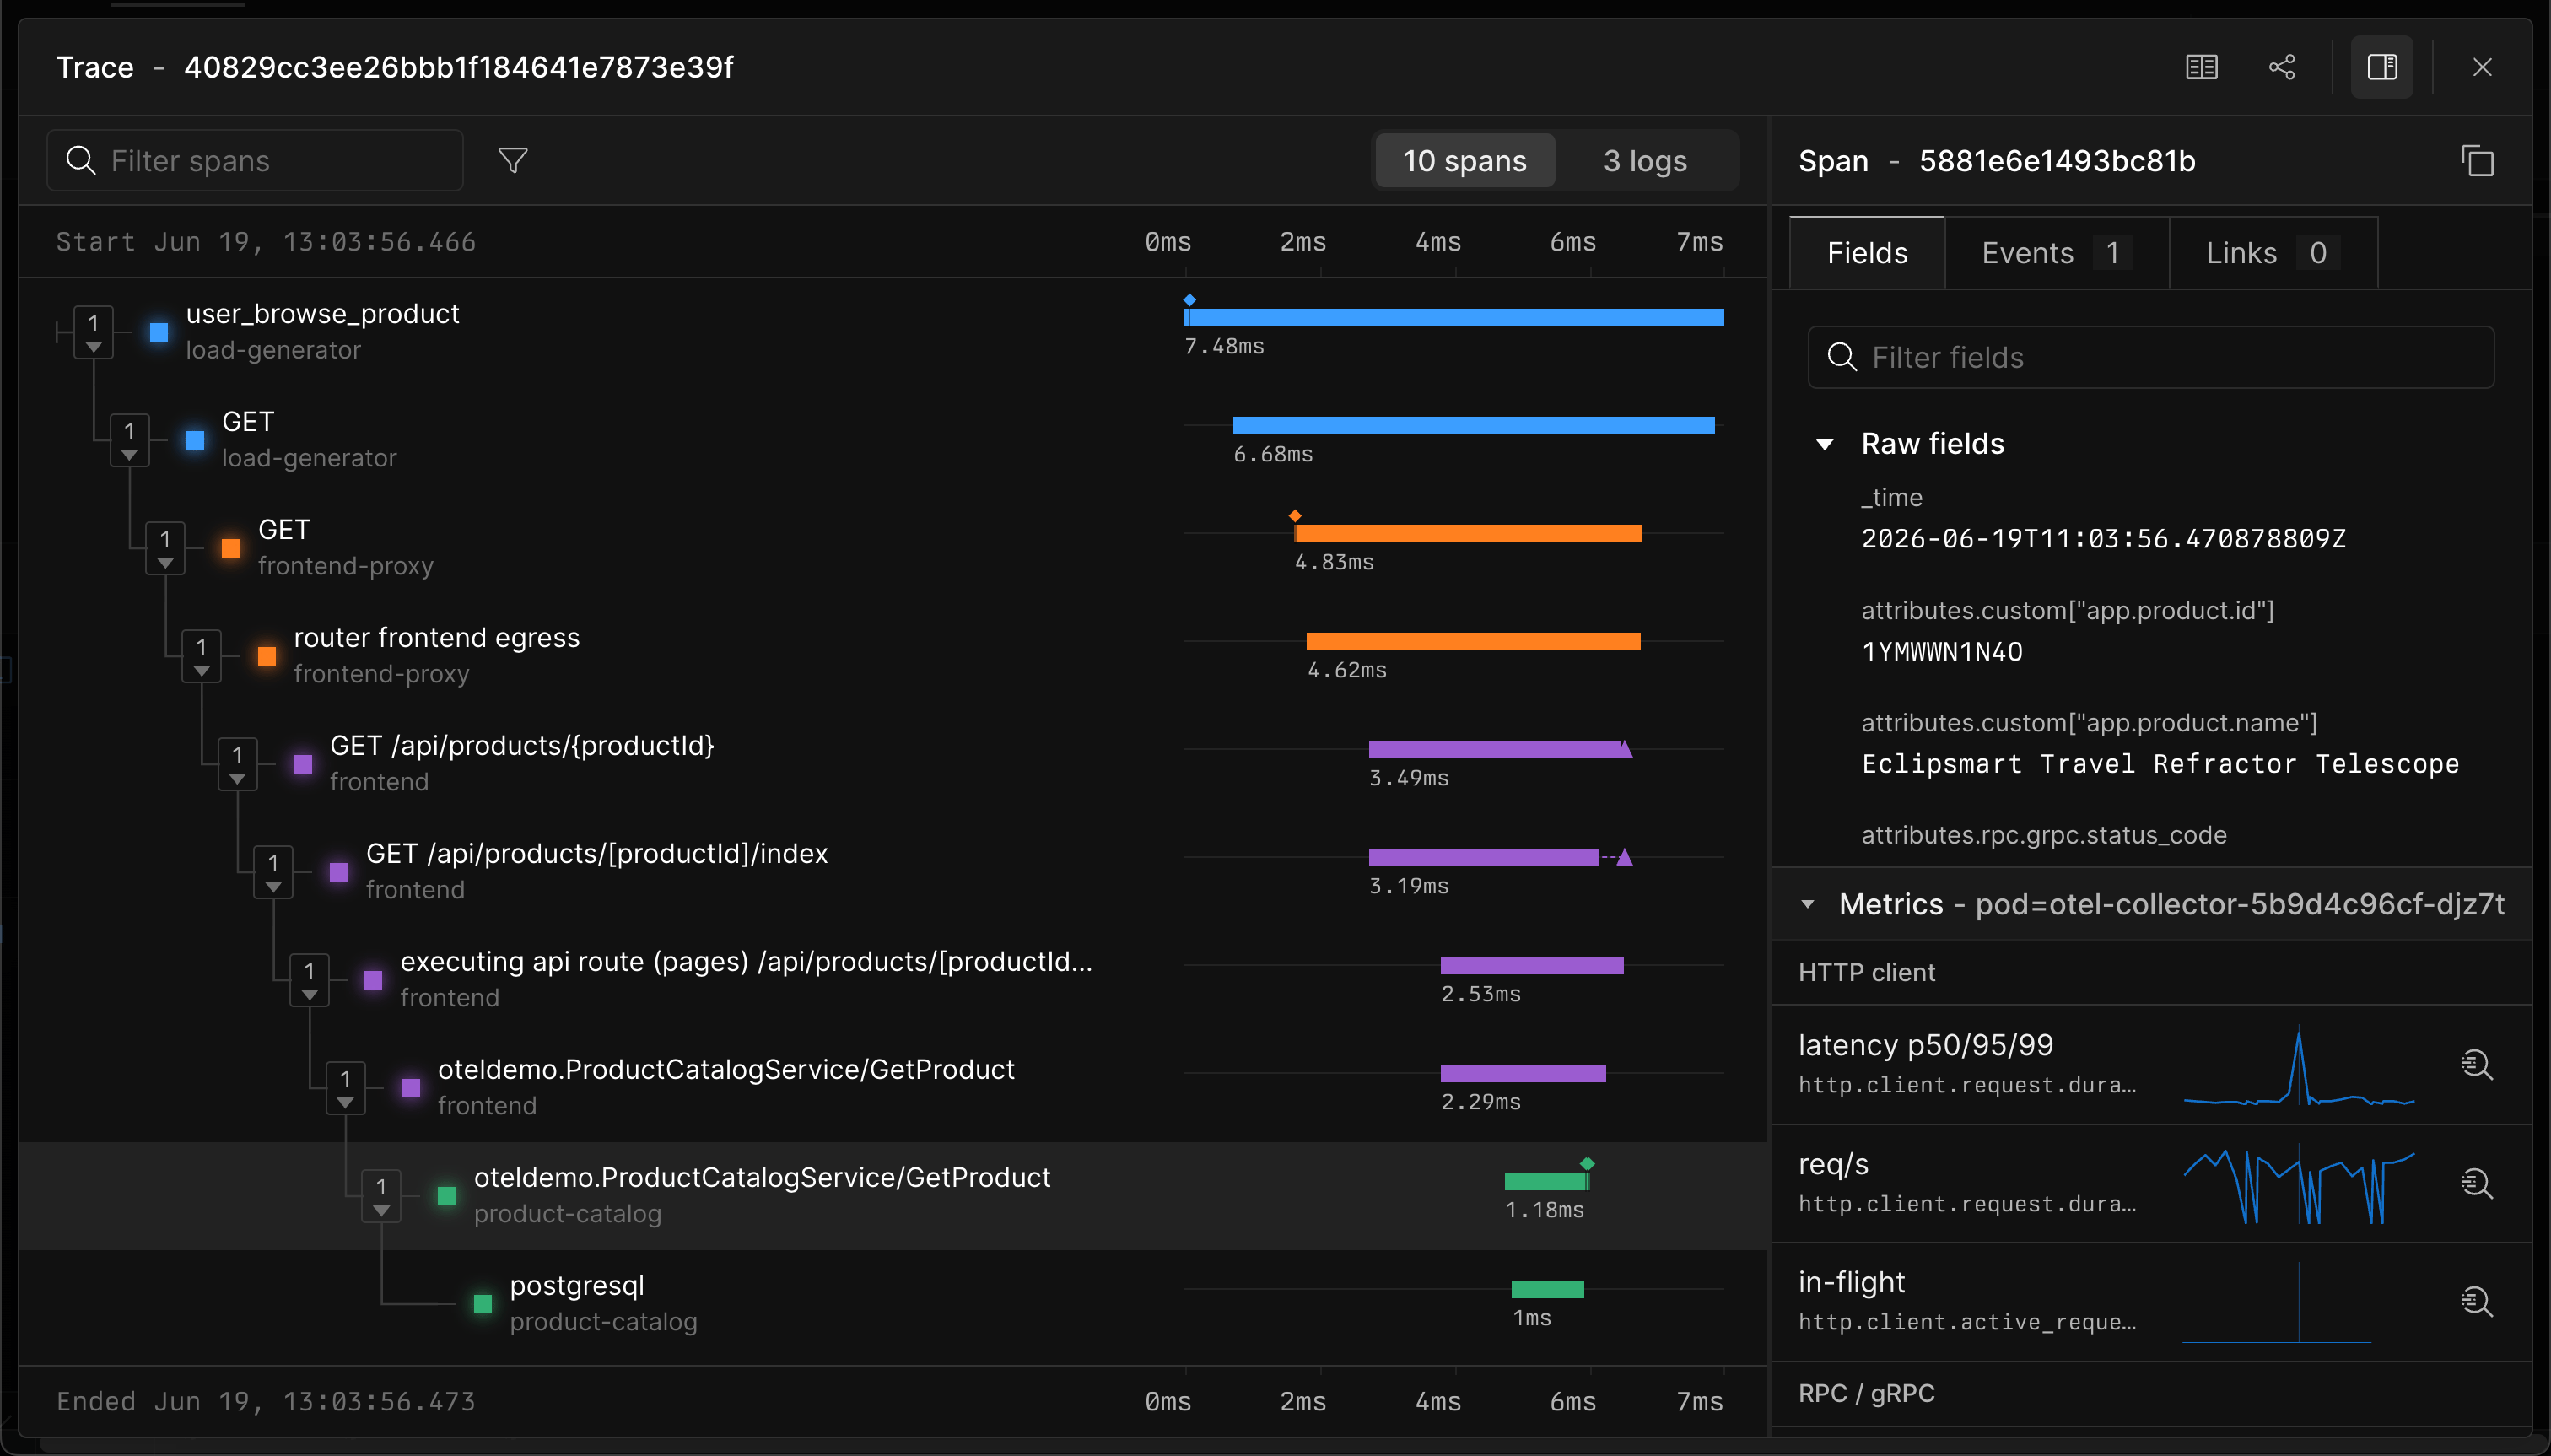
Go from logs to traces
When a log event belongs to a correlated logs dataset and contains a trace ID, Axiom links the event to the matching trace in the correlated traces dataset.Query view
- Run a query against a logs dataset that has correlated traces.
- Click a log event to view details.
- Click View trace to open the matching trace in the Trace view.
Stream tab
- Open the stream for a logs dataset that has correlated traces.
- Click a log event to view details.
- Click View trace to open the matching trace in the Trace view.
Go from traces to logs
When a trace belongs to a correlated traces dataset, Axiom queries the correlated logs dataset for log records in the trace time range. Use this flow when a trace shows a slow or failed span and the investigation needs nearby log records from the same request.Go from traces to metrics
When a trace belongs to a correlated traces dataset and the group has a metrics dataset, Axiom shows relevant span metrics in the span details panel. Trace-to-metrics correlation uses OpenTelemetry semantic conventions and the metric catalog to show common runtime, process, container, and service metrics. Each metric includes an Explore action that opens the generated MPL query in the Query tab. Use this flow when a span shows latency or errors and the investigation needs resource or service health around the same time.Trace-to-metrics correlation requires the correlated metrics dataset to use an edge deployment.