Dashboard sections
This page explains how to organize dashboard elements into collapsible sections.
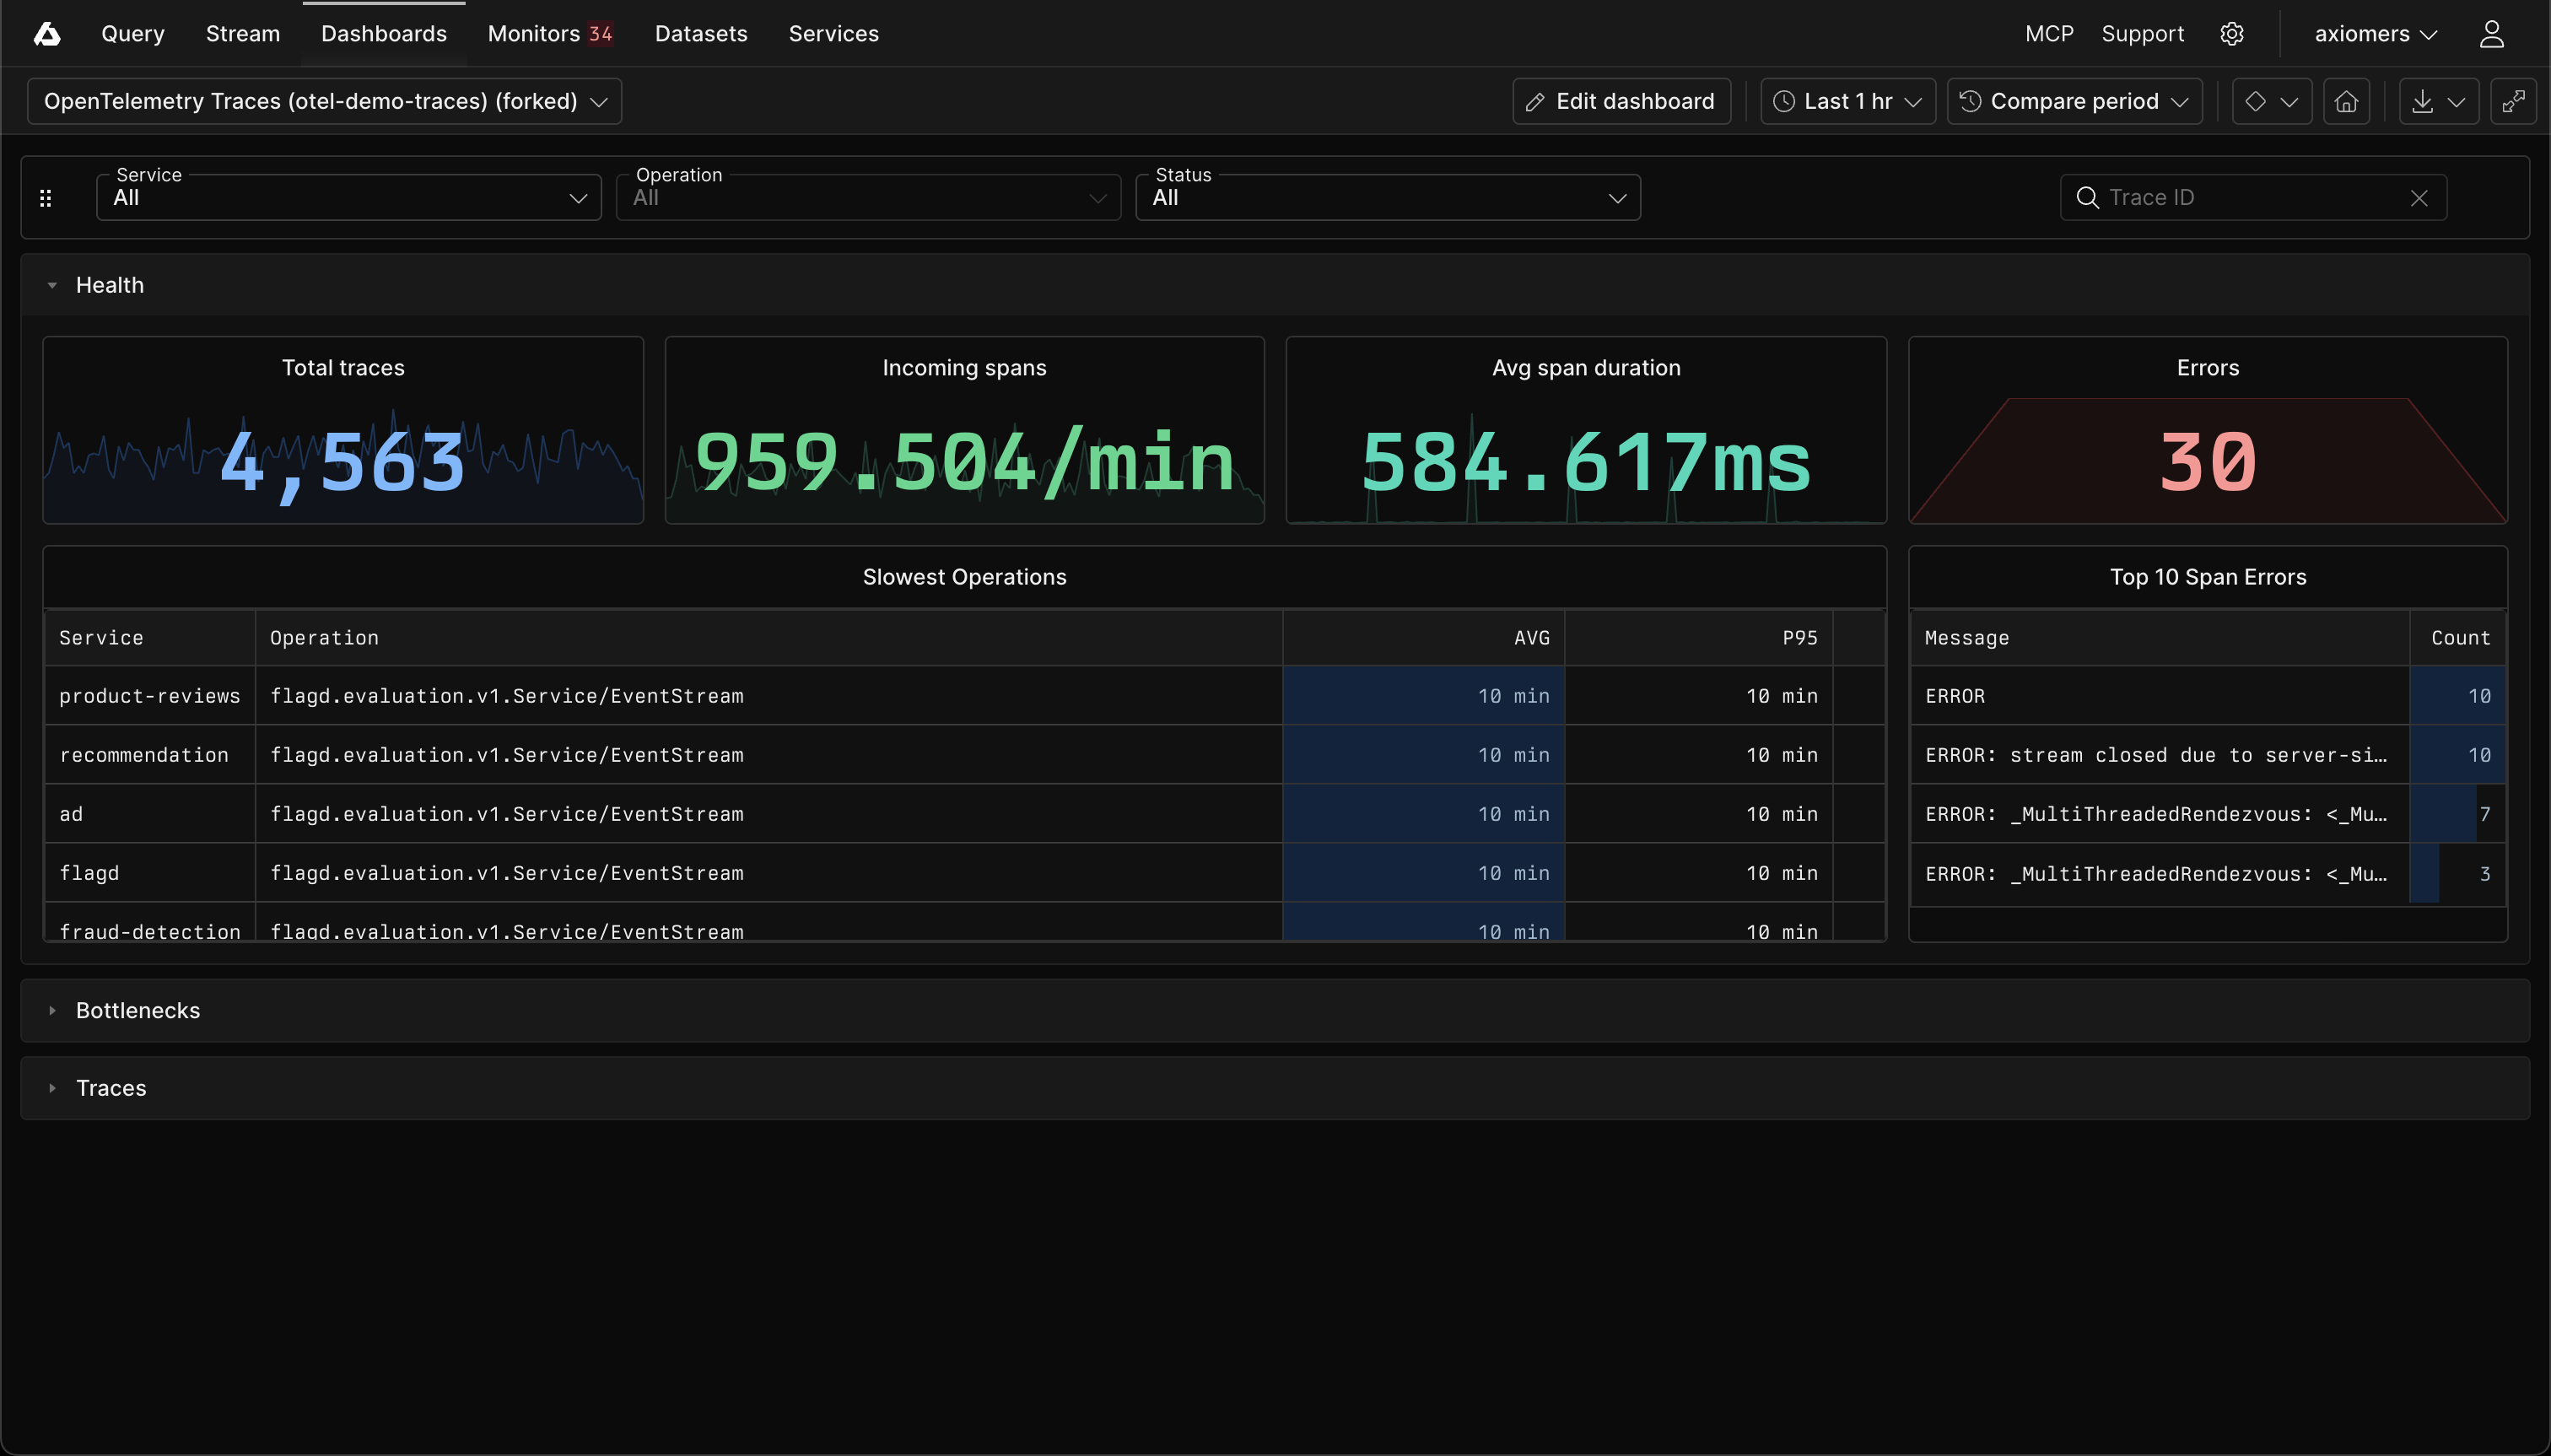
Sections group related dashboard elements under a shared header. Use sections to divide a large dashboard. Each section expands and collapses independently. When you collapse a section, Axiom stops running queries for the elements inside it. Expand the section to load the elements again.
Prerequisites
Create section
- Go to the Dashboards tab and open the dashboard where you want to add the section.
- Click Edit dashboard.
- Click Add element in the top right corner.
- In Section, click Add section.
- Enter a name for the section.
- Click Add.
- Click Save dashboard.
The new section appears below dashboard elements that aren't assigned to a section.
Add dashboard elements to section
To create a dashboard element directly in a section:
- Click Edit dashboard.
- In the section header, click Add element to section.
- Select the type of dashboard element to add.
- Configure the dashboard element, and then click Save.
- Click Save dashboard.
To move an existing dashboard element into a section, enter edit mode and drag the element by its title bar into the section. Drag elements between sections in the same way. To remove an element from a section, drag it to the area above the first section.
Filter bars remain outside sections because they apply to the entire dashboard.
Expand and collapse section
Click the section header to expand or collapse the section. Collapsing a section stops the queries for its dashboard elements. Expanding the section runs the queries and displays the elements again.
Axiom remembers the expanded or collapsed state for each section in the current browser. This state doesn't change the dashboard for other users.
Configure section
To configure a section:
- Click Edit dashboard.
- In the section header, click Section options.
- Choose one of the following options:
- Click Rename to change the section name.
- Click Collapse by default to initially display the section as collapsed. Viewers can still expand it.
- Click Expand by default to initially display the section as expanded. Viewers can still collapse it.
- Click Save dashboard.
To change the order of sections, enter edit mode and drag the handle to the left of the section name. Sections always appear below dashboard elements that aren't assigned to a section.
Delete section
- Click Edit dashboard.
- In the section header, click Section options.
- Choose one of the following options:
- Click Delete section, keep charts to remove the section and move its dashboard elements outside all sections.
- Click Delete section and charts to remove the section and all its dashboard elements from the dashboard.
- Confirm the deletion.
- Click Save dashboard.