Annotations
This page explains how to use annotations in Query, dashboards, and monitors.
Annotations show when deployments, outages, or other configured events happened alongside your data. Mark a point or interval in time across Query, dashboards, and monitors to put changes in context.
Prerequisites
- Create an Axiom account.
- Create a dataset in Axiom where you send your data.
- Send data to your Axiom dataset.
- To view annotations in Console, use an account with permission to read annotations.
- For API requests and GitHub Actions, create an API token with the annotation permissions for the operations you use: create, read, update, or delete.
Show and hide annotations in Console
Query
Annotations appear on time series and percentile charts, and on heatmaps when the query returns a single chart. Use Chart options to show or hide annotations for the queried dataset and selected time range.
Dashboards
To choose the annotation types to display, click Annotations in the dashboard toolbar.
In the chart editor, expand Chart and click Manage in Annotations.
Each chart shows annotations for the datasets it queries. Your selections apply across the dashboard and aren't saved with it.
Monitors
Threshold and anomaly monitor charts show annotations for the monitor’s dataset and the chart’s time range.
In Recent activity, click Annotations beside the time range and select the types to display. On phones, open Recent activity options (⋯) and select Annotations.
In the monitor editor, run the preview query. Expand Chart in the settings panel and click Manage in Annotations.
Your selections aren't saved with the monitor.
Display limits
For time ranges longer than 100 days, charts show annotations only for the latest 100 days of that range. To view older annotations, select a shorter range around the event.
Create annotations
Create annotations with a GitHub Action or the Axiom API. The Axiom Vercel integration also creates annotations when deployments complete.
Create annotations with GitHub Actions
Add the Axiom annotation action after the deployment step in your workflow:
By default, the action uses the current time and links to the workflow run.
Create annotations using Axiom API
To create an annotation using the Axiom API, use the following API request:
Customize the other fields of the code above such as the title, the description, and the URL. For more information on the allowed fields, see Annotation object.
Example response
The API response from Axiom contains an id field. This is the annotation ID that you can later use to change or delete the annotation.
Get information about annotations
To list annotations in your organization, use the following API request:
Without filters, this endpoint returns all annotations in your organization. Use the following parameters to filter by time range or dataset:
startis an RFC 3339 timestamp that specifies the beginning of the time interval.endis an RFC 3339 timestamp that specifies the end of the time interval.datasetsis the list of datasets whose annotations you want to get information about. Separate datasets by commas, for exampledatasets=my-dataset1,my-dataset2.
Set both start and end, or omit both. Use a range of 100 days or less, with end at or after start. Results include annotations that overlap the range.
The following example lists annotations for my-dataset between March 16 and 19, 2024:
Example response
The API response from Axiom contains an id field. This is the annotation ID that you can later use to change or delete the annotation. For more information on the other fields, see Annotation object.
To get information about a specific annotation, use the following API request:
Example response
For more information on these fields, see Annotation object.
Change annotations
To change an existing annotation, use the following API request:
Example response
Delete annotations
To delete an existing annotation, use the following API request:
Annotation object
Annotations are represented as objects with the following fields:
datasetsis the list of dataset names for which the annotation appears on charts. Specify at least one existing dataset when creating an annotation.idis the unique ID of the annotation.timeis the start time of the annotation, in RFC 3339 format. If you omit this field when creating an annotation, Axiom uses the time of the API request. Axiom rejects future start times.- Optional:
endTimeis the end time of the annotation, in RFC 3339 format. Specify an end time at or aftertime. Omit this field when creating an annotation to mark a point in time. typeis the type of event marked by the annotation. For example,production-deployment. Specify this field when creating an annotation. Use lowercase letters, numbers, and hyphens.- Optional:
titleis a summary of the annotation that appears on the charts. - Optional:
descriptionis an explanation of the event the annotation marks on the charts. - Optional:
urlis the URL relevant for the event marked by the annotation. For example, a link to a GitHub pull request.
For more information, see Create annotation, List all annotations, and Update annotation.
Example use case
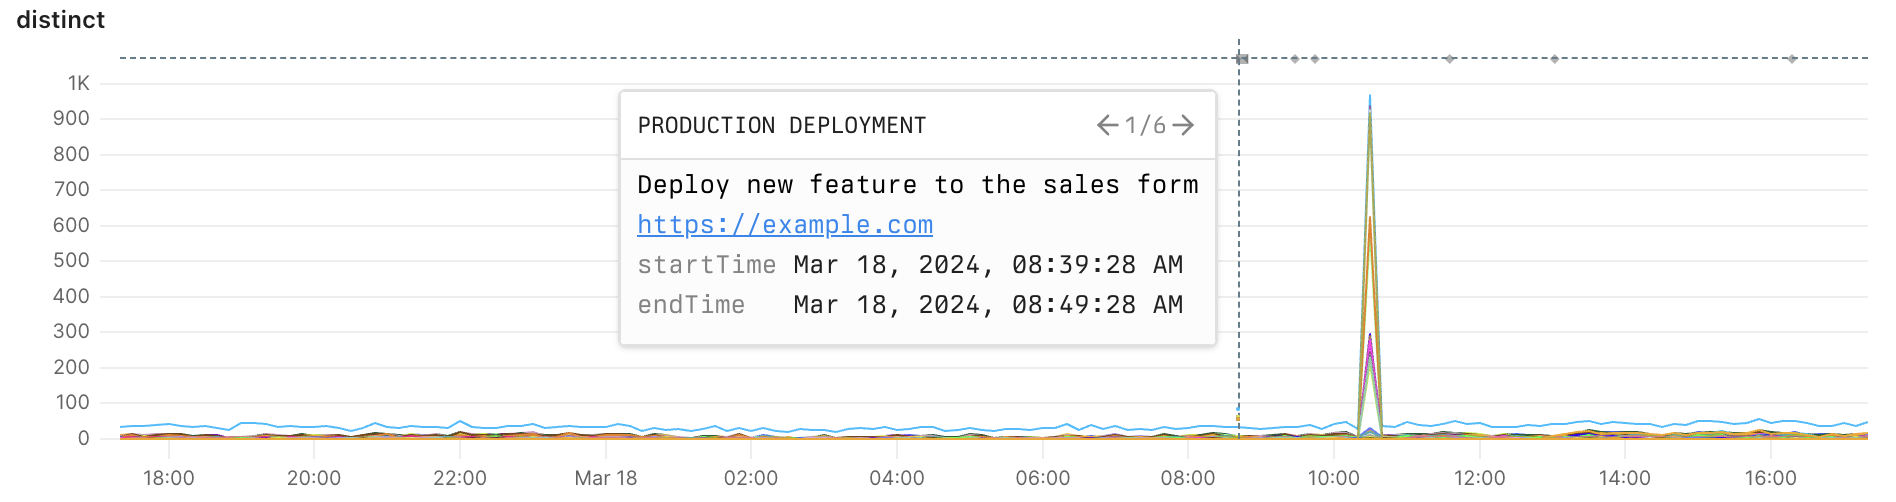
The example below demonstrates how annotations help you troubleshoot issues in your app or system. Your monitor alerts you about rising form submission errors. You explore this trend and when it started. Right before form submission errors started rising, you see an annotation about a deployment of a new feature to the form. You make the hypothesis that the deployment is the reason for the error and decide to investigate the code changes it introduced.
Create annotation
Use the following API request to create an annotation:
Create a monitor
In this example, you set up a monitor that alerts you when the number of form submission errors rises. For more information on creating a monitor, see Monitoring and Notifiers.
Explore trends
Suppose your monitor sends you a notification about rising form submission errors.
You decide to investigate and run a query to display the number of form submission errors over time. Ensure you select a time range that includes the annotation.
You get a chart similar to the example below displaying form submission errors and annotations about the time of important events such as deployments.
Inspect issue
- From the chart, you see that the number of errors started to rise after the deployment of a new feature to the sales form. This correlation allows you to form the hypothesis that the errors might be caused by the deployment.
- You click the annotation’s link to investigate the deployment.
- You inspect the code changes in depth and discover the cause of the errors.
- You quickly fix the issue in another deployment.