Send Temporal telemetry to Axiom
This page explains how to send traces from Temporal SDKs and metrics from Temporal Cloud and self-hosted Temporal to Axiom using OpenTelemetry.
Temporal runs durable workflows and activities. This page explains how to send two kinds of Temporal telemetry to Axiom:
- Traces from your Temporal app: The Temporal TypeScript and Python SDKs create OpenTelemetry spans for workflow starts, workflow runs, and activities. An OTLP exporter sends them directly to Axiom.
- Temporal Cloud metrics: Temporal Cloud publishes operational metrics on an OpenMetrics endpoint. An OpenTelemetry Collector scrapes the endpoint and forwards the metrics to Axiom. Optionally, the same Collector also scrapes the metrics of a self-hosted Temporal Service.
Each part works on its own. Set up the parts you need.
Prerequisites
- Create an Axiom account.
- Create a dataset in Axiom for each kind of data you send:
- For traces, create an events dataset.
- For metrics, create a dataset and select Metrics as the dataset type. Metrics require their own dedicated dataset.
- Create an API token in Axiom with permissions to ingest data to the datasets you have created.
Send traces from Temporal SDKs
Temporal propagates trace context through workflow and activity headers, so a single trace connects the client call that starts a workflow, the workflow run, and each activity it executes. For more information, see the Temporal documentation for TypeScript and Python.
Axiom accepts OTLP over HTTP, so use an OTLP/HTTP trace exporter that encodes data as Protobuf. Send traces to https://AXIOM_DOMAIN/v1/traces with the Authorization and X-Axiom-Dataset headers.
TypeScript
The TypeScript SDK traces workflows, activities, and client calls with the OpenTelemetryPlugin from the @temporalio/interceptors-opentelemetry-v2 package. The plugin registers the tracing interceptors and the sinks that export spans from the workflow sandbox.
-
Install the dependencies:
shell -
Create an
instrumentation.tsfile that configures the OpenTelemetry SDK to export spans to Axiom:typescript -
Add the plugin to your worker. Import
instrumentation.tsbefore any other module, and shut down the OpenTelemetry SDK when the worker stops so it exports the remaining spans:typescriptIf you prebundle workflow code with
bundleWorkflowCode, pass the samepluginsarray tobundleWorkflowCode. Otherwise, workflow code isn’t traced. -
Add the plugin to the client that starts workflows. The client span becomes the root of the trace:
typescript
Replace the connection address with your Temporal Service or Temporal Cloud address, and add the TLS or API key options your deployment requires. For a complete example, see the Temporal interceptors-opentelemetry sample.
Python
The Python SDK traces client calls, workflows, and activities with the TracingInterceptor from temporalio.contrib.opentelemetry.
-
Install the dependencies:
shell -
Configure a tracer provider that exports spans to Axiom:
python -
Set the global tracer provider before you connect the client, and pass
TracingInterceptortoClient.connect. Workers created from this client use the interceptor too:python
TracingInterceptor creates workflow spans as completed spans with no duration, because an open span can’t survive workflow replay. For spans with real durations and support for the standard OpenTelemetry API inside workflow code, use the experimental OpenTelemetryPlugin instead. The exporter configuration stays the same. Create the provider with temporalio.contrib.opentelemetry.create_tracer_provider() instead of TracerProvider(), and pass plugins=[OpenTelemetryPlugin(add_temporal_spans=True)] to Client.connect instead of interceptors.
Explore Temporal traces in Axiom
Each workflow execution produces one trace. Span names combine the operation and the workflow or activity name, for example StartWorkflow:GreetingWorkflow, RunWorkflow:GreetingWorkflow, StartActivity:greet, and RunActivity:greet.
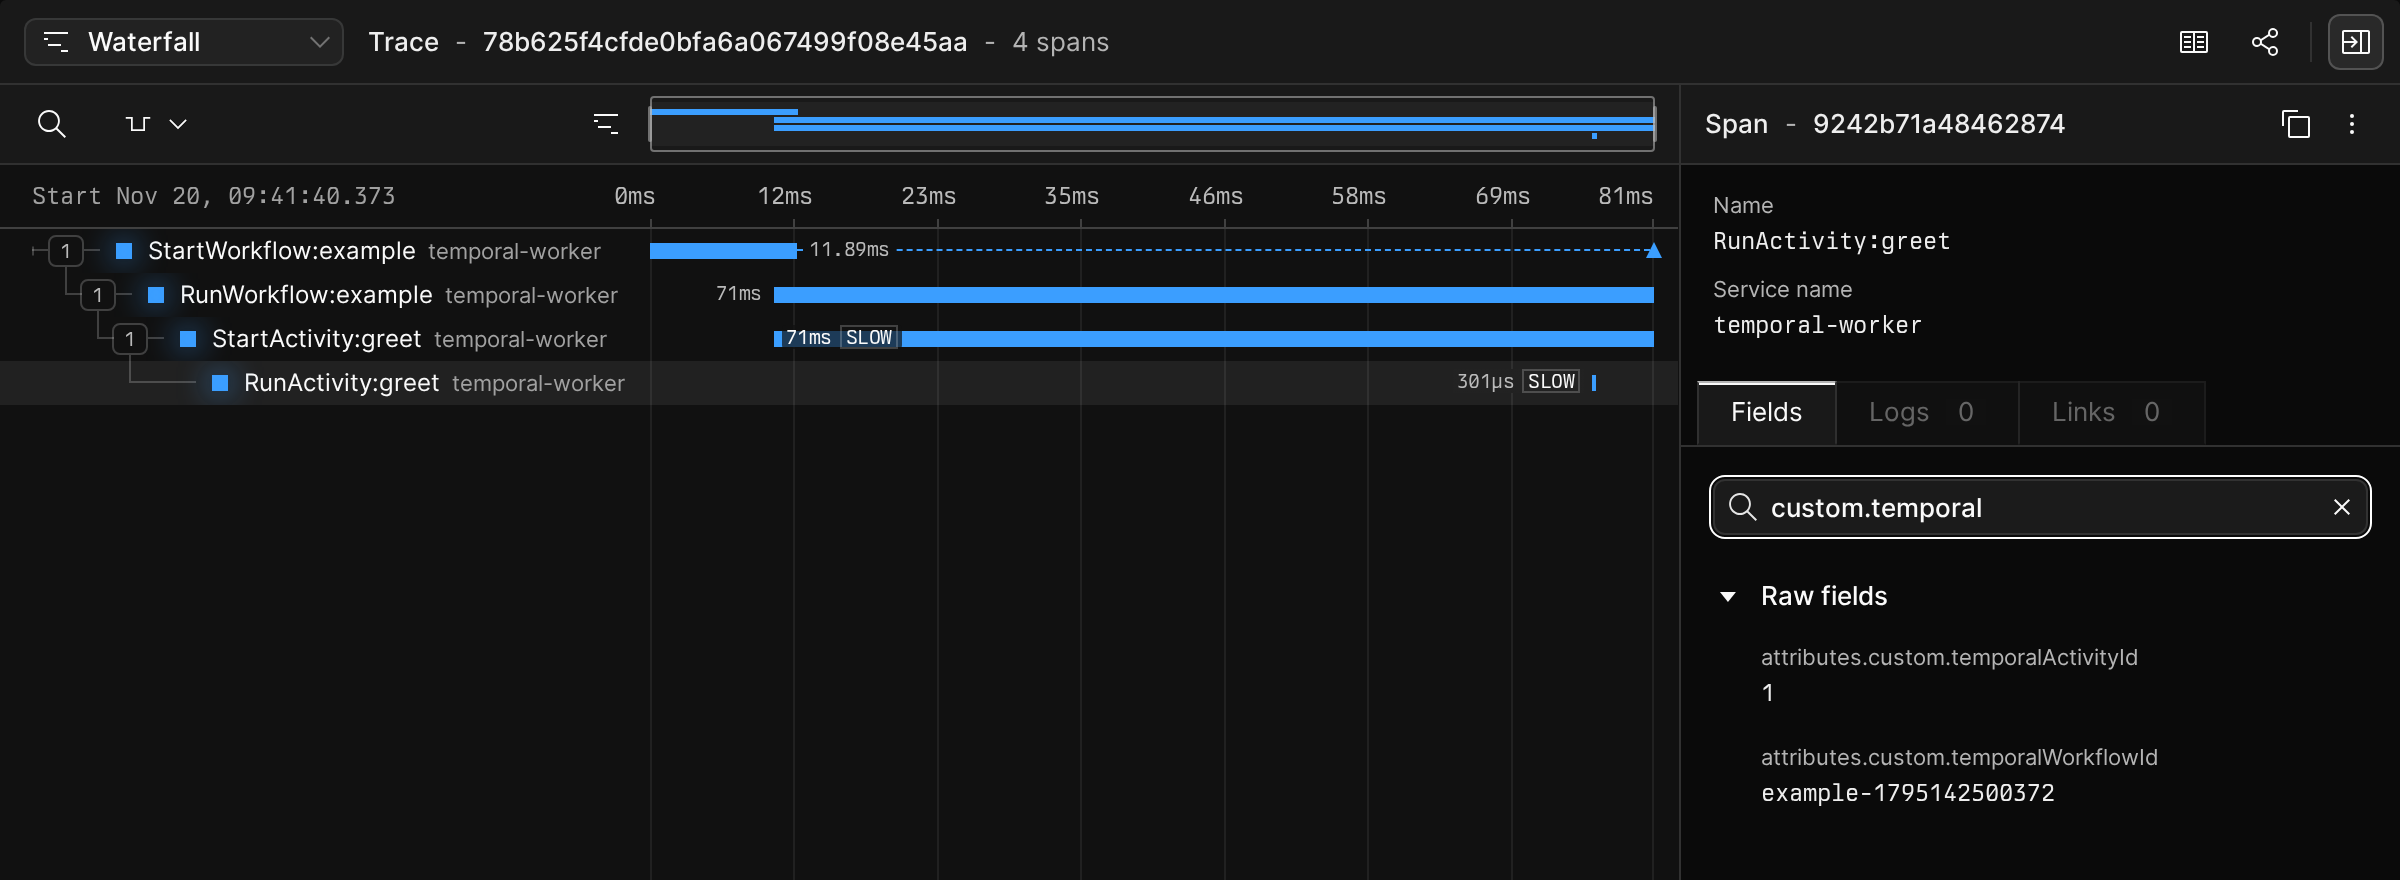
To find slow activities, run the following query:
For more information, see Explore traces.
Send Temporal Cloud metrics
Temporal Cloud exposes metrics about namespaces, workflows, activities, and task queues at https://metrics.temporal.io/v1/metrics in OpenMetrics format. Axiom ingests metrics over OTLP, so run an OpenTelemetry Collector that scrapes the endpoint and forwards the metrics to Axiom.
Create a Temporal Cloud API key
In Temporal Cloud, create a service account with the Metrics Read-Only account-level role, and then generate an API key for it. Only an Account Owner or Global Admin can grant this role. For more information, see the Temporal Cloud OpenMetrics quickstart.
Save the API key to a file that the Collector reads, for example /etc/otelcol-contrib/temporal-cloud-api-key. Replace TEMPORAL_CLOUD_API_KEY with the API key:
Configure the OpenTelemetry Collector
Add a Prometheus receiver that scrapes Temporal Cloud and an OTLP/HTTP exporter that sends data to Axiom:
Consider the following when you configure the scrape job:
- Temporal Cloud aggregates metrics in one-minute windows, and each scrape returns only the most recently completed window. A 60-second scrape interval collects every window. Longer intervals skip windows.
- Temporal Cloud returns metrics with a delay of about three minutes and timestamps each data point with its aggregation window. Keep
honor_timestamps: trueso Axiom stores the data points at the time they describe. - Temporal Cloud rate-limits the endpoint per Temporal Cloud account. Run one scrape job per account rather than one per Collector replica. For the current limits, see the Temporal Cloud OpenMetrics API reference.
- To reduce the volume of data, filter by namespace or metric with query parameters. For example, add
params: { namespaces: ["production-*"] }to the scrape job. For all query parameters and opt-in labels, see the Temporal Cloud OpenMetrics API reference.
Query Temporal Cloud metrics
Temporal Cloud exposes all metrics as gauges, but they measure different things. Rate metrics, such as temporal_cloud_v1_workflow_success_count, are per-second rates averaged over each one-minute window. Value metrics, such as temporal_cloud_v1_approximate_backlog_count, are current values. Metrics ending in _p50, _p95, or _p99 are precomputed latency percentiles in seconds. Every metric carries the temporal_namespace, temporal_account, and region tags. For the full list, see the Temporal Cloud metrics reference.
To chart successful workflows per second by namespace, run the following query:
To chart the task queue backlog, run the following query:
For more information, see Metrics.
Optional: Send self-hosted Temporal metrics
A self-hosted Temporal Service exposes its own metrics in Prometheus format when you set global.metrics.prometheus.listenAddress in its configuration. For the development server, start it with the --metrics-port flag, for example temporal server start-dev --metrics-port 8000. For more information, see Temporal Service configuration and Monitor Temporal Platform metrics.
To send these metrics to Axiom, add a scrape job to the Prometheus receiver of the Collector configuration above:
If you only run a self-hosted Temporal Service, remove the temporal-cloud job. For the metrics that the Temporal Service emits, see the Temporal Service metrics reference.
Temporal SDKs can also expose worker metrics on a Prometheus endpoint. To send them to Axiom, add the endpoint as another scrape target. For more information, see SDK metrics.